. 2016 Jul 22:7:12260.
doi: 10.1038/ncomms12260.

Genetic lineage tracing defines myofibroblast origin and function in the injured heart

Affiliations

Genetic lineage tracing defines myofibroblast origin and function in the injured heart

Onur Kanisicak et al. Nat Commun. .

Abstract

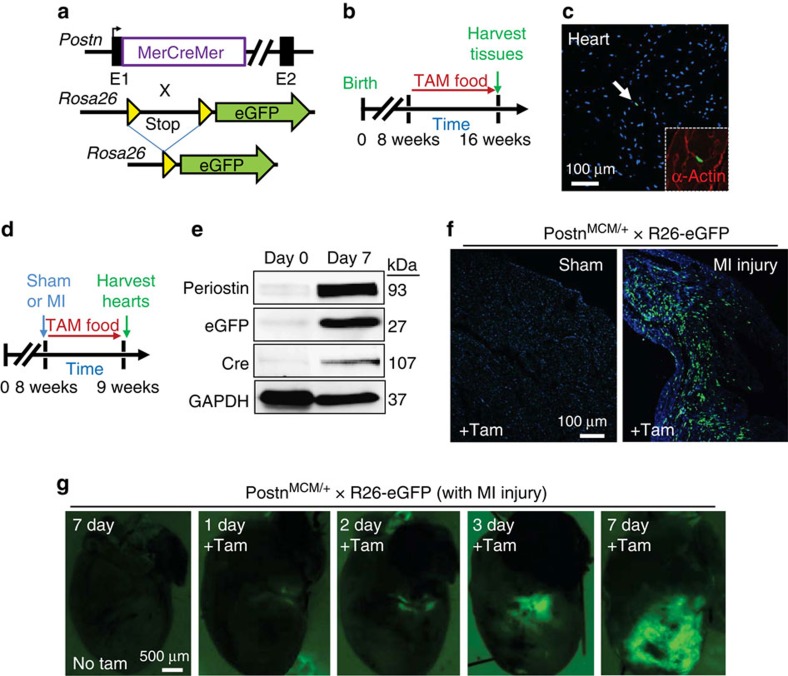
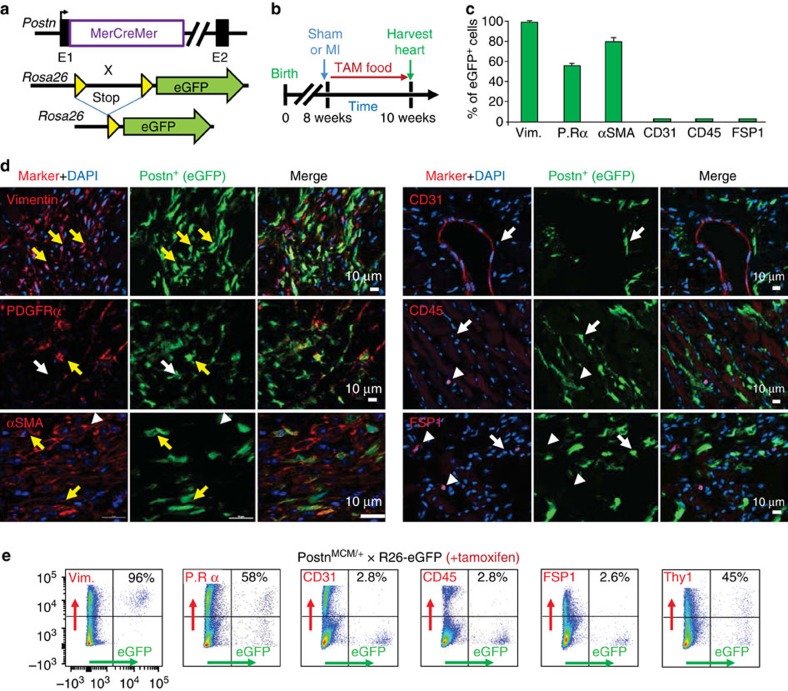
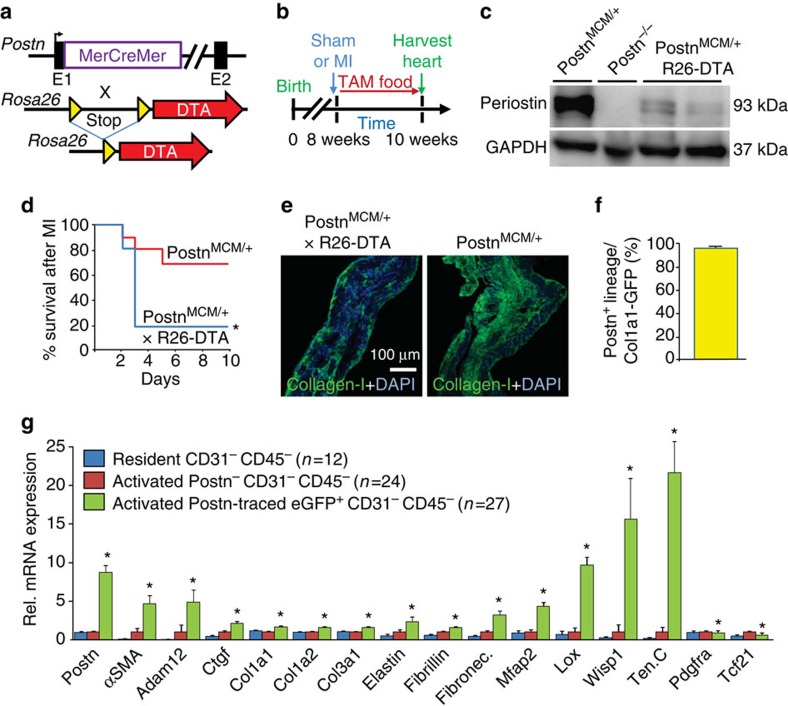
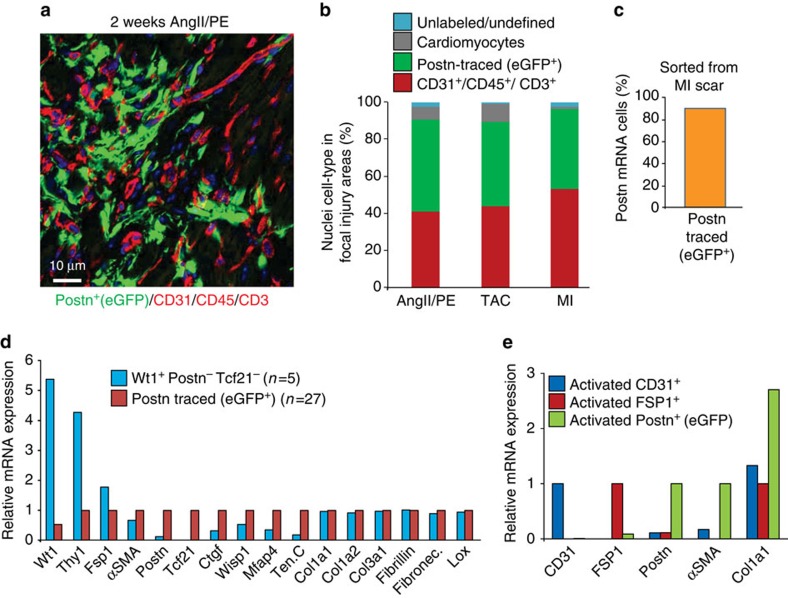
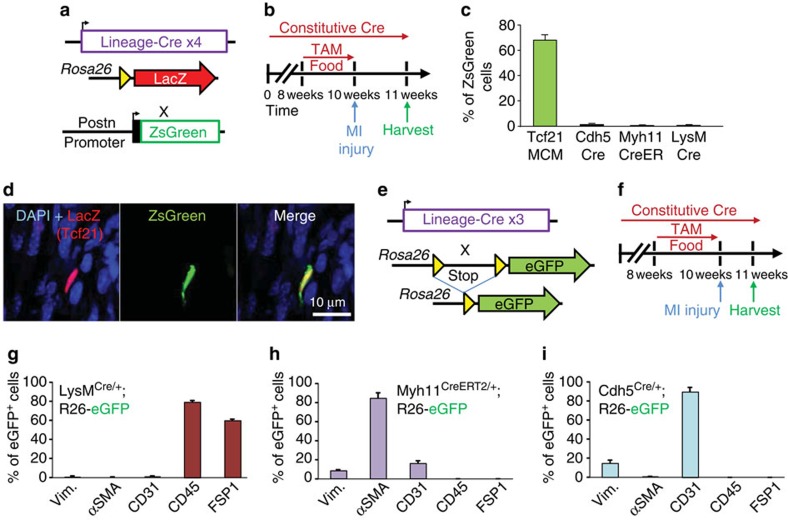
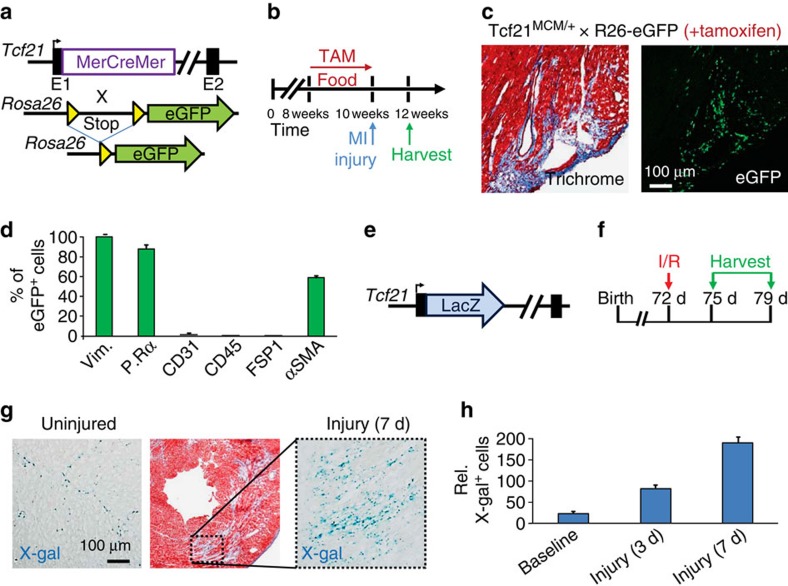
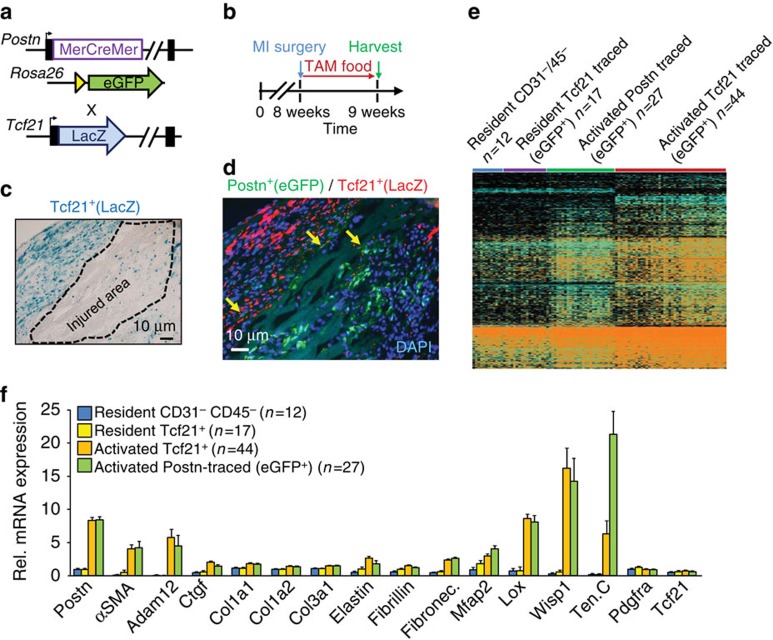
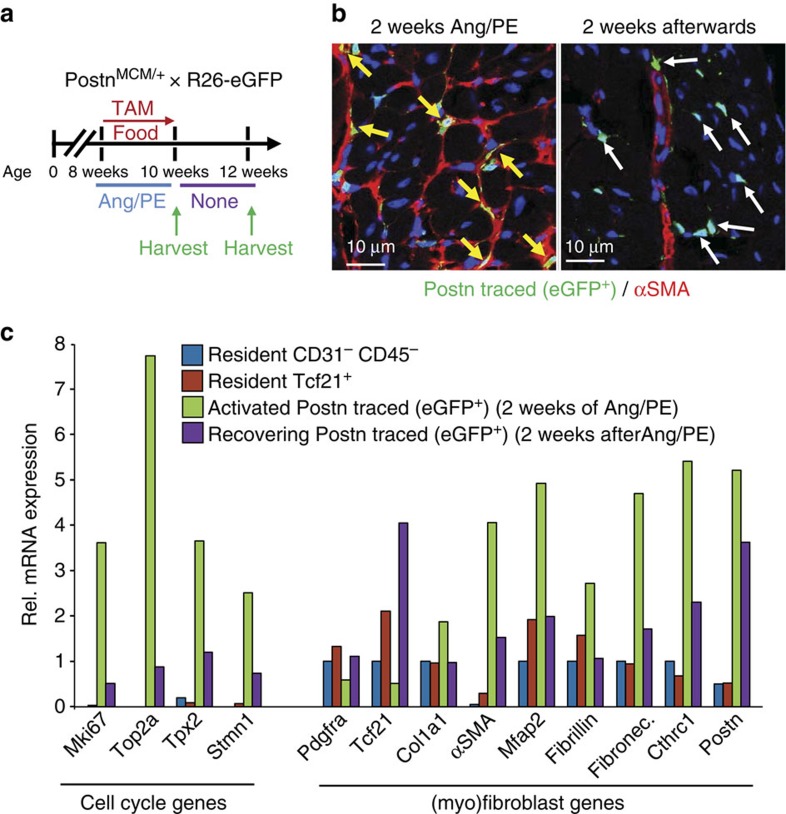
Cardiac fibroblasts convert to myofibroblasts with injury to mediate healing after acute myocardial infarction (MI) and to mediate long-standing fibrosis with chronic disease. Myofibroblasts remain a poorly defined cell type in terms of their origins and functional effects in vivo. Here we generate Postn (periostin) gene-targeted mice containing a tamoxifen-inducible Cre for cellular lineage-tracing analysis. This Postn allele identifies essentially all myofibroblasts within the heart and multiple other tissues. Lineage tracing with four additional Cre-expressing mouse lines shows that periostin-expressing myofibroblasts in the heart derive from tissue-resident fibroblasts of the Tcf21 lineage, but not endothelial, immune/myeloid or smooth muscle cells. Deletion of periostin(+) myofibroblasts reduces collagen production and scar formation after MI. Periostin-traced myofibroblasts also revert back to a less-activated state upon injury resolution. Our results define the myofibroblast as a periostin-expressing cell type necessary for adaptive healing and fibrosis in the heart, which arises from Tcf21(+) tissue-resident fibroblasts.


Conflict of interest statement

The authors declare no competing financial interests.

Figures

Figure 1
Figure 1. PostnMCM allele activity in vivo.
(a) Schematic representation of the Postn genetic locus with a tamoxifen-regulated MerCreMer cDNA cassette inserted into exon 1 (E1), which was crossed with Rosa26 reporter mice (R26-eGFP) containing loxP sites flanking a stop cassette upstream of eGFP to allow for Cre-dependent lineage tracing. (b) Experimental scheme whereby PostnMCM/+; R26-eGFP mice were given tamoxifen for 8 weeks before harvesting at 16 weeks. (c) Representative histological section from the heart of mice described in a and b, which show exceptionally rare labelling of interstitial cells at baseline (arrow) with 8 weeks of tamoxifen. Nuclei are stained in blue. Inset shows α-actin stained cardiomyocytes (red) surrounding the one eGFP-labelled interstitial cell (green) (n=4 mice). (d) Experimental scheme whereby PostnMCM/+; R26-eGFP mice were MI injured or subjected to a sham procedure, then given tamoxifen for 1 week before harvesting. (e) Western blot analysis for periostin, eGFP, Cre (MerCreMer protein) and GAPDH as a control at day 0 before injury or day 7 after MI injury with 1 week of tamoxifen (n=3 mice per condition). (f) Representative histological sections showing eGFP-labelled interstitial cells in hearts of PostnMCM/+; R26-eGFP after MI injury with 7 days of tamoxifen labelling, but not with a sham procedure (n=6 mice for MI and n=3 for sham). (g) Whole-mount fluorescent images of hearts from PostnMCM/+; R26-eGFP mice for direct eGFP fluorescence over the given time course shown. A no tamoxifen control 7 days after MI is also shown (n=3 mice per time point and condition).
Figure 2
Figure 2. PostnMCM allele labels myofibroblasts after MI injury.
(a) Schematic representation of the PostnMCM mouse crossed with a Rosa26-eGFP reporter mouse (R26-eGFP) for lineage tracing. (b) Experimental scheme to lineage trace periostin-expressing cells in vivo for 2 weeks with tamoxifen treatment immediately after MI injury or a sham procedure. (c) Quantification of co-labelling of eGFP+ (periostin+) cells with cell markers from immunohistochemical processed heart sections. Data are averaged from three hearts with >20 sections each quantified. P.Rα signifies PDGFRα. (d) Representative immunohistochemical images for eGFP cellular expression (green) of periostin+ cells and co-staining for vimentin, PDGFRα, αSMA, CD31, CD45 or FSP1 in red. The yellow arrows show co-staining, the white arrows show eGFP/periostin+ only, and the white arrow heads show marker expression only without eGFP+. (e) Representative flow cytometry plots of isolated eGFP+ cells (rightward scatter) against the cell markers depicted (upwards scatter). The percentage of cells that are marker+ among the GFP+ population of cells is shown in each upper right quadrant of the individual FACS plots and was averaged from four hearts each. All error bars represent s.e.m.
Figure 3
Figure 3. Periostin+ interstitial cells mediate cardiac fibrosis.
(a) Schematic representation of the PostnMCM mouse crossed with Rosa26-DTA mouse to permit killing of all periostin+ cells. (b) Experimental scheme to delete all periostin-expressing cells over 2 weeks of cardiac remodelling after MI injury when tamoxifen is present to induce MerCreMer protein activity. (c) Western blot analysis from the hearts of PostnMCM/+; R26-DTA mice 7 days after MI injury from the genotypes shown. Periostin and GAPDH (control) protein expression are shown. Heart-protein extracts from a Postn−/− mouse is shown as a negative control, and a heterozygous PostnMCM/+ mouse is the positive control for endogenous periostin expression with injury. (d) Survival plot in days following MI injury for the two genotypes of mice shown, both treated with tamoxifen for 2 weeks (n=18 for PostnMCM/+; R26-DTA and n=12 PostnMCM/+, *P<0.05 versus PostnMCM/+). (e) Collagen type 1 immunohistochemistry (green) from the infarct region of the heart from mice shown in d. Nuclei are shown in blue. (f) Quantification of periostin lineage-traced cells from the heart after MI injury, which are also positive for current Col1a1-GFP expression. Data are averaged from three hearts with greater than three non-consecutive entire heart sections fully quantified. (g) Quantification of the indicated mRNAs in the defined cell populations shown, from hearts of PostnMCM/+; R26-eGFP mice 7 days after MI injury. CD31 (endothelial) and CD45 (myeloid) cells were excluded, and then eGFP+ or eGFP cells were collected for single-cell RNAseq. ‘Activated’ cells were generated from the infarct region directly, while resident cells were from non-MI injured hearts. *P<0.05 versus non-Postn cells in the infarct region that were also CD31 CD45. Number of cells analysed is shown in the graph. Activated Postn+ CD31 CD45 cells were visualized to confirm myofibroblast features. All error bars in the figure represent s.e.m. For statistical analyses student’s two-tailed t-test have been performed.
Figure 4
Figure 4. Periostin lineage tracing accounts for essentially all the myofibroblasts in the heart.
(a) Representative histological image of an area of focal fibrosis in the hearts of PostnMCM/+; R26-eGFP mice 2 weeks after Ang/PE infusion. Immunohistochemistry is shown for CD31/CD45/CD3 in red, myofibroblasts are shown in green (periostin lineage traced), and myocytes can be quantified based on autofluorescence imaging. All cellular staining was matched to nuclei (blue), which (b) generated a quantitative assessment of the total cellularity in the Ang/PE focal injury areas, or focal injury areas with TAC and MI surgery (2 weeks afterwards). Data were averaged from three hearts for each condition with greater than five non-consecutive sections containing at least three infarct zones quantified. (c) Quantification of Postn-traced (eGFP+) cells within Postn mRNA expressing CD31CD45 cells isolated from the infarct region of PostnMCM/+; R26-eGFP mice generated from single-cell RNAseq analysis. The data show recombination efficiency of the PostnMCM allele. (d) Relative mRNA expression for the indicated genes generated from single-cell RNAseq analysis of 152 cells isolated from the MI injury region, from which 27 were selected as perisotin lineage-traced (eGFP+) myofibroblasts and 5 were averaged as a unique cell type that had an unorthodox fibroblast-like profile and negative for eGFP (Postn). (e) Relative mRNA expression for the genes shown from cells sorted from the MI region (‘activated’) of the heart for CD31 expression, FSP1 expression or periostin expression (eGFP+).
Figure 5
Figure 5. Periostin+ myofibroblasts are derived from the Tcf21 lineage.
(a) Schematic representation of four different lineage-specific Cre-expressing mouse lines crossed with a LacZ-expressing reporter in the Rosa26 locus, further crossed with mice containing a periostin promoter transgene-driving ZsGreen. (b) Experimental scheme to lineage trace from each of four different Cre-expressing mouse lines at baseline and after MI injury, harvested 1 week later. The Myh11CreERT2/+ mice required tamoxifen treatment for 2 weeks before MI injury to generate traced cells, and the tamoxifen was removed 3 days before MI surgery. (c,d) Quantification and representative images of lineage-traced cells (red, for LacZ) and ZsGreen from the periostin transgene from the MI region of the heart. LacZ was detected with an antibody (n=4–6 hearts, >20 sections each were quantified with >100 total ZsGreen+ cells counted). (e) Schematic representation of three different Cre-expressing knock-in mouse lines shown in gi crossed with the eGFP expressing reporter in the Rosa26 locus. (f) Experimental scheme to lineage trace from each of three different Cre-expressing mouse lines shown in gi at baseline and after MI injury. (gi) Quantification of immunohistochemistry analysis for vimentin, αSMA, CD31, CD45 and FSP1 that also co-labelled as lineage-traced cells from LysMCre, Myh11CreERT2 and Cdh5Cre alleles (n=3 hearts, >20 sections were quantified, n>200 cells counted for each of the indicated genotypes). All error bars in the figure represent s.e.m.
Figure 6
Figure 6. Tcf21+ resident fibroblasts in the adult heart expand with injury.
(a) Schematic representation of the Tcf21MCM mouse crossed with a Rosa26-eGFP reporter mouse for lineage tracing. (b) Experimental scheme to lineage trace Tcf21-expressing cells in vivo for 2 weeks with tamoxifen until 3 days before MI injury, then hearts are harvested 2 weeks after MI injury without tamoxifen. (c) Representative Masson’s trichrome-stained histological section and a parallel section showing eGFP expression in the infarct and border zone region of an MI-injured heart from Tcf21MCM/+; R26-eGFP mice. (d) Quantification of Tcf21 lineage-traced (eGFP+) fibroblasts numbers from histological sections of hearts from Tcf21MCM/+; R26-eGFP mice 2 weeks after MI injury that were positive by immunohistochemistry-based analysis for the six markers shown along the bottom of the graph (n=3 hearts, >20 sections each were quantified for >200 cells). P.Rα signifies PDGFRα. (e) Schematic representation of the Tcf21LacZ knock-in allele containing mouse, which was used (f) to show real-time Tcf21 expression in the heart 3 and 7 days after cardiac ischaemia/reperfusion (I/R) injury in young adults. (g) Histological sections from the hearts of Tcf21LacZ mice stained for LacZ expression using x-gal as a substrate (blue) at baseline or 7 days after injury. A Masson’s trichrome-stained heart section is also shown, which stains fibrotic material in blue and normal myocardium in red. (h) Quantification of total LacZ-expressing cells (x-gal stained) at baseline and 3 and 7 days after injury in the focal fibrotic regions of the heart, showing expansion of Tcf21-expressing cells. Data are form n>3 hearts per time point with greater than five non-consecutive sections from infarct zone quantified. Error bars represent s.e.m.
Figure 7
Figure 7. Periostin+ myofibroblasts derive from Tcf21 resident fibroblasts.
(a) Schematic representation of the PostnMCM mouse crossed with a Rosa26-eGFP reporter mouse (R26-eGFP) for lineage tracing, which was further crossed with the Tcf21LacZ knock-in mouse line. (b) Experimental scheme to lineage trace periostin-expressing myofibroblasts in vivo for 1 week with tamoxifen treatment immediately after MI injury. (c) Representative histological section from an MI region of the heart of a PostnMCM/+; R26-eGFP mouse that also contained the Tcf21LacZ allele. The section is only stained for x-gal activity (LacZ expression), and Tcf21+ expanded fibroblasts appear around the demarked injured region. (d) Same scheme as in c except that immunohistochemistry was used to detect LacZ (Tcf21 current expression, red staining) and periostin lineage-traced cells in green. The yellow arrows show a few rare transitional cells that express both periostin and Tcf21. Nuclei are stained in blue (n=4 hearts). (e) Thermogram of gene expression patterns from RNAseq of representative individual cells from the hearts of PostnMCM/+; R26-eGFP or Tcf21MCM/+; R26-eGFP mice. (e,f) Cells were negatively sorted for CD31 and CD45 and were either Tcf21 lineage traced (eGFP+) and sorted from uninjured hearts (yellow bars in f) or from the MI region 7 days after injury as `activated'. As another control periostin lineage-traced cells were collected from the MI region of the heart 7 days after injury for comparison. A population of total interstitial cells were used as a control, which were negatively sorted for CD31 and CD45 from the remote region of the heart. Data produced from a total of 185 cells isolated from three mice in each group in e, and a subset is shown in f. Error bars represent s.e.m.
Figure 8
Figure 8. Periostin+ myofibroblasts can convert back towards a resident fibroblast program with cessation of tissue injury.
(a) Schematic representation of the cardiac injury protocol used. (b) Representative images of immunohistochemistry for αSMA reactivity, along with eGFP+ cells from lineage tracing in PostnMCM/+; R26-eGFP mice that were given Ang/PE and tamoxifen for 2 weeks (first panel) then allowed to recover for 2 weeks with no stimulation or labelling with tamoxifen (second panel). The yellow arrows show myofibroblasts expressing αSMA (red) that were also periostin lineage-traced (green) during the injury response. The white arrows show how after regression of the fibrotic response the eGFP+ cells persist, but no longer express αSMA (n=3). (c) RNA expression profiling for the genes shown along the bottom of the graph, from the indicated cell types, either right after Ang/PE injury for 2 weeks, or after 2 additional weeks without stimulation. Cells were sorted as total resident mesenchymal cells lacking CD31 and CD45 from uninjured hearts (blue bars), resident Tcf21-expressing cells from uninjured hearts (red bars), activated periostin lineage-traced (eGFP+) myofibroblasts immediately after Ang/PE infusion (green bars), and periostin lineage-traced (eGFP+) cells 2 additional weeks after injury when the fibrotic response was regressing (purple bars). Data from two separate replicates pooled from three hearts for each group are shown.

References

    1. Shah A. M. & Mann D. L. In search of new therapeutic targets and strategies for heart failure: recent advances in basic science. Lancet 378, 704–712 (2011). - PMC - PubMed
    1. Ertl G. & Frantz S. Healing after myocardial infarction. Cardiovasc. Res. 66, 22–32 (2005). - PubMed
    1. Borthwick L. A., Wynn T. A. & Fisher A. J. Cytokine mediated tissue fibrosis. Biochim. Biophys. Acta 1832, 1049–1060 (2013). - PMC - PubMed
    1. Davis J. & Molkentin J. D. Myofibroblasts: trust your heart and let fate decide. J. Mol. Cell. Cardiol. 70, 9–18 (2014). - PMC - PubMed
    1. Kis K., Liu X. & Hagood J. S. Myofibroblast differentiation and survival in fibrotic disease. Expert Rev. Mol. Med. 13, e27 (2011). - PMC - PubMed

Publication types