. 2016 Jul 22;12(7):e1005030.
doi: 10.1371/journal.pcbi.1005030. eCollection 2016 Jul.

Inference for Stochastic Chemical Kinetics Using Moment Equations and System Size Expansion

Affiliations

Inference for Stochastic Chemical Kinetics Using Moment Equations and System Size Expansion

Fabian Fröhlich et al. PLoS Comput Biol. .

Abstract

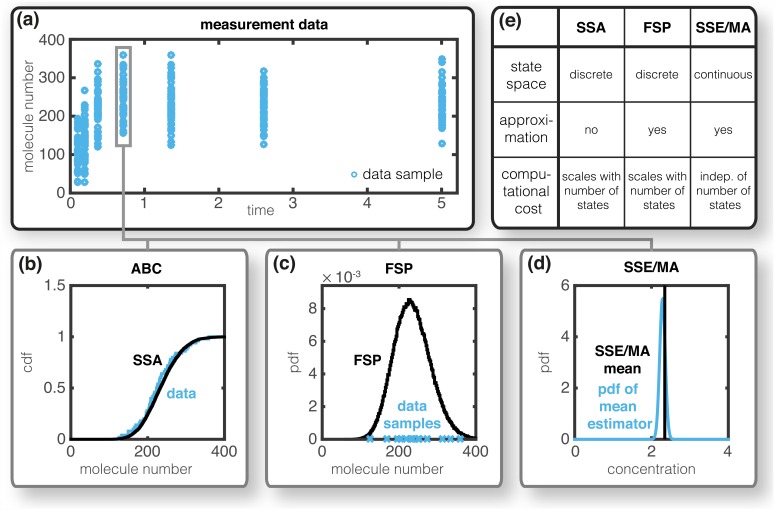
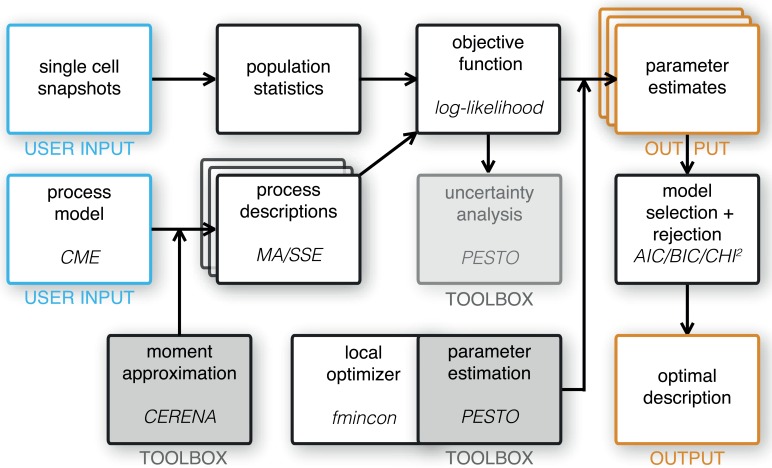
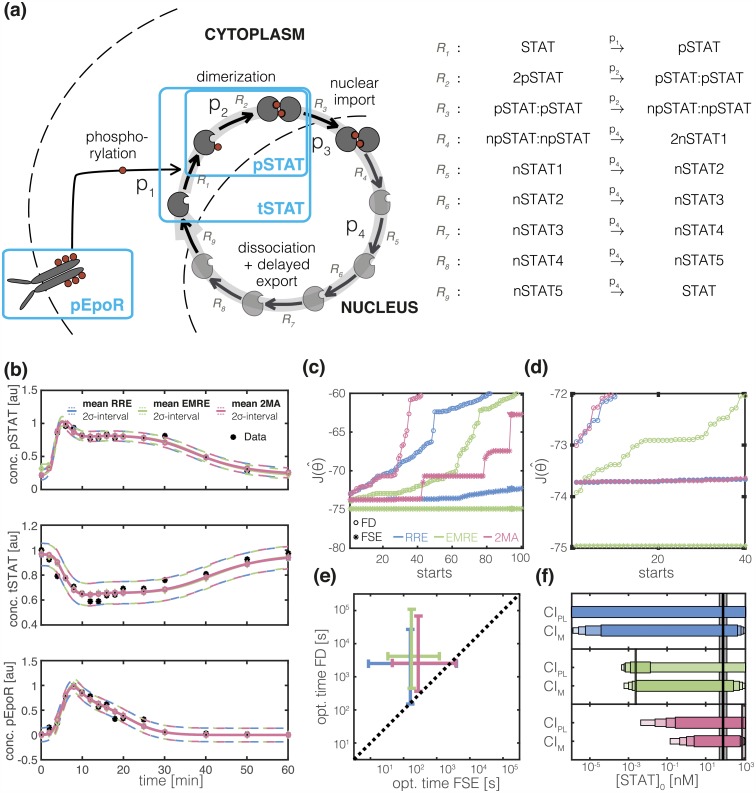
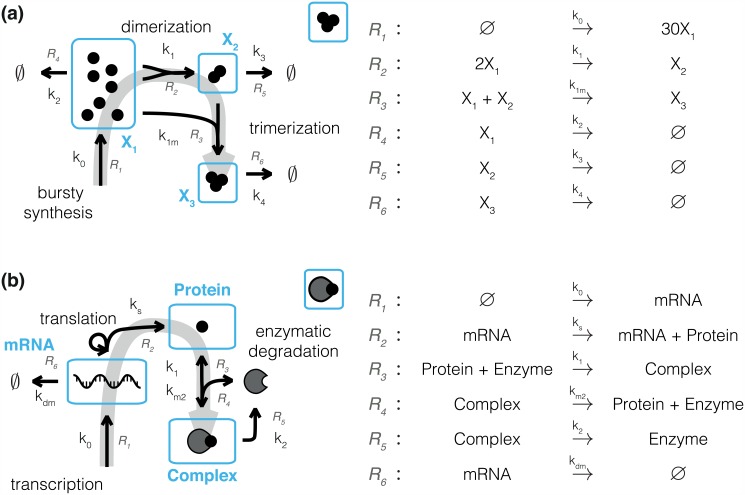
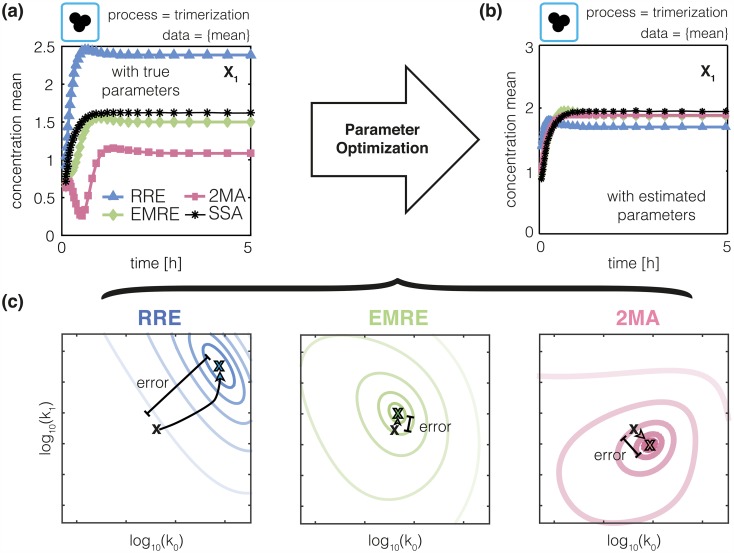
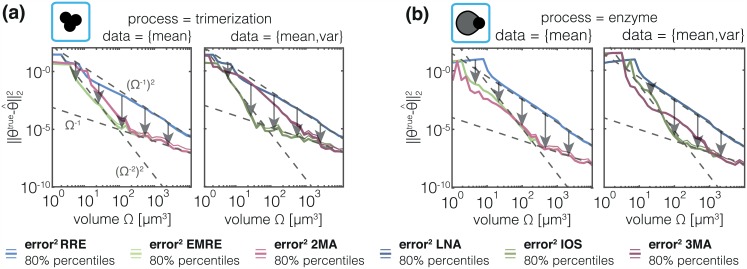
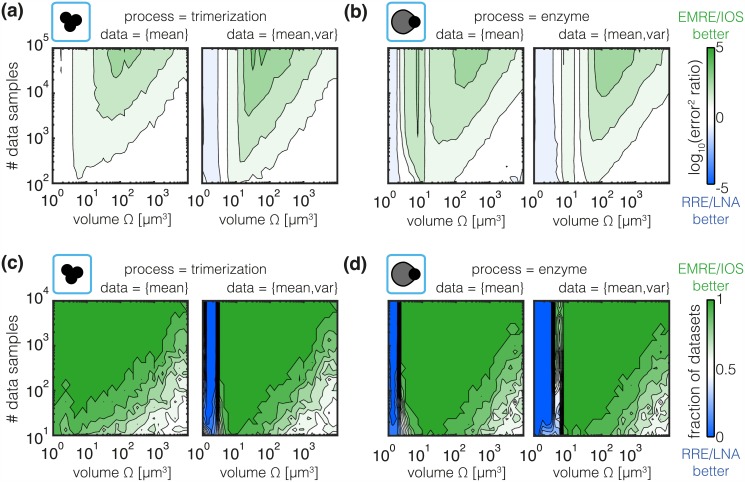
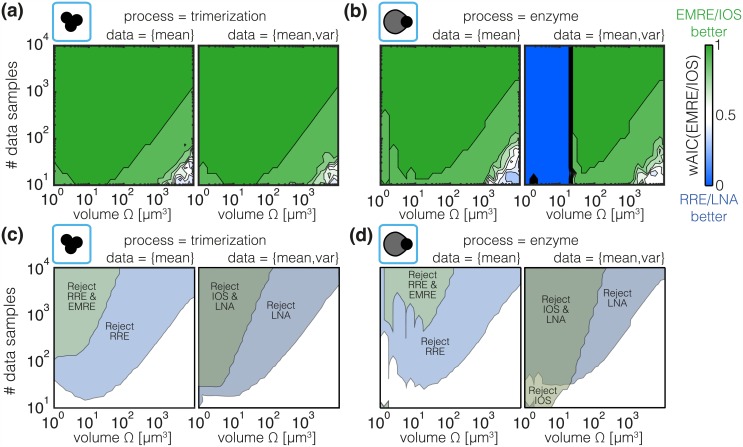
Quantitative mechanistic models are valuable tools for disentangling biochemical pathways and for achieving a comprehensive understanding of biological systems. However, to be quantitative the parameters of these models have to be estimated from experimental data. In the presence of significant stochastic fluctuations this is a challenging task as stochastic simulations are usually too time-consuming and a macroscopic description using reaction rate equations (RREs) is no longer accurate. In this manuscript, we therefore consider moment-closure approximation (MA) and the system size expansion (SSE), which approximate the statistical moments of stochastic processes and tend to be more precise than macroscopic descriptions. We introduce gradient-based parameter optimization methods and uncertainty analysis methods for MA and SSE. Efficiency and reliability of the methods are assessed using simulation examples as well as by an application to data for Epo-induced JAK/STAT signaling. The application revealed that even if merely population-average data are available, MA and SSE improve parameter identifiability in comparison to RRE. Furthermore, the simulation examples revealed that the resulting estimates are more reliable for an intermediate volume regime. In this regime the estimation error is reduced and we propose methods to determine the regime boundaries. These results illustrate that inference using MA and SSE is feasible and possesses a high sensitivity.


Conflict of interest statement

The authors have declared that no competing interests exist.

Figures

Fig 1
Fig 1. Inference methods for stochastic processes.
(a) Single-cell snapshot data collected using a high-throughput technique, such as flow cytometry. (b) Empirical density functions for SSA runs (black —) and experimental data (blue —), the difference is used as distance measure in Approximate Bayesian Computing. (c) Instantaneous probability distribution computed using FSP (black —) to evaluate the likelihood of the observing the individual cells (blue ×). (d) Mean computed using MA/SSE (black —) as well as measured mean and its uncertainty (blue —). (e) Summary of the properties of the displayed methods.
Fig 2
Fig 2. Workflow for modeling, parameter estimation and model selection.
User inputs are colored in blue, workflow outputs are colored in orange. MATLAB toolboxes are indicated by gray boxes. The employed method/function/toolbox is indicated as oblique text in every box where applicable.
Fig 3
Fig 3. Parameter inference using EMRE and 2MA for JAK/STAT signaling pathway.
(a) Schematic of JAK/STAT signaling pathway including biochemical reactions (→), biochemical species (gray elements) and observed outputs (blue boxes). Elements introduced to capture the delayed export of pSTAT from the nucleus are indicates as light gray. For subplots (b)-(e): RRE (blue), EMRE (green) and 2MA (red). (b) Experimental data (*), fitted mean (—) and estimated 2σ interval of the measurement noise (- -). (c) Objective function values for the best 100 (out of 1000) multi-starts obtained using forward sensitivity analysis (FSE, *) and finite differences (FD, °) for gradient calculation. Local optimization for RRE, EMRE and 2MA used the same initial parameter values. (d) Zoom-in of the 40 best multi-starts. (e) Median (+) and 80% percentile interval of computation time per local optimizer run. (f) Estimate of initial STAT concentration. Vertical lines mark the maximum likelihood estimates and the horizontal bars represent the confidence(CIPL)/credibility(CIM) intervals corresponding to different significance levels (80%, 90%, 95% and 99%) computed using profile likelihoods/MCMC samples. The reference value with 95% confidence intervals [71] is depicted by a black line and gray bar respectively.
Fig 4
Fig 4. Reaction networks for comprehensive in silico evaluation of mesoscopic and macroscopic approaches.
(a) Schematic of the trimerization process. (b) Schematic of the enzymatic degradation process. Arrows indicate reactions with the corresponding rate and reaction index next to them. Observed states are outlined and labeled in blue. A gray arrow represents the direction of information flow.
Fig 5
Fig 5. Approximation error introduces estimation error.
(a) Mean monomer concentration in the trimerization process for Ω = 6μm3 computed from 105 SSA trajectory realizations (black line). Approximate mean monomer concentrations obtained using RRE, EMRE and 2MA (colored lines). (b) Mean monomer concentration for RRE, EMRE and 2MA obtained after parameter estimation using the SSA mean as artificial dataset. (c) True (black ×) and optimized parameter values (colored ×) for RRE, EMRE and 2MA. Contour lines of objective function are colored. The opacity increases with increasing likelihood values.
Fig 6
Fig 6. Quantification of volume dependence of estimation error.
Medians (thick line) and symmetric 80% percentile based confidence intervals (thin lines) of the errors for two representative parameters of (a) the trimerization process and (b) enzymatic degradation process. Results for different meso- and macroscopic models are color-coded and panels show datasets computed from 105 single-cell measurements: (left) data = {mean}; and (right) data = {mean,variance}. The estimated convergence order for the intermediate and high-volume regimes is indicated as gray dotted lines.
Fig 7
Fig 7. Quantification of sample size dependence of estimation error.
(a,b) Ratio of the absolute estimation errors. Green indicates a lower estimation error for EMRE and IOS while blue indicates a lower estimation error for RRE and LNA. (c,d) Frequency for lower estimation error for EMRE and IOS compared to RRE and LNA. The color indicates the fraction of datasets for which EMRE and IOS yields a lower estimation error than RRE and LNA.
Fig 8
Fig 8. Analysis of model selection and rejection criteria.
(a) and (b) Median AIC weight for EMRE and IOS at respective estimated parameters. A green color indicates that the EMRE and IOS description is more probable and a blue color indicates the RRE and LNA description is more probable. (c) and (d) area in which the models can on average be rejected based on a chi-square test to confidence level 0.01. The coloring indicates the method to which the area corresponds.

Similar articles

Cited by

References

    1. Elowitz MB, Levine AJ, Siggia ED, Swain PS. Stochastic gene expression in a single cell. Science; 2002;297(5584):1183–1186. 10.1126/science.1070919 - DOI - PubMed
    1. Rosenfeld N, Young JW, Alon U, Swain PS, Elowitz MB. Gene regulation at the single-cell level. Science; 2005;307(5717):1962–1965. 10.1126/science.1106914 - DOI - PubMed
    1. Raj A, van Oudenaarden A. Nature, nurture, or chance: Stochastic gene expression and its consequences. Cell; 2008;135(2):216–226. 10.1016/j.cell.2008.09.050 - DOI - PMC - PubMed
    1. Maheshri N, O’Shea EK. Living with noisy genes: how cells function reliably with inherent variability in gene expression. Annu Rev Biophys Biomol Struct; 2007;36:413–434. 10.1146/annurev.biophys.36.040306.132705 - DOI - PubMed
    1. Gillespie DT. A rigorous derivation of the chemical master equation. Physica A; 1992;188(1):404–425. 10.1016/0378-4371(92)90283-V - DOI

Publication types