

Pulsed and oscillating gradient MRI for assessment of cell size and extracellular space (POMACE) in mouse gliomas
- PMID: 27448059
- PMCID: PMC5035213
- DOI: 10.1002/nbm.3577
Pulsed and oscillating gradient MRI for assessment of cell size and extracellular space (POMACE) in mouse gliomas
Abstract
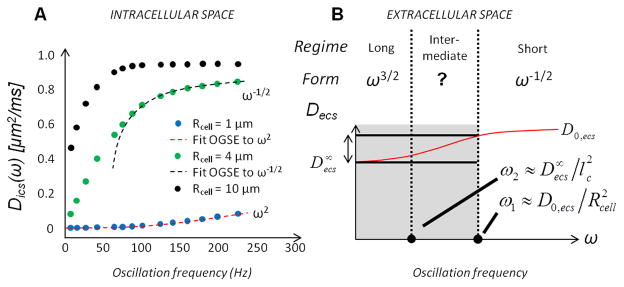
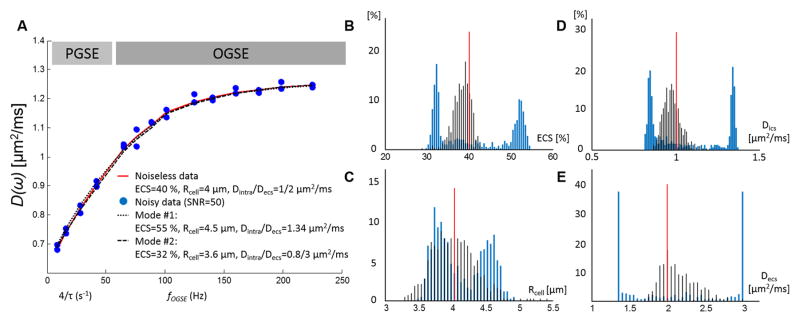
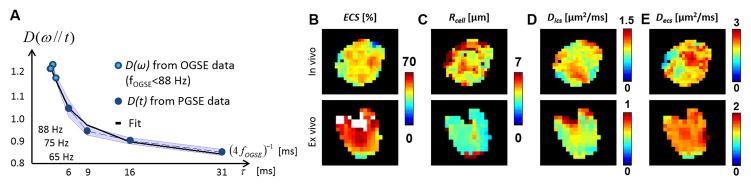
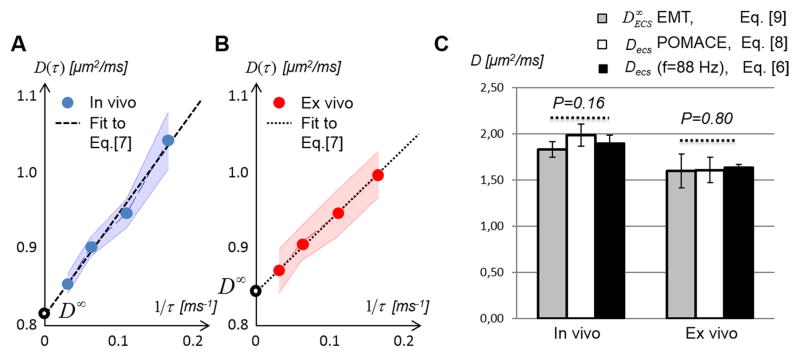
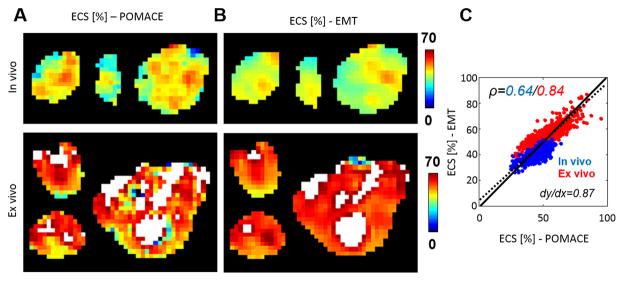
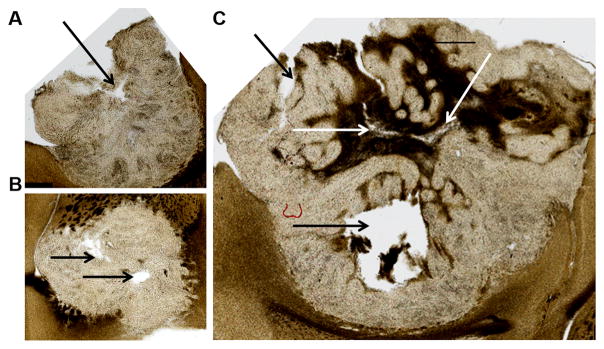
Solid tumor microstructure is related to the aggressiveness of the tumor, interstitial pressure and drug delivery pathways, which are closely associated with treatment response, metastatic spread and prognosis. In this study, we introduce a novel diffusion MRI data analysis framework, pulsed and oscillating gradient MRI for assessment of cell size and extracellular space (POMACE), and demonstrate its feasibility in a mouse tumor model. In vivo and ex vivo POMACE experiments were performed on mice bearing the GL261 murine glioma model (n = 8). Since the complete diffusion time dependence is in general non-analytical, the tumor microstructure was modeled in an appropriate time/frequency regime by impermeable spheres (radius Rcell , intracellular diffusivity Dics ) surrounded by extracellular space (ECS) (approximated by constant apparent diffusivity Decs in volume fraction ECS). POMACE parametric maps (ECS, Rcell , Dics , Decs ) were compared with conventional diffusion-weighted imaging metrics, electron microscopy (EM), alternative ECS determination based on effective medium theory (EMT), and optical microscopy performed on the same samples. It was shown that Decs can be approximated by its long time tortuosity limit in the range [1/(88 Hz)-31 ms]. ECS estimations (44 ± 7% in vivo and 54 ± 11% ex vivo) were in agreement with EMT-based ECS and literature on brain gliomas. Ex vivo, ECS maps correlated well with optical microscopy. Cell sizes (Rcell = 4.8 ± 1.3 in vivo and 4.3 ± 1.4 µm ex vivo) were consistent with EM measurements (4.7 ± 1.8 µm). In conclusion, Rcell and ECS can be quantified and mapped in vivo and ex vivo in brain tumors using the proposed POMACE method. Our experimental results support the view that POMACE provides a way to interpret the frequency or time dependence of the diffusion coefficient in tumors in terms of objective biophysical parameters of neuronal tissue, which can be used for non-invasive monitoring of preclinical cancer studies and treatment efficacy. Copyright © 2016 John Wiley & Sons, Ltd.
Keywords: POMACE; diffusion time dependence; extracellular space; glioma; oscillating gradient spin echo; restrictions.
Copyright © 2016 John Wiley & Sons, Ltd.
Figures
References
-
- Jain RK. Transport of Molecules in the Tumor Interstitium - a Review. Cancer Res. 1987;47(12):3039–3051. - PubMed
-
- Milosevic M, Fyles A, Hedley D, Pintilie M, Levin W, Manchul L, Hill R. Interstitial fluid pressure predicts survival in patients with cervix cancer independent of clinical prognostic factors and tumor - Oxygen measurements. Cancer Res. 2001;61(17):6400–6405. - PubMed
-
- Rofstad EK, Tunheim SH, Mathiesen B, Graff BA, Halsor EF, Nilsen K, Galappathi K. Pulmonary and lymph node metastasis is associated with primary tumor interstitial fluid pressure in human melanoma xenografts. Cancer Res. 2002;62(3):661–664. - PubMed
-
- Yu T, Wang Z, Liu K, Wu Y, Fan J, Chen J, Li C, Zhu G, Li L. High interstitial fluid pressure promotes tumor progression through inducing lymphatic metastasis-related protein expressions in oral squamous cell carcinoma. Clin Transl Oncol. 2014;16(6):539–547. - PubMed
-
- Sun L, Sakurai S, Sano T, Hironaka M, Kawashima O, Nakajima T. High-grade neuroendocrine carcinoma of the lung: comparative clinicopathological study of large cell neuroendocrine carcinoma and small cell lung carcinoma. Pathology international. 2009;59(8):522–529. - PubMed
Publication types
MeSH terms
Grants and funding
LinkOut - more resources
Full Text Sources
Other Literature Sources
Medical
