. 2016 Jul 22:7:12200.
doi: 10.1038/ncomms12200.

Target-dependent biogenesis of cognate microRNAs in human cells

Affiliations

Target-dependent biogenesis of cognate microRNAs in human cells

Mainak Bose et al. Nat Commun. .

Abstract

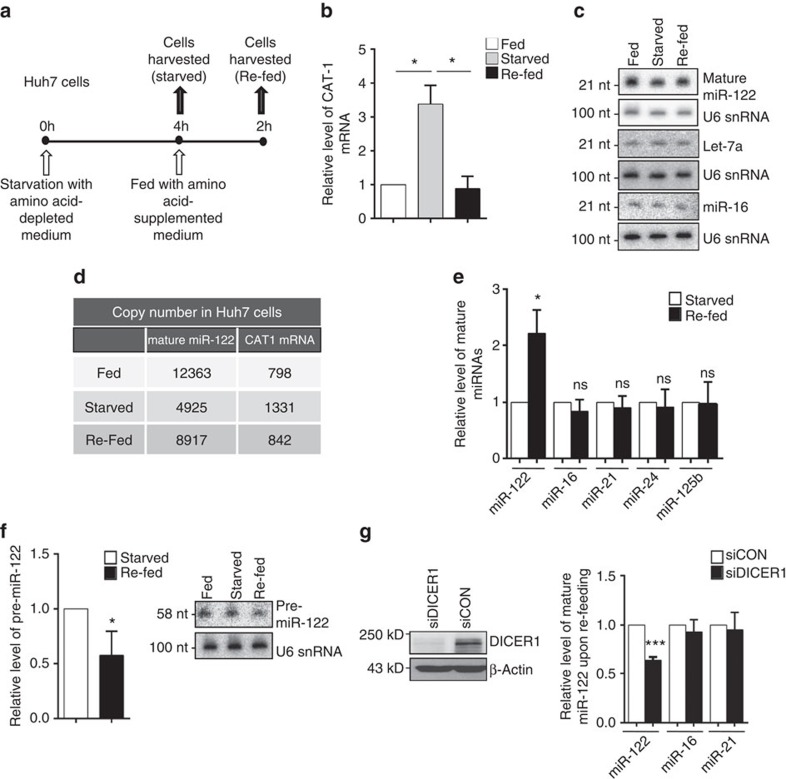
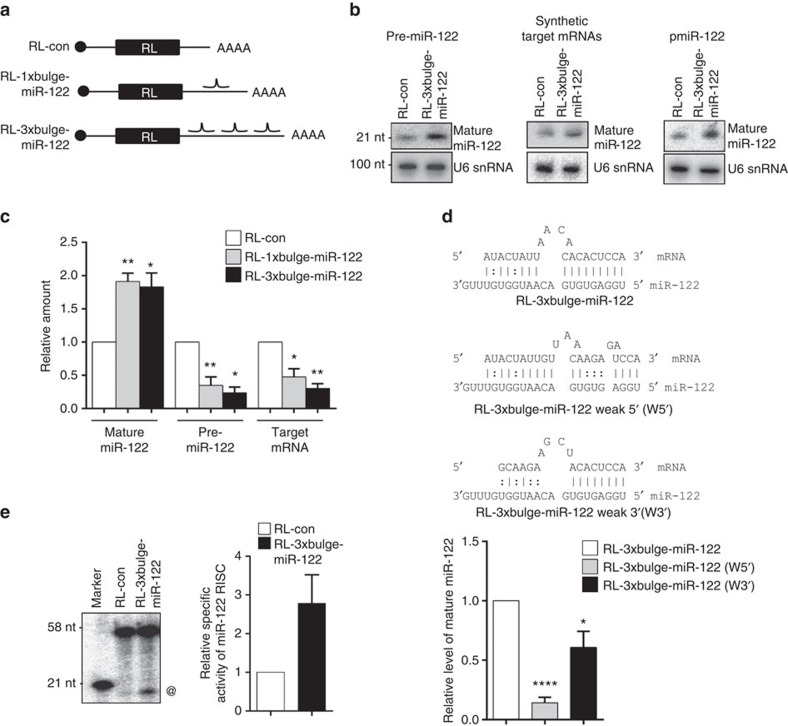
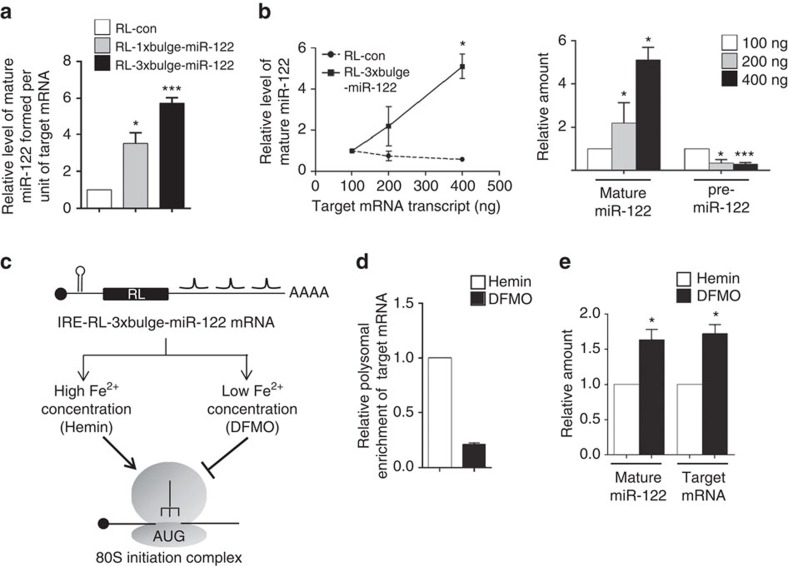
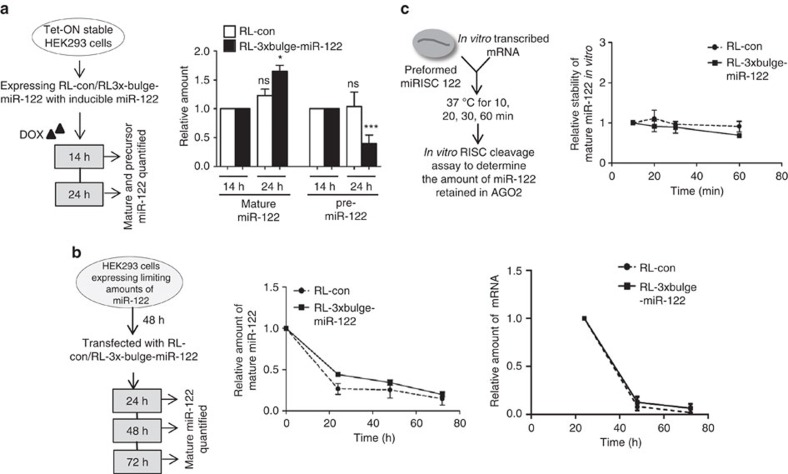
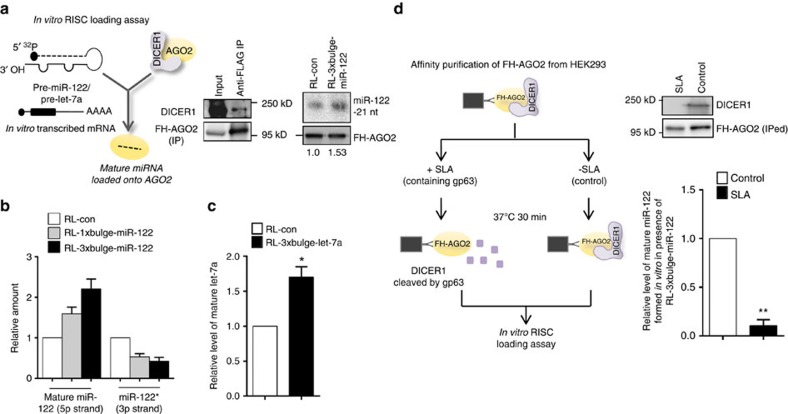
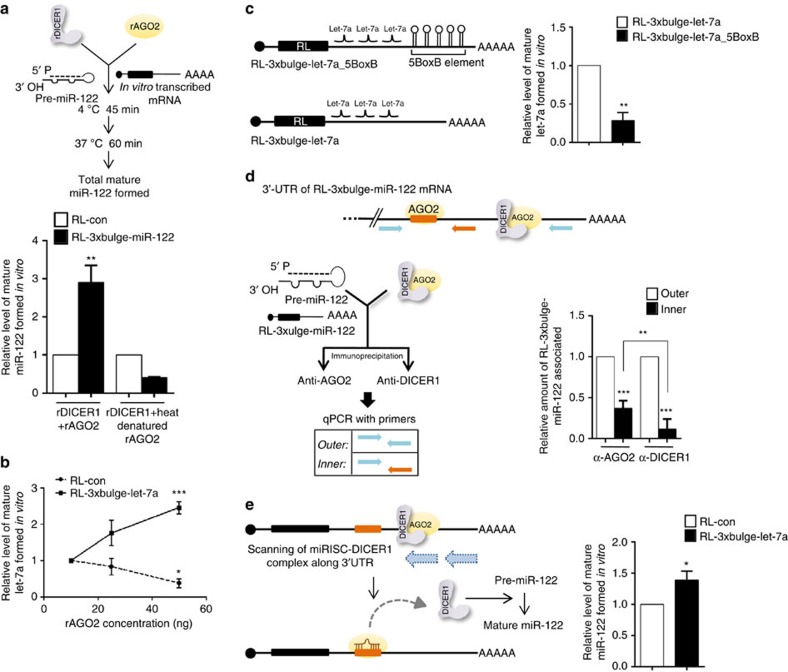
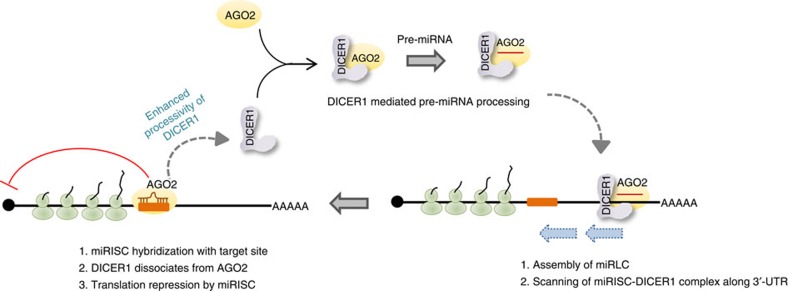
Extensive research has established how miRNAs regulate target mRNAs by translation repression and/or endonucleolytic degradation in metazoans. However, information related to the effect of target mRNA on biogenesis and stability of corresponding miRNAs in animals is limited. Here we report regulated biogenesis of cognate miRNAs by their target mRNAs. Enhanced pre-miRNA processing by AGO-associated DICER1 contributes to this increased miRNP formation. The processed miRNAs are loaded onto AGO2 to form functionally competent miRISCs both in vivo and also in a cell-free in vitro system. Thus, we identify an additional layer of posttranscriptional regulation that helps the cell to maintain requisite levels of mature forms of respective miRNAs by modulating their processing in a target-dependent manner, a process happening for miR-122 during stress reversal in human hepatic cells.


Conflict of interest statement

The authors declare no conflict of interests.

Figures

Figure 1
Figure 1. Reversal of amino acid-starvation-induced stress increases miR-122 biogenesis in Huh7 cells.
(a,b) Outline of the experimental set-up used (a). Relative level of CAT-1 mRNA in Huh7 cells either fed or starved for 4 h and re-fed with media containing amino acids for another 2 h. CAT-1 mRNA levels were quantified by quantitative reverse transcriptase-PCR with levels in Fed cells taken as 1 (b). (c) Effect of starvation and re-feeding on mature miR-122 levels in Huh7 cells. Total RNA was extracted and 8 μg RNA was used for northern blotting of mature miR-122, let-7a and miR-16. U6 snRNA was used as loading control. (d) Copy number/number of molecules of mature miR-122 and CAT-1 mRNA per Huh7 cell calculated in fed, starved and re-fed Huh7 cells. Estimations were done by real-time-based methods. (e) Increase in mature miR-122 but not that of other non-relevant miRNAs, miR-16, miR-21, miR-24 and miR-125b on relief of starvation. Real-time PCR-based quantification of mature miRNA levels in Huh7 cells starved for amino acids (4 h) and subsequently re-fed (2 h). (f) Increase in mature miR-122 is accompanied by a concomitant decrease in pre-miR-122 on re-feeding the starved cells for 2 h. Cellular small RNA population was isolated by mirVANA kit to minimize possible contamination of pri-miR-122 and real-time-based assays were carried out to quantify pre-miR-122. Pre-miR-122 detected by northern blotting with 15 μg total RNA. Synthetic pre-miR-122 was used as a size marker to determine the position of the pre-miR-122 in the northern blotting. (g) Increase of mature miR-122 on re-feeding of starved cells is reduced in DICER1 knockdown Huh7 cells. miR-16 and miR-21 did not show any significant change. siDICER1-mediated knockdown of DICER1 is confirmed by western blotting. Paired two-tailed Student's t-tests were used for all comparisons. *P<0.05, **P<0.01 and ***P<0.001. Error bars represent s.d. (n⩾3).
Figure 2
Figure 2. Target mRNA-dependent increase of mature miR-122 in human cells.
(a) Scheme of the different target mRNAs used. Positions of the miR-122-binding sites are indicated. (b) Effect of RL-3 × bulge-miR-122 on mature miR-122 level in cells transfected with pre-miR-122 and reporter plasmids or in vitro-transcribed mRNAs. In experiment described in the right panel, HEK293 cells co-transfected with plasmid encoding pre-miR-122 (pmiR-122) and RL reporters were used. Total RNA was extracted and northern blotted for mature miR-122, for all the experiments. U6 snRNA was used as loading control. (c) Mature miR-122, pre-miR-122 and target mRNA levels were quantified by quantitative reverse transcriptase–PCR in HEK293 cells expressing target mRNAs and co-transfected with plasmid encoding pre-miR-122. (d) Effect of modification of 5′ or 3′ miR-122-binding site on target mRNA-driven miRNA elevation. Relative quantification of mature miR-122 level increase in the presence of target RL-3 × bulge-miR-122 mRNA and in the presence of mRNAs with weak 5′- region (W5′) or weak 3′-region (W3′). Relative levels were normalized against respective target mRNA levels. (e) In vitro RISC cleavage assay done with protein equivalent amounts of affinity-purified FH-AGO2 isolated from pre-miR-122-transfected FH-AGO2 stable HEK293 cells expressing RL-3 × bulge-miR-122 or RL-con. @, Cleaved product of RISC assay; radio labeled 21-nt band serves as a marker. Paired two-tailed Student's t-tests were used for all comparisons. *P<0.05, **P<0.01 and ***P<0.001. Values plotted are means from at least three biological replicates for c and d, and two biological replicates for e. Error bars represent s.d.
Figure 3
Figure 3. Effect of target mRNA concentration on substrate-dependent miRNA increase in human cells.
(a) Amount of mature miR-122 formed per unit of target mRNA in HEK293 cells transfected with pmiR-122 and respective reporter plasmids. Values were calculated by normalizing the amount of mature miR-122 against the amount of respective target mRNA level and plotted. (b) Effect of increasing concentration of target mRNA on mature miRNA levels. HEK293 cells expressing pre-miR-122 were transfected with increasing amounts of in vitro-transcribed mRNA (RL-con or RL-3 × bulge-miR-122) and mature miR-122 and pre-miR-122 levels were quantified 6 h post transfection. In the left panel, changes in relative level of mature miR-122 has been plotted for experiments done with RL-con or RL-3 × bulge-miR-122. Relative change of mature and pre-miR-122 in the presence of different amounts of RL-3 × bulge-miR-122 was plotted (right panel). Values obtained with 100 ng of transcript to transfect 2 × 10⁵ cells were considered as 1. (c) IRE-RL-3 × bulge-miR-122 mRNA with Ferritin IRE element in 5′-UTR is schematically depicted. (d) Cells transfected with pre-miR-122 and IRE-RL-3 × bulge-miR-122 were split 24 h post transfection and iron chelator DFMO (100 μM) or Fe2+ source Hemin (50 μM) was added after an additional 6 h. Cells were harvested after 16 h post Hemin or DFMO addition for analysis. Polysomal enrichment of IRE-RL-3 × bulge-miR-122 was estimated by normalizing polysomal mRNA content by total mRNA level. (e) Target mRNA and mature miR-122 level were measured in cells treated with either Hemin or DFMO. Paired two-tailed Student's t-tests were used for all comparisons. *P<0.05, **P<0.01 and ***P<0.001. In ae, error bars represent s.d. (n⩾3).
Figure 4
Figure 4. Target mRNA drives increased biogenesis of mature miRNA from pre-miRNA.
(a) De novo synthesis of mature miR-122 in the presence of target mRNA is accompanied by a simultaneous drop in pre-miR-122 level. Experimental format is illustrated in the left panel. Tet-ON HEK293 cells were induced for specific time points with doxycycline to synthesize pre-miR-122 from a plasmid with Tet-response element. Cells were harvested after 14 and 24 h, and mature and pre-miR-122 levels quantified. To measure the relative changes at 24 h, values at 14 h are taken as the unit. (b) Target mRNA-induced increase of miRNA levels does not occur due to enhanced stability of a preformed miRNP in the presence of target mRNA. Cells were transfected with 1 μM synthetic pre-miR-122. After 48 h, cells were again transfected with RL-con or RL-3 × bulge-miR-122 plasmids. This was followed by RNA isolation after 24, 48 and 72 h, and mature miR-122 levels quantified to plot the decay rate of mature miR-122. Relative changes in levels of target RNAs over time have been plotted. (c) FH-AGO2 was immunoprecipitated from FH-AGO2-stable HEK293 cells transfected with pre-miR-122 plasmid and FH-AGO2 beads corresponding to ∼2 × 10⁶ cells were incubated with 500 ng in vitro-transcribed RL-con or RL-3 × bulge-miR-122 mRNA in a 20 μl reaction for increasing time. The supernatant was removed and on-bead RISC cleavage assay was subsequently performed to quantify the amount of miR-122 retained with AGO2 post interaction with target mRNA. Paired two-tailed Student's t-tests were used for all comparisons. *P<0.05, **P<0.01 and ***P<0.001. Values plotted are means from at least three biological replicates for a and two for b and c. Error bars represent s.d.
Figure 5
Figure 5. Increased activity of AGO2-associated DICER1 contributes to the target mRNA-driven miRNA production.
(ac) Increased DICER1 activity in the presence of target mRNA contributes to enhanced miRNA production from pre-miRNA in vitro. Scheme of the in vitro RISC loading assay has been depicted in the upper panel. Immunoprecipitated FH-AGO2 isolated from HEK293 cells stably expressing the protein was subjected to loading assay with 10 nM pre-miR-122 and 25 ng μl−1 of respective target mRNAs. Quantification was done either by densitometry (a) or quantitative reverse transcriptase PCR (qRT-PCR) (b). The amount of mature miR-122 formed was normalized to the amount of AGO2 immunoprecipitated for quantification. Immunoprecipitation of FH-AGO2 and associated endogenous DICER1 was confirmed by western blotting. Increased DICER1 activity in the presence of target mRNA RL-3 × bulge-let-7a contributes to enhanced miRNA production from pre-let-7a in vitro (c). (d) Removal of AGO2-associated DICER1 impairs target-driven miRNA biogenesis. Scheme of experiment has been shown. Lysate of FH-AGO2-stable HEK293 cells were treated with SLA and FH-AGO2 were immunoprecipitated for in vitro loading assay. Quantification was done by qRT-PCR. Paired two-tailed Student's t-tests were used for all comparisons. *P<0.05,**P<0.01 and ***P<0.001. For bd, values plotted are means from at least three biological replicates. Error bars represent s.d.
Figure 6
Figure 6. Increased processivity of AGO2-associated DICER1 in the presence of target mRNA.
(a) In vitro pre-miRNA processing assay with rAGO2 and rDICER1 reconfirmed target mRNA-driven increase in AGO2-associated DICER1 activity. In vitro pre-miRNA processing assay with rDICER1 and rAGO2 (native or heat-denatured) to quantify miR-122 biogenesis in the presence of target mRNA. Heat denaturation of rAGO2 was carried out at 95 °C for 5 min followed by rapid chilling. (b) In vitro pre-miRNA processing assay of pre-let-7a with rDICER1 and increasing concentrations of rAGO2 (10, 25 and 50 ng) in the presence of RL-con or RL-3 × bulge-let-7a (25 ng ml−1). Mature let-7a levels were measured and plotted. (c) Schematic representation of RL-3 × bulge-let-7a_5BoxB mRNA used in the in vitro assays. In vitro pre-miRNA processing assay of pre-let-7a with rDICER1 and 50 ng rAGO2 in the presence of RL-3 × bulge-let-7a or RL-3 × bulge-let-7a_5BoxB mRNA (both at 25 ng μl−1). Mature let-7a levels after the reaction were measured and plotted. (d) In vitro assay to measure the association of AGO2 and DICER1 along the 3′-UTR of target mRNAs. FH-AGO2 immunoprecipitated from HEK293 cells transiently expressing NHA-DICER1 was subjected to in vitro pre-miRNA processing assay with pre-miR-122 and RL-3 × bulge-miR-122 as described earlier, followed by immunoprecipitation of AGO2 and DICER1 with antibodies specific to endogenous proteins. Quantitative reverse transcriptase PCR (qRT-PCR) was done with indicated primers. (e) In vitro assay to measure processivity of DICER1. Immunopurified AGO2 (let-7a miRISC) incubated with 25 ng ml−1 RL-con or RL-3 × bulge-let-7a in the presence of pre-miR-122 (10 nM) at 37 °C for 30 min followed by RNA isolation and quantification of mature miR-122 formed by qRT-PCR. Paired two-tailed Student's t-tests were used for all comparisons. *P<0.05, **P<0.01 and ***P<0.001. In ae, values are means from at least three biological replicates. Error bars represent s.d.
Figure 7
Figure 7. A model of target-driven miRNA biogenesis.
Schematic model of target mRNA-driven miRNA biogenesis. Immediately after pre-miRNA processing and AGO2 loading, DICER1 remains associated with AGO2. Newly formed miRISC/DICER1 complex scans the 3′-UTR of a mRNA in search of cognate miRNA-binding site. On target site finding and miRNA–mRNA hybrid formation, DICER1 dissociates from AGO2 and binds free AGO2 to catalyse another round of pre-miRNA processing and miRNP formation. The presence of the target sites increases the ‘processivity' of DICER1, leading to enhanced miRNA biogenesis from precursor per unit time.

References

    1. Bartel D. P. MicroRNAs: target recognition and regulatory functions. Cell 136, 215–233 (2009). - PMC - PubMed
    1. Ameres S. L., Martinez J. & Schroeder R. Molecular basis for target RNA recognition and cleavage by human RISC. Cell 130, 101–112 (2007). - PubMed
    1. Czech B. & Hannon G. J. Small RNA sorting: matchmaking for Argonautes. Nat. Rev. Genet. 12, 19–31 (2011). - PMC - PubMed
    1. Sasaki T., Shiohama A., Minoshima S. & Shimizu N. Identification of eight members of the Argonaute family in the human genome. Genomics 82, 323–330 (2003). - PubMed
    1. Wang D. et al.. Quantitative functions of Argonaute proteins in mammalian development. Genes Dev. 26, 693–704 (2012). - PMC - PubMed

Publication types

LinkOut - more resources