. 2016 Oct;173(19):2859-79.
doi: 10.1111/bph.13562. Epub 2016 Aug 26.

Therapeutic potential of adipose stem cell-derived conditioned medium against pulmonary hypertension and lung fibrosis

Affiliations

Therapeutic potential of adipose stem cell-derived conditioned medium against pulmonary hypertension and lung fibrosis

Anandharajan Rathinasabapathy et al. Br J Pharmacol. 2016 Oct.

Abstract

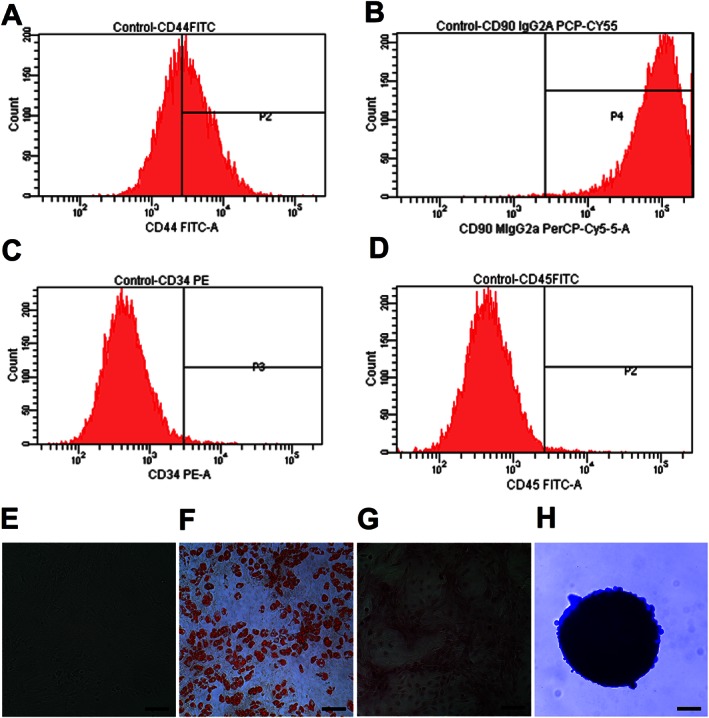
Background and purpose: Pulmonary hypertension (PH) and pulmonary fibrosis (PF) are life threatening cardiopulmonary diseases. Existing pharmacological interventions have failed to improve clinical outcomes or reduce disease-associated mortality. Emerging evidence suggests that stem cells offer an effective treatment approach against various pathological conditions. It has been proposed that their beneficial actions may be mediated via secretion of paracrine factors. Herein, we evaluated the therapeutic potential of conditioned media (CM) from adipose stem cells (ASCs) against experimental models of PH and PF.

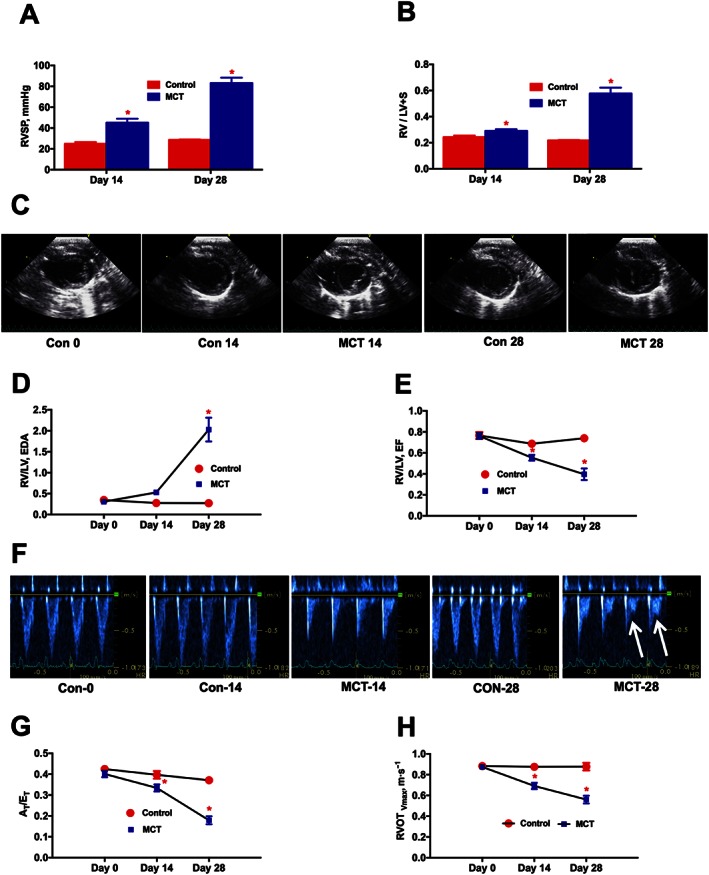
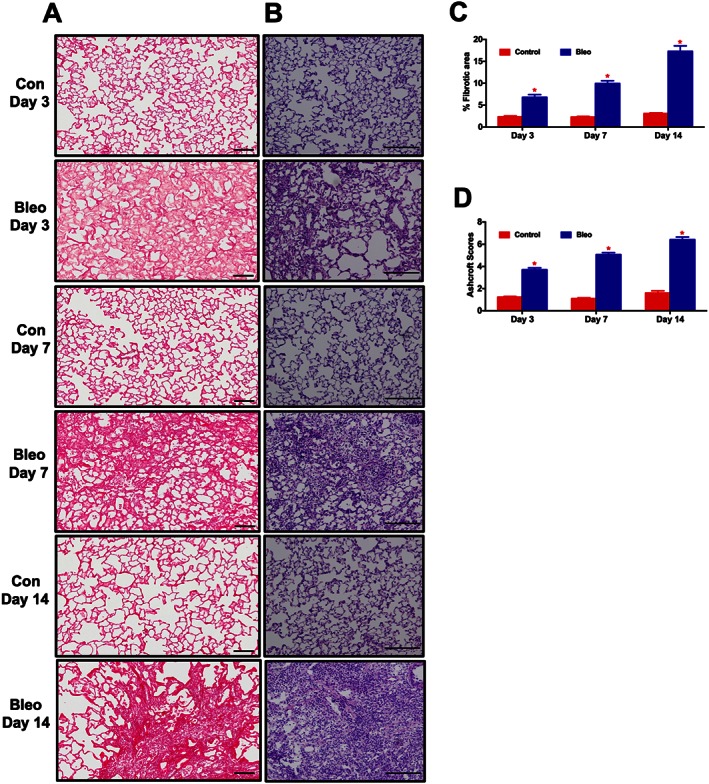
Experimental approach: Monocrotaline (MCT) or bleomycin (Bleo) was injected into male Sprague-Dawley rats to induce PH or PF respectively. A subset of MCT and Bleo animals were treated with ASCs or CM. Echocardiographic and haemodynamic measurements were performed at the end of the study. Lung and heart tissues were harvested for RNA, protein and histological measurements.

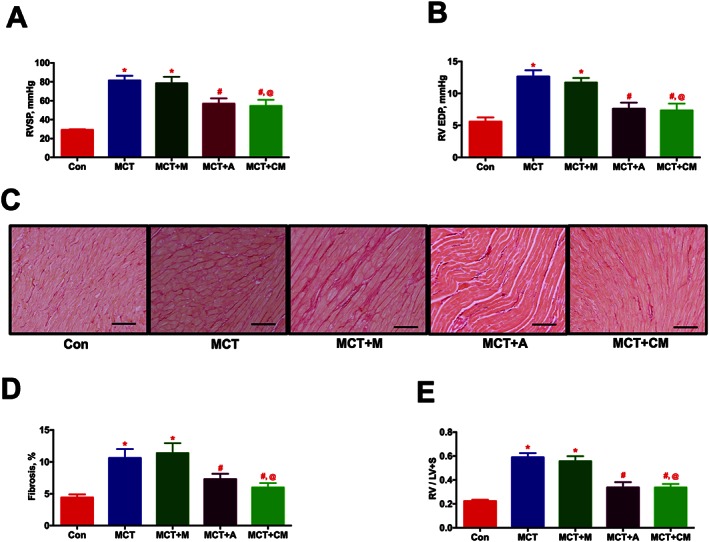
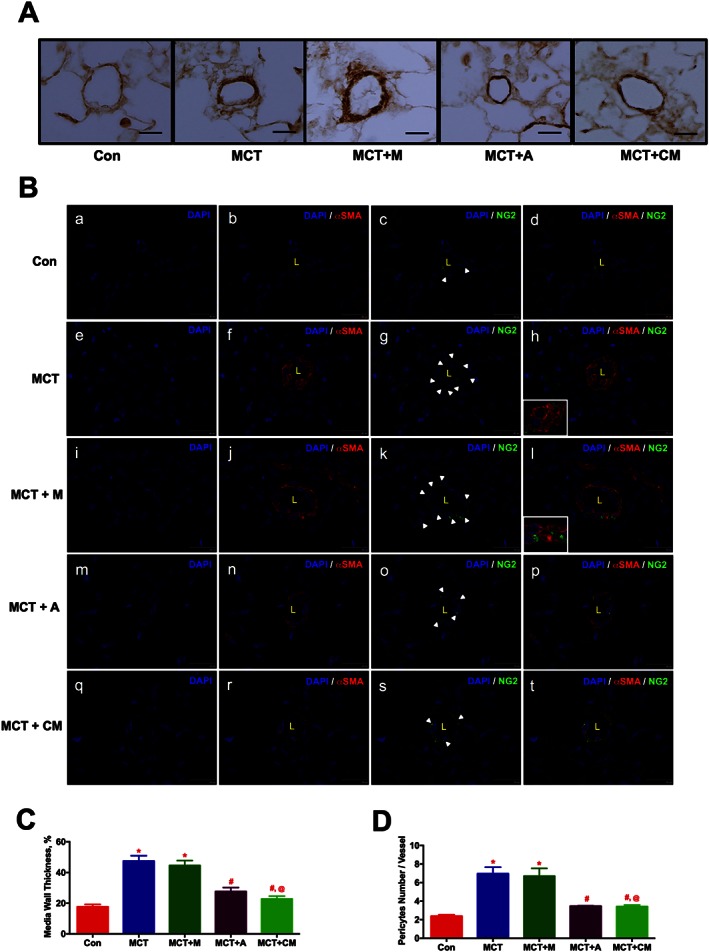
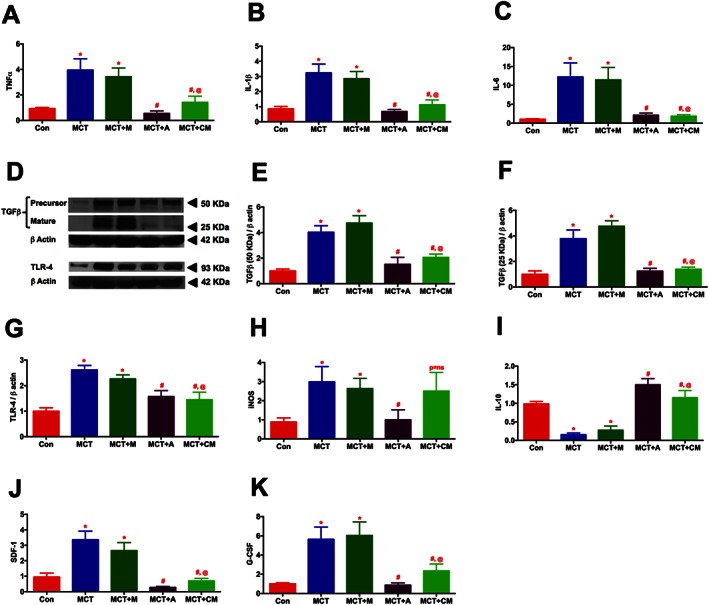
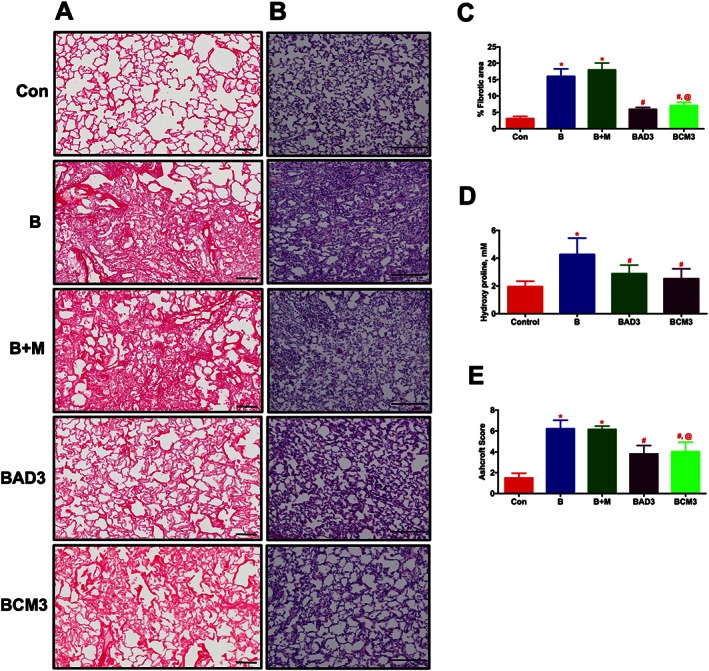
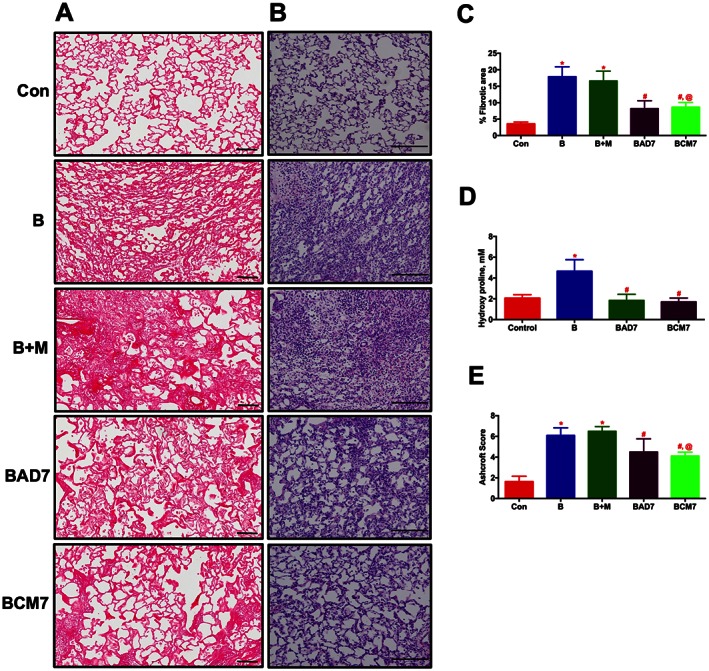
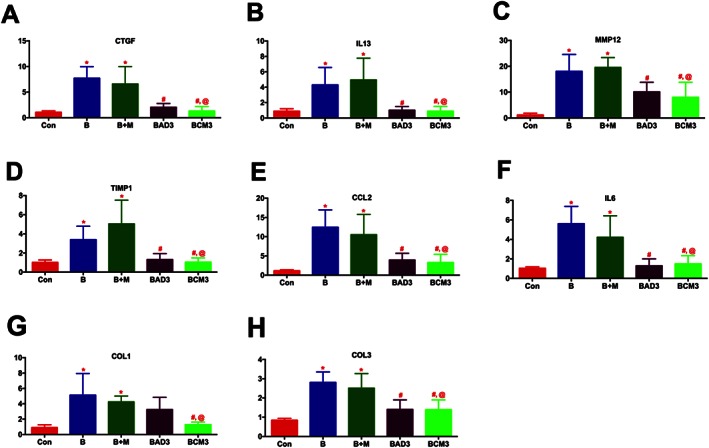
Key results: CM treatment attenuated MCT-induced PH by improving pulmonary blood flow and inhibiting cardiac remodelling. Further, histological studies revealed that right ventricular fibrosis, pulmonary vessel wall thickness and pericyte distribution were significantly decreased by CM administration. Likewise, CM therapy arrested the progression of PF in the Bleo model by reducing collagen deposition. Elevated expression of markers associated with tissue remodelling and inflammation were significantly reduced in both PF and PH lungs. Similar results were obtained with ASCs administration.

Conclusions and implications: Our study indicates that CM treatment is as effective as ASCs in treating PH and PF. These beneficial effects of CM may provide an innovative approach to treat cardiopulmonary disorders.


Figures

Figure 1
Figure 1
Characterization of ASCs; 0.5 × 106 of cultured ASCs at passage 2 were labelled with antibodies of specific cell surface phenotype markers for 30 min at 4°C and subjected immediately to flow analysis. Data represent the flow analysis of (A) CD44, (B) CD90, (C) CD34 and (D) CD45. (E) ASCs resembled fibroblast in morphology. Cells were imaged, under bright field microscopy. (F) Adipocyte staining by Oil Red ‘O′. (G) Osteocyte staining by Alizarin Red. (H) Chondrocyte staining by Alcian Blue. Scale bar = 100 μm.
Figure 2
Figure 2
Time course analysis of PH‐induced dysregulation of ventricular and pulmonary vascular remodelling. At 0, 14 and 28 days following the MCT‐insult, animals were monitored for haemodynamic and cardiac parameters. (A), and (B) represent the kinetic profile of RVSP and RVH, respectively, in controls and MCT‐challenged rats. RVH is the ratio of RV to LV + S weights, [RV/(LV + S)]. (C) Parasternal short axis view of the ventricles for control and MCT animals on Day‐0, Day‐14 and Day‐28, demonstrating a shift in the IV septum. (D) Kinetic profile of RV/LV EDA in controls and MCT‐challenged rats. RV/LV EDA is the ratio of RV versus LV EDA. (E) Kinetic profile of RV/LV EF in controls and MCT‐challenged rats. RV/LV EF is the ratio of RV EF versus LV EF and EF is the ejection fraction. (F) Image of pulsed Doppler recordings. Mid‐systolic notch is observed in the MCT animals, as indicated by the white arrows. (G) and (H) represent the kinetic profile of AT/ET and RVOTVmax in the advancement of PH. AT/ET is the ratio of acceleration time (AT) versus ejection time (ET). RVOTVmax is the velocity of pulmonary blood flow in the RVOT. Data presented in (A), (B), (D), (E), (G) and (H) are mean ± SEM (n = 6). * P value of ≤ 0.05 when comparing MCT treatment against controls.
Figure 3
Figure 3
ASCs treatment improves the ventricular dynamics and cardiac function in PH in a paracrine fashion. ASCs or CM were injected through the jugular cannula, 2 weeks following MCT‐insult. Following 4 weeks of MCT‐injection, ventricular haemodynamics, cardiac function and RV fibrosis were measured. (A) and (B) represent the improvement in haemodynamic parameters, RVSP and RV EDP, in MCT animals in the presence of ASCs or CM. (C) Representative images of RV fibrosis by PS staining. Scale bar = 200 μm. (D) Attenuation of RV fibrosis in the MCT animals by ASCs or CM treatment. (E) Reduction in MCT‐induced RVH by ASCs or CM therapy. Data presented in (A), (B), and (E) are mean ± SEM (n = 8). Data presented in (D) are mean ± SEM (n = 5). * P value of ≤ 0.05, comparing MCT and MCT + M versus control. # P value of ≤ 0.05, comparing MCT + A and MCT + CM versus MCT. @ P value of ≤ 0.05, comparing MCT + CM versus MCT + M.
Figure 4
Figure 4
ASCs treatment improves pulmonary vascular remodelling in PH in a paracrine fashion. ASCs or CM were injected via a jugular cannula, 2 weeks following the MCT insult. Following 4 weeks of MCT‐insult, pulmonary vessel wall thickness was assessed by IHC and IF staining. (A) Pulmonary vessel wall thickness. (B) Pericyte coverage; NG2 (green, pericyte marker), αSMA (red, smooth muscle marker). Immunofluorescence images were viewed under a spinning disc confocal microscope. (B.a), (B.e), (B.i), (B.m) and (B.q) represent the DAPI staining. (B.b), (B.f), (B.j), (B.n) and (B.r) represent the αSMA with DAPI staining. (B.c), (B.g), (B.k), (B.o) and (B.s) represent the NG2 with DAPI staining. (B.d), (B.h), (B.l), (B.p) and (B.t) represent the merged image of αSMA and NG2 with DAPI. Inserts in (h) and (l) represent the contact point between αSMA and NG2 stained cells. (C) and (D) represent the pulmonary vessel wall thickness and pericyte coverage in all the experimental groups. Data presented in (C) and (D) are mean ± SEM, (10 randomly chosen fields from each animal and n = 5 animals). Scale bar is 25 μm. * P value of ≤ 0.05, comparing MCT and MCT + M versus control. # P value of ≤ 0.05, comparing MCT + A, and MCT + CM versus MCT. @ P value ≤ 0.05, comparing MCT + CM versus MCT + M.
Figure 5
Figure 5
ASCs or CM modulates the expression of pulmonary cytokines in PH. Lung tissue harvested at the termination of the study was analysed for the expression of cytokines by RT‐PCR and western blot analysis: (A) TNFα, (B) IL‐1β, (C) IL‐6, (D) TGFβ and TLR‐4, (E) TGFβ (precursor, 50 KDa), (F) TGFβ (mature, 25 KDa), (G) TLR‐4, (H) iNOS, (I) IL‐10, (J) SDF‐1α, and (K) G‐CSF. Data presented in (A)–(B) and (D)–(K) are mean ± SEM, n = 5 animals per group. The number of animals included per group in (C) are control (n = 5), MCT (n = 5), MCT + M (n = 4), MCT + A (n = 5) and MCT + CM (n = 5), mean ± SEM. * P value of ≤ 0.05, comparing MCT and MCT + M versus control. # P value of ≤ 0.05, comparing MCT + A, and MCT + CM versus MCT. @ P value of ≤ 0.05, when MCT + CM is compared against MCT + M.
Figure 6
Figure 6
Time course analysis of lung fibrosis and tissue remodelling in the Bleo model. At 3, 7 and 14 days following the Bleo‐insult, animals were killed, and the harvested lungs were sectioned and stained with PS or H&E. (A), (C), and (B), (D) represent the kinetic profile of PS and H&E staining, for controls and Bleo‐challenged rats. Data presented in (C) and (D) are mean ± SEM (n = 5). *P value of ≤ 0.05 when comparing Bleo treatment against controls.
Figure 7
Figure 7
ASCs or CM treatment attenuates lung fibrosis and tissue remodelling in the Bleo animals (Early phase). ASCs or CM were injected through the jugular vein after 3 days of Bleo‐instillation. Following 2 weeks of Bleo‐instillation, animals were sacrificed, and the lungs were stained with PS and H&E staining to assess lung fibrosis and tissue remodelling. (A) and (C) represent the improvement of pulmonary fibrosis in the Bleo animals in presence of ASCs or CM. Scale bar = 100 μm. (B) and (E) represent the improvement of lung tissue remodelling in the Bleo animals in presence of ASCs or CM. Scale bar = 200 μm. (D) Demonstrates the attenuation of collagen deposition (hydroxyl proline) in the presence of ASCs or CM in the Bleo animals. Data presented in (C)‐(E) are mean ± SEM (n = 5). * P value of ≤ 0.05, comparing B and B + M animals against the controls. # P value of ≤ 0.05, comparing BAD3 and BCM3 versus B. @ P value of ≤ 0.05, comparing BCM3 versus B + M.
Figure 8
Figure 8
ASCs or CM treatment arrests the progression of established lung fibrosis and tissue remodelling in Bleo animals (Late phase). ASCs or CM were injected through the jugular vein after 7 days of Bleo‐instillation. Following 2 weeks of Bleo‐instillation, animals were killed, and the lungs were stained with PS and H&E. (A) and (C) represent the anti‐fibrotic effects of ASCs or CM. Scale bar = 100 μm. (B) and (E) improvement of lung tissue remodelling in the Bleo animals in presence of ASCs or CM. Scale bar = 200 μm. (D) Attenuation of collagen deposition as measured by lung hydroxyl proline content by ASCs or CM treatment. Data presented in (C)–(E) are mean ± SEM (n = 5). * P value of ≤ 0.05, comparing B and B + M animals against the controls. # P value of ≤ 0.05, comparing BAD7 and BCM7 versus B. @ P value of ≤ 0.05, comparing BCM7 versus B + M.
Figure 9
Figure 9
ASCs or CM attenuates the expression of markers of tissue remodelling and inflammation in PF (Early phase). Lung tissue harvested at the termination of the study was utilized for RT‐PCR analysis: (A) CTGF, (B) IL‐13, (C) MMP12, (D) TIMP1, (E) CCL2, (F) IL‐6, (G) COL1, and (H) COL3. The number of animals included per group in (A)–(H) are control (n = 5), B (n = 5), B + M (n = 4), BAD3 (n = 5) and BCM3 (n = 5), mean ± SEM. * P value of ≤ 0.05, comparing B and B + M animals against the controls. # P value of ≤ 0.05, comparing BAD3 and BCM3 versus B. @ P value of ≤ 0.05, comparing BCM3 versus B + M.
Figure 10
Figure 10
Characterization of ASCs‐CM by cytokine array. In order to profile the contents of CM, we used the cytokine array system. CM, conditioned from the serum‐starved ASCs were analysed for the protein contents. A total of 200 μg of protein in 285 μL were loaded in the cytokine array, and the instructions were followed as described in the kit. 285 μL of concentrated plain culture media (without serum) was used for the control array. (A) Presence of different cytokines and growth factors in control media and in CM. (B) Mean pixel density of the respective cytokines and growth factors present in CM as compared with the control media. Mean pixel density is the average of duplicates. (C) X and Y axis coordinates of cytokine array strip.

References

    1. Akhavein F, St‐Michel EJ, Seifert E, Rohlicek CV (2007). Decreased left ventricular function, myocarditis, and coronary arteriolar medial thickening following monocrotaline administration in adult rats. J Appl Physiol (1985) 103: 287–295. - PubMed
    1. Alexander SPH, Kelly E, Marrion N, Peters JA, Benson HE, Faccenda E et al. (2015a). The Concise Guide to PHARMACOLOGY 2015/16: Overview. Br J Pharmacol 172: 5729–5143. - PMC - PubMed
    1. Alexander SPH, Davenport AP, Kelly E, Marrion N, Peters JA, Benson HE et al. (2015b). The Concise Guide to PHARMACOLOGY 2015/16: G protein‐coupled receptors. Br J Pharmacol 172: 5744–5869. - PMC - PubMed
    1. Alexander SPH, Fabbro D, Kelly E, Marrion N, Peters JA, Benson HE et al. (2015c). The Concise Guide to PHARMACOLOGY 2015/16: Catalytic receptors. Br J Pharmacol 172: 5979–6023. - PMC - PubMed
    1. Alexander SPH, Fabbro D, Kelly E, Marrion N, Peters JA, Benson HE et al. (2015d). The Concise Guide to PHARMACOLOGY 2015/16: Enzymes. Br J Pharmacol 172: 6024–6109. - PMC - PubMed

Publication types

MeSH terms