

Results from the centers for disease control and prevention's predict the 2013-2014 Influenza Season Challenge
- PMID: 27449080
- PMCID: PMC4957319
- DOI: 10.1186/s12879-016-1669-x
Results from the centers for disease control and prevention's predict the 2013-2014 Influenza Season Challenge
Abstract
Background: Early insights into the timing of the start, peak, and intensity of the influenza season could be useful in planning influenza prevention and control activities. To encourage development and innovation in influenza forecasting, the Centers for Disease Control and Prevention (CDC) organized a challenge to predict the 2013-14 Unites States influenza season.
Methods: Challenge contestants were asked to forecast the start, peak, and intensity of the 2013-2014 influenza season at the national level and at any or all Health and Human Services (HHS) region level(s). The challenge ran from December 1, 2013-March 27, 2014; contestants were required to submit 9 biweekly forecasts at the national level to be eligible. The selection of the winner was based on expert evaluation of the methodology used to make the prediction and the accuracy of the prediction as judged against the U.S. Outpatient Influenza-like Illness Surveillance Network (ILINet).
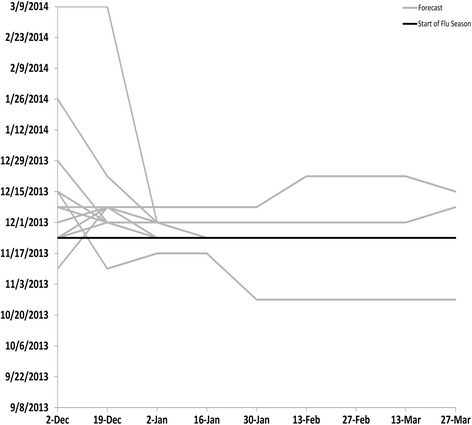
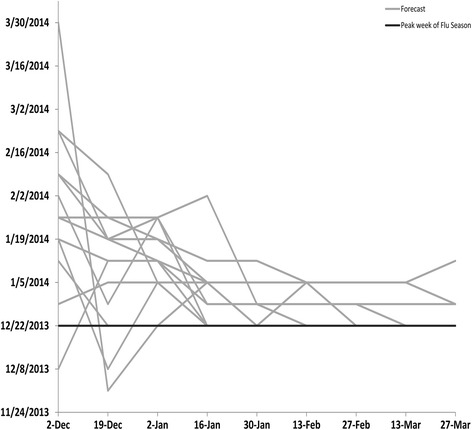
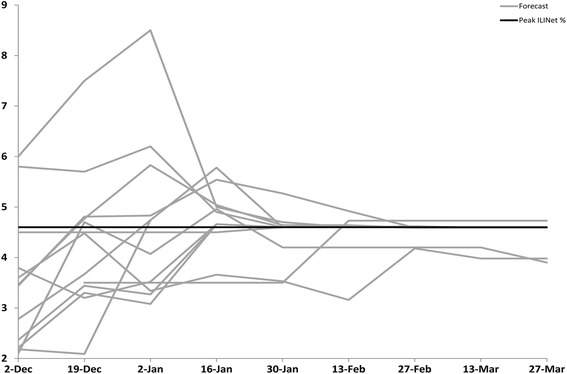
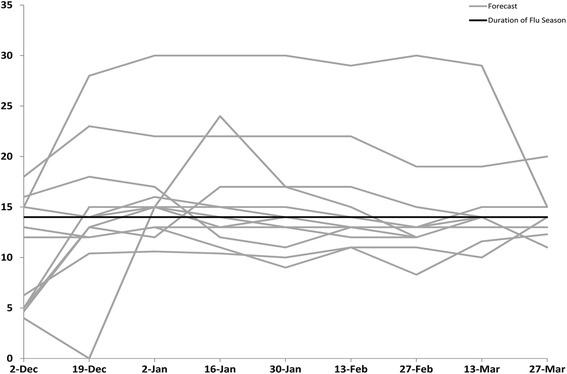
Results: Nine teams submitted 13 forecasts for all required milestones. The first forecast was due on December 2, 2013; 3/13 forecasts received correctly predicted the start of the influenza season within one week, 1/13 predicted the peak within 1 week, 3/13 predicted the peak ILINet percentage within 1 %, and 4/13 predicted the season duration within 1 week. For the prediction due on December 19, 2013, the number of forecasts that correctly forecasted the peak week increased to 2/13, the peak percentage to 6/13, and the duration of the season to 6/13. As the season progressed, the forecasts became more stable and were closer to the season milestones.
Conclusion: Forecasting has become technically feasible, but further efforts are needed to improve forecast accuracy so that policy makers can reliably use these predictions. CDC and challenge contestants plan to build upon the methods developed during this contest to improve the accuracy of influenza forecasts.
Keywords: Forecasting; Influenza; Modeling; Prediction.
Figures
References
-
- Centers for Disease Control and Prevention Update: influenza activity - United States, 2011–12 season and composition of the 2012–13 influenza vaccine. MMWR Morb Mortal Wkly Rep. 2012;61(22):414–420. - PubMed
-
- Centers for Disease Control and Prevention: FluView Interactive [http://www.cdc.gov/flu/weekly/fluviewinteractive.htm] (2014). Accessed 8/11/2014.
-
- Centers for Disease Control and Prevention: Overview of Influenza Surveillance in the United States [http://www.cdc.gov/flu/weekly/overview.htm] (2014). Accessed 9/25/2014.
MeSH terms
Grants and funding
LinkOut - more resources
Full Text Sources
Other Literature Sources
Medical
Research Materials
Miscellaneous
