. 2016 Aug 16;7(33):53611-53627.
doi: 10.18632/oncotarget.10680.

Aberrant transcriptional networks in step-wise neurogenesis of paroxysmal kinesigenic dyskinesia-induced pluripotent stem cells

Affiliations

Aberrant transcriptional networks in step-wise neurogenesis of paroxysmal kinesigenic dyskinesia-induced pluripotent stem cells

Chun Li et al. Oncotarget. .

Abstract

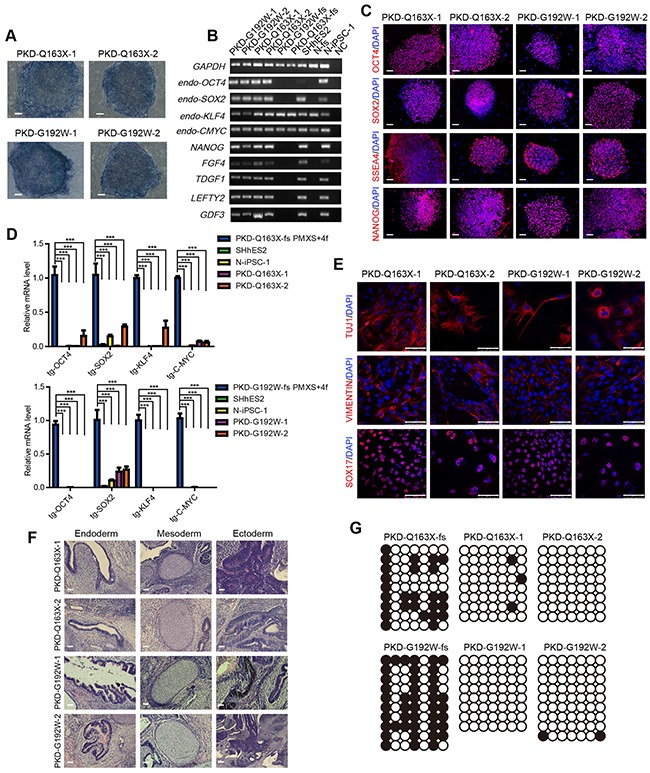
Paroxysmal kinesigenic dyskinesia (PKD) is an episodic movement disorder with autosomal-dominant inheritance and marked variability in clinical manifestations.Proline-rich transmembrane protein 2 (PRRT2) has been identified as a causative gene of PKD, but the molecular mechanism underlying the pathogenesis of PKD still remains a mystery. The phenotypes and transcriptional patterns of the PKD disease need further clarification. Here, we report the generation and neural differentiation of iPSC lines from two familial PKD patients with c.487C>T (p. Gln163X) and c.573dupT (p. Gly192Trpfs*8) PRRT2 mutations, respectively. Notably, an extremely lower efficiency in neural conversion from PKD-iPSCs than control-iPSCs is observed by a step-wise neural differentiation method of dual inhibition of SMAD signaling. Moreover, we show the high expression level of PRRT2 throughout the human brain and the expression pattern of PRRT2 in other human tissues for the first time. To gain molecular insight into the development of the disease, we conduct global gene expression profiling of PKD cells at four different stages of neural induction and identify altered gene expression patterns, which peculiarly reflect dysregulated neural transcriptome signatures and a differentiation tendency to mesodermal development, in comparison to control-iPSCs. Additionally, functional and signaling pathway analyses indicate significantly different cell fate determination between PKD-iPSCs and control-iPSCs. Together, the establishment of PKD-specific in vitro models and the illustration of transcriptome features in PKD cells would certainly help us with better understanding of the defects in neural conversion as well as further investigations in the pathogenesis of the PKD disease.

Keywords: induced pluripotent stem cells (iPSCs); neural differentiation; paroxysmal kinesigenic dyskinesia (PKD); proline-rich transmembrane protein 2 (PRRT2); transcriptome analysis.


Conflict of interest statement

The authors declare no potential conflict of interest.

Figures

Figure 1
Figure 1. The expression pattern of PRRT2 in the human tissues
Tissue microarray analysis was performed to measure the expression pattern of PRRT2 in various adult human tissues. IHC immune-stained sections were scanned using Scanscope XT System (Aperio, Leica). A. Immunohistochemistry analysis revealed that PRRT2 was highly expressed throughout the human brain, especially with high levels in the cerebral cortex, hippocampus and cerebellum. B. PRRT2 expression patterns in other tissues such as the large intestine, lung, liver, skeletal muscle, testes, ovary, thyroid gland, prostate gland, renal, stomach, small intestine, heart, pancreas, uterus, skin and spleen are shown. Scale bars, 200 μm.
Figure 2
Figure 2. Generation of iPSC lines from fibroblasts (fs) of PKD patients with PRRT2 mutations
A. Primary culture of PKD-Q163X-fs and PKD-G192W-fs. Scale bars, 100 μm. B. Established iPSC lines (PKD-Q163X-1, 2 and PKD-G192W-1, 2) from PKD patients showed embryonic stem cell-like morphology. Scale bars, 100 μm. C. The iPSC colonies derived from PKD-Q163X-fs were verified to carry the heterozygous c.487C>T (p. Gln163X) mutation and iPSC colonies derived from PKD-G192W-fs were verified to carry an inDel c.573dupT (p. Gly192Trpfs*8) via Sanger sequencing. D. All iPSC lines derived from the two PKD patients have normal karyotypes.
Figure 3
Figure 3. Characterization of iPSCs from PKD patients
A. Alkaline phosphatase staining of all established iPSC lines. Scale bars, 100 μm. B. RT-PCR assays for detecting the expression of pluripotency-associated markers in PKD-Q163X-1, 2 and PKD-G192W-1, 2. C. Immunofluorescence staining against pluripotency markers OCT4, SOX2, NANOG and SSEA4 in PKD-Q163X-1, 2 and PKD-G192W-1, 2. Scale bars, 100 μm. D. Quantitative RT-PCR analysis of expression levels of 4 transgenic genes OCT4, SOX2, KLF4 and C-MYC in PKD-Q163X-1, 2 and PKD-G192W-1, 2. The expression level of each transgenic gene in PKD-fs infected with retroviruses for 5 days was set as positive control. N-iPSC-1 and SHhES2 served as negative controls. The expression level of transgenes in all PKD-iPSC lines are calculated and shown as mean ± SD. ***p < 0.001. E. Immunofluorescence staining of differentiated cells from EBs formed by PKD-Q163X-1, 2 and PKD-G192W-1, 2 using antibodies against SOX17 (endoderm), VIMENTIN (mesoderm) and TUJ1 (ectoderm). Scale bars, 75 μm. F. H & E staining images of teratomas formed by PKD-Q163X-1, 2 and PKD-G192W-1, 2. Goblet cells representing the endoderm, the cartilage representing the mesoderm, the neural epithelium and pigment cells representing the ectoderm are shown. Scale bars, 50 μm. G. Bisulfite sequencing analysis of endogenous OCT4 promoter methylation in PKD-Q163X-fs, PKD-G192W-fs, PKD-Q163X-1, 2 and PKD-G192W-1, 2. Hollow circles denote unmethylated CpG sites and the black circles denote methylated CpG sites.
Figure 4
Figure 4. A step-wise neural induction of iPSC lines from PKD patients and a control individual
A. Flow diagram of the neural induction process. B. Normal iPSC lines (N-iPSC-1, 2) showed neural rosette-like morphology. PKD-iPSC lines (PKD-Q163X-1, 2 and PKD-G192W-1, 2) showed severe defects in forming neural rosettes. Scale bars, 100 μm. C. Quantitative RT-PCR analysis revealed similar expression levels of pluripotency markers (OCT4 and NANOG), but obviously different expression patterns of NPC markers (SOX1 and NESTIN) and neuron markers (TUJ1 and MAP2) between PKD and normal groups. The expression level of marker genes in all PKD-iPSC lines are calculated and shown as mean ± SD. *p < 0.05; **p < 0.01; ***p < 0.001. D. Immunofluorescence staining against NPC marker (NESTIN) in N-iPSC-1, 2 on day 30. Scale bars, 100 μm. E. Immunofluorescence staining against neuron marker (TUJ1) in N-i-1, 2 on day 40. Scale bars, 25 μm. F. The cell growth curve detected in all iPSC lines from day 0-10 of neural induction displayed similar cell growth levels. The absorbance was measured at 450 nm and 600nm. The optical density (OD) were calculated and shown as mean ± SD. G. Comparable levels of cell apoptosis were detected in normal iPSCs and PKD-iPSCs on days 0, 5 and 10, respectively. Levels of cell apoptosis were analyzed by Annexin V-PE/7-AAD staining, followed by flow cytometry analysis. Quantification of apoptosis parameters is shown. Student's t-test was used to test whether there is significant difference between normal and PKD groups. Error bars represent standard errors.
Figure 5
Figure 5. Gene expression profile analysis of DEGs between PKD-iPSCs and normal controls during a step-wise neural differentiation
A. Pie chart shows the number of differentially expressed genes (DEGs, FC ≥ 2 or FC ≤ 0.5, P value < 0.05, FC=Fold Change.) at different time points of neural differentiation. B. Distribution of the DEGs exhibits in PKD cells and normal cells on days 0, 5, 10 and day 30. C-E. The Gene Ontology (GO) analysis of highly expressed DEGs in PKD cells and normal cells on day 5 (C), day 10 (D) and day 30 (E) of neural induction. The top significant GO categories identified in each of the two groups are shown. Pink-colored GO terms are associated with neurogenesis; blue-colored GO terms are associated with other biological processes exclusive of neural development. The length of bars indicates –log10 P value of the Fisher's exact test.
Figure 6
Figure 6. Altered global transcriptomes and dysregulated neural transcriptomes in PKD cells during a step-wise neural induction
A. Unsupervised hierarchical clustering of the transcriptomes of all samples. B. Principal component analysis (PCA) of PKD and normal samples from four stages of neural differentiation. Cells with same sample types are shown in the same shape. Cells in same time point are shown in the same color. Dash lines with an arrow indicate the developmental direction of each cell line. C-D. Stage-specific co-expression gene modules identified by WGCNA and their correlation to the development stage are shown in (C). The number of each square represents a correlation of modules and sample types, and p-value of each correlation represents a correlation value. The color of each square is corresponding to the correlation: Positive correlation (Red); Negative correlation (Green); No correlation (White). Modules with highest correlation to each sample type are shown in (D). E-F. The top seven significant GO categories identified in modules with highest correlation are shown. Darkgrey module E-a. brown4 module E-b. and darkslateblue module E-c. are related with normal samples N-d5, N-d10 and N-d30, respectively. Skyblue module F-a. darkmagenta module F-b. and lightcyan module F-c. are related with PKD samples PKD-d5, PKD-d10 and PKD-d30, respectively. The length of bars indicates –log10 P value of the Fisher's exact test. G. Expression patterns of neural lineage markers for samples collected on day 30. Colors represent gene expression levels: High expression (Red); Moderate expression (White); Low expression (Blue). H. Heatmaps illustrate expression values of SMAD1/5 and SMAD4 target genes in all samples. I. Boxplots indicate the distribution of IRX3 and HAS2 expression in different samples. The black line in boxplots refers to the median. The red line represents the control group; the green line represents the PKD group.

Similar articles

Cited by

References

    1. Kertesz A. Paroxysmal kinesigenic choreoathetosis. An entity within the paroxysmal choreoathetosis syndrome. Description of 10 cases, including 1 autopsied. Neurology. 1967;17:680–690. - PubMed
    1. Goodenough DJ, Fariello RG, Annis BL, Chun RW. Familial and acquired paroxysmal dyskinesias. A proposed classification with delineation of clinical features. Arch Neurol. 1978;35:827–831. - PubMed
    1. Demirkiran M, Jankovic J. Paroxysmal dyskinesias: clinical features and classification. Ann Neurol. 1995;38:571–579. - PubMed
    1. Blakeley J, Jankovic J. Secondary paroxysmal dyskinesias. Mov Disord. 2002;17:726–734. - PubMed
    1. Lotze T, Jankovic J. Paroxysmal kinesigenic dyskinesias. Semin Pediatr Neurol. 2003;10:68–79. - PubMed

MeSH terms

Supplementary concepts