. 2016 Sep 13;7(37):59458-59470.
doi: 10.18632/oncotarget.10694.

Dichloroacetate and metformin synergistically suppress the growth of ovarian cancer cells

Affiliations

Dichloroacetate and metformin synergistically suppress the growth of ovarian cancer cells

Bo Li et al. Oncotarget. .

Abstract

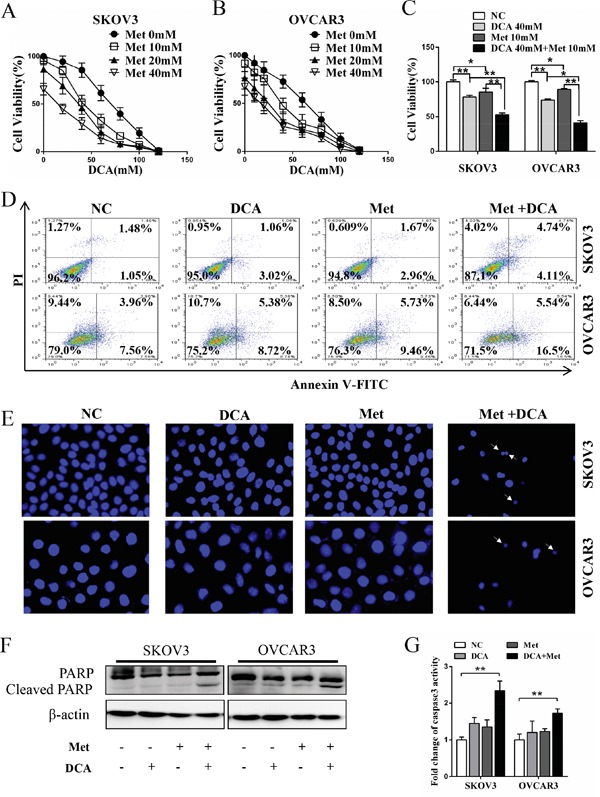
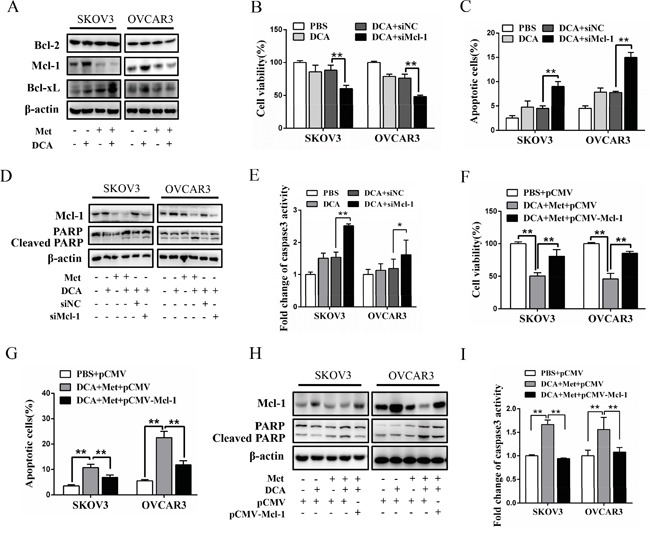
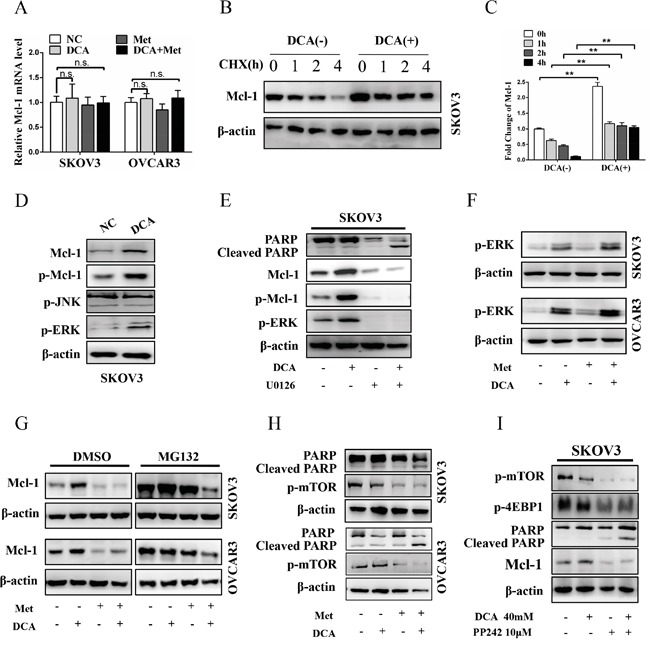
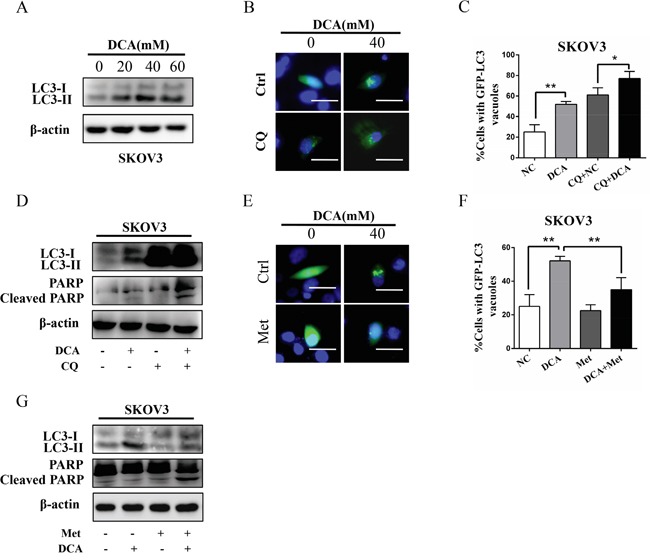
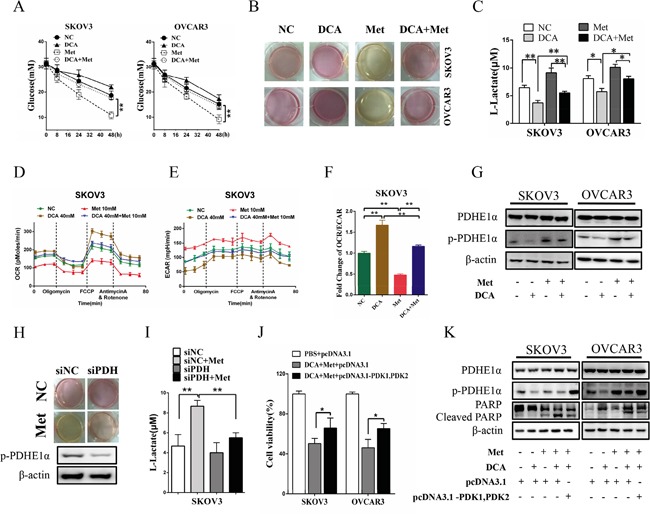
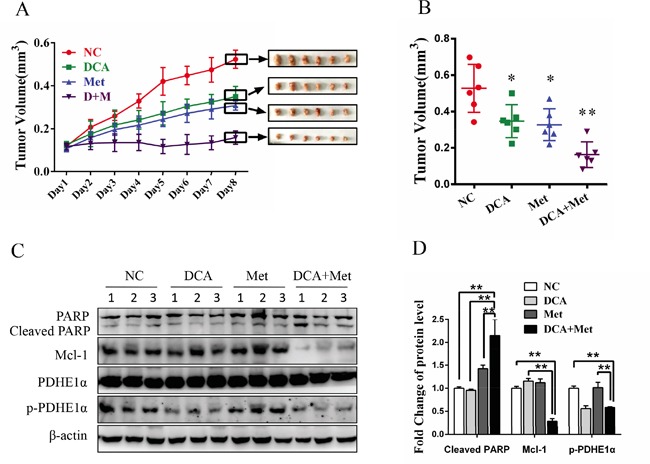
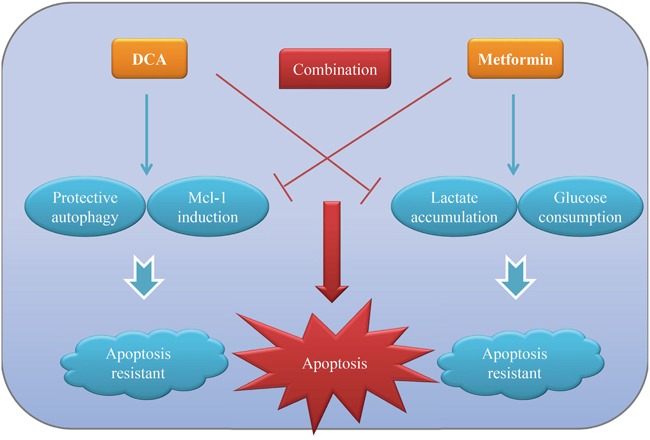
Both dichloroacetate (DCA) and metformin (Met) have shown promising antitumor efficacy by regulating cancer cell metabolism. However, the DCA-mediated protective autophagy and Met-induced lactate accumulation limit their tumor-killing potential respectively. So overcoming the corresponding shortages will improve their therapeutic effects. In the present study, we found that DCA and Met synergistically inhibited the growth and enhanced the apoptosis of ovarian cancer cells. Interestingly, we for the first time revealed that Met sensitized DCA via dramatically attenuating DCA-induced Mcl-1 protein and protective autophagy, while DCA sensitized Met through markedly alleviating Met-induced excessive lactate accumulation and glucose consumption. The in vivo experiments in nude mice also showed that DCA and Met synergistically suppressed the growth of xenograft ovarian tumors. These results may pave a way for developing novel strategies for the treatment of ovarian cancer based on the combined use of DCA and Met.

Keywords: Mcl-1; cancer metabolism; dichloroacetate; metformin; ovarian cancer.


Conflict of interest statement

CONFLICTS OF INTEREST

No potential conflicts of interest were disclosed.

Figures

Figure 1
Figure 1. Dichloroacetate (DCA) and metformin (Met) synergistically induce apoptosis in ovarian cancer cells
A, B. SKOV3 and OVCAR3 cells were treated with DCA and Met at indicated doses for 48 h, and then the cell viability was measured by CCK8 assay. C. SKOV3 and OVCAR3 cells were cotreated with 40 mM DCA and 10 mM Met or each alone for 48 h, and then the cell viability was measured by CCK8 assay. D. After treatment as in (C) for 24 h, the cells were stained with annexin V-FITC/PI. Then the percentage of apoptotic cells was calculated using flow cytometry. E. After treatment as in (D), the cell nucleus were stained with Hoechst 33258 and then observed under fluorescence microscope. The representative images were shown and the typical apoptotic bodies were marked with white arrows. F, G. After treatment as in (D), the cleavage of PARP was evaluated by Western blot (F), and the activation of caspase3 was measured by caspase3 activity assay (G). NC, negative control; *,P<0.05; **,P<0.01.
Figure 2
Figure 2. Met sensitizes DCA through decreasing DCA-induced Mcl-1
A. SKOV3 and OVCAR3 cells were cotreated with 40 mM DCA and 10 mM Met or each alone for 24 h, then Bcl-2, Bcl-xL and Mcl-1 were detected by Western blot. B-E. After transfection with Mcl-1 siRNA or control siRNA for 12 h, the cells were treated with 40 mM DCA or PBS control for another 24 h. Then the cell viability was detected using CCK8 assay (B), the percentage of apoptotic cells was calculated using flow cytometry (annexin V-FITC/PI) (C), the levels of Mcl-1 and cleaved PARP were examined with Western blot (D) and caspase3 activity was measured by caspase3 activity assay (E). F-I. After transfection with Mcl-1 expressing plasmid or control plasmid for 12 h, the cells were cotreated with 40 mM DCA and 10mM Met for another 24 h. Then cell viability (F), the percentage of apoptotic cells (G), the levels of Mcl-1 and cleaved PARP (H) and caspase3 activity (I) were assayed as in (B-E). siNC, siRNA for negative control; siMcl-1: siRNA for Mcl-1; *,P<0.05; **,P<0.01.
Figure 3
Figure 3. Met attenuates DCA-induced Mcl-1 through inhibiting Mcl-1 translation
A. After cotreatment with 40 mM DCA and 10 mM Met or each alone for 24 h, the mRNA level of Mcl-1 was examined by qPCR, and the data was expressed as the fold change over the control. B, C. After treatment with 40 mM DCA or PBS control for 24 h, 100μM CHX (translational inhibitor) was added at indicated times before the cells were harvested. Then the expression of Mcl-1 was detected by Western blot (B). The intensity of the protein bands were quantified by Quantity One software from Bio-Rad Company, and the ratios of Mcl-1/β-actin were shown in (C). D. The cells were treated with 40 mM DCA or PBS for 24 h, and then the levels of p-ERK, p-JNK, p-Mcl-1 and total Mcl-1 were determined by Western Blot. E. After pretreated with 10μM U0126 (MEK1/2 inhibitor) or vehicle control DMSO for 2 h, the cells were treated with 40 mM DCA or PBS for another 24 h. Then the level of p-Mcl-1, p-ERK, total Mcl-1 and cleaved PARP were analyzed by Western blot. F. The cells were treated as in (A), and then the level of p-ERK was measured by Western blot. G. After treated as in (A) for 22 h, the cells were incubated with 10μM MG132 (proteasome inhibitor) or DMSO for another 2 h. Then the level of Mcl-1 protein was tested by Western blot. H. The cells were treated as in (A), and then the level of cleaved PAPR and p-mTOR were assessed by Western blot. I. After pretreated with DMSO or 2μM PP242 (mTOR inhibitor) for 2 h, the cells were treated with 40 mM DCA or PBS for another 24 h. Then the level of p-mTOR, p-4EBP1, Mcl-1 and cleaved PARP were analyzed by Western blot. n.s., no significance; **,P<0.01.
Figure 4
Figure 4. Met diminishes DCA-induced protective autophagy
A. SKOV3 cells were treated with the indicated concentrations of DCA, and then the levels of LC3B-I/II were detected by Western blot. B, C. After transfected with GFP-LC3 expressing plasmid for 12 h, SKOV3 cells were treated with 40 mM DCA for another 24 h in the presence or absence of the autophagy inhibitor CQ (20 mM). Then the green fluorescent GFP-LC3 punctas (which occurred upon autophagy induction) were observed under fluorescent microscope (B). Subsequently, the data from (B) was quantified and expressed as the percentage of the cells containing 5 or more GFP-LC3 punctas (C). D. SKOV3 cells were treated with 40 mM DCA for 24 h in the presence or absence of the CQ (20 mM), and then the levels of LC3-I/II and cleaved PARP were examined by Western blot. E, F. After transfected with GFP-LC3 expressing plasmid for 12 h, SKOV3 cells were cotreated with 40 mM DCA and 10 mM Met or each alone for 24 h. Then the green fluorescent GFP-LC3 punctas were photographed (E) and quantified (F) as in (B and C). G. SKOV3 cells were cotreated with 40 mM DCA and 10 mM Met or each alone for 24 h, and then the levels of LC3-I/II and cleaved PARP were detected by Western blot. *,P<0.05; **,P<0.01.
Figure 5
Figure 5. DCA alleviates Met-induced glucose consumption and lactate production
A. SKOV3 and OVCAR3 cells were cotreated with 40 mM DCA and 10 mM Met or each alone for the indicated times, and then the concentrations of glucose in the culture media were measured separately. B, C. After cotreatment with 40 mM DCA and 10 mM Met or each alone for 24h, the color of the culture media were photographed (B), and the concentrations of L-lactate in the media were assayed (C). D-F. After treated as in (B), the OCR (D) and ECAR (E) of the cells were measured by XF Cell Mito Stress Test Kit, and the mitochondrial respiration rate (OCR/ECAR) was calculated (F). G. The cells were treated as in (B), and then the levels of total PDHE1α and p-PDHE1α on Ser293 were detected by Western blot. H, I. After transfected with the siRNA for PDH or control siRNA for 12h, SKOV3 cells were treated with 10mM Met or PBS. Then the color of the culture media were photographed (H), and the concentrations of L-lactate in the media were assayed (I). J, K. After cotransfected with PDK1 and PDK2 expression vectors (pcDNA3.1- PDK1, PDK2) or control vector pcDNA3.1 for 12 h, the cells were cotreated with 40 mM DCA and 10 mM Met for another 24 h. Then the cell viability was determined by CCK8 assay (J), and the levels of total PDHE1α, p-PDHE1α on Ser293 and cleaved PARP were analyzed by Western blot. siNC, siRNA for negative control; siPDH: siRNA for PDH; *,P<0.05; **,P<0.01.
Figure 6
Figure 6. DCA and Met collaboratively repress the growth of ovarian cancer cells in vivo
A-D. 5×10⁶ SKOV3 cells in 150 μL PBS were implanted into the right axillae of each nude mouse. When palpable tumors were formed, the mice were randomized into 4 groups (n = 6 per group). Then the mice were intraperitoneally injected everyday with DCA (50 mg/kg/d) plus Met (100 mg/kg/d) or each alone for 8 days, taking PBS as control. The xenograft tumor size was monitored every day (volume = width2×length×1/2) (A). After excised from the mice, the xenograft tumors were photographed (A) and their volumes were showed in (B). The levels of cleaved PARP, Mcl-1, total PDHE1α and p-PDHE1α were measured by Western blot (C), and the ratios of the corresponding proteins to β-actin were calculated (D). *,P<0.05; **,P<0.01.
Figure 7
Figure 7. The working model for the synergistic sensitization of DCA and Met to each other in ovarian cancer cells
DCA can induce anti-apoptotic protein Mcl-1 and protective autophagy, which in turn inhibits DCA-induced apoptosis in ovarian cancer cells. Met can result in lactate accumulation and high glucose consumption, which hampers it to kill ovarian cancer cells. DCA and Met can synergistically induce apoptosis of ovarian cancer cells via overcoming the reciprocal shortages.

Similar articles

Cited by

References

    1. Jayson GC, Kohn EC, Kitchener HC, Ledermann JA. Ovarian cancer. Lancet. 2014;384:1376–1388. - PubMed
    1. Patch AM, Christie EL, Etemadmoghadam D, Garsed DW, George J, Fereday S, Nones K, Cowin P, Alsop K, Bailey PJ, Kassahn KS, Newell F, Quinn MC, et al. Whole-genome characterization of chemoresistant ovarian cancer. Nature. 2015;521:489–494. - PubMed
    1. Ward PS, Thompson CB. Metabolic reprogramming: a cancer hallmark even warburg did not anticipate. Cancer Cell. 2012;21:297–308. - PMC - PubMed
    1. Mandai M, Amano Y, Yamaguchi K, Matsumura N, Baba T, Konishi I. Ovarian clear cell carcinoma meets metabolism; HNF-1beta confers survival benefits through the Warburg effect and ROS reduction. Oncotarget. 2015;6:30704–30714. doi: 10.18632/oncotarget.5228. - DOI - PMC - PubMed
    1. Fan JY, Yang Y, Xie JY, Lu YL, Shi K, Huang YQ. MicroRNA-144 mediates metabolic shift in ovarian cancer cells by directly targeting Glut1. Tumour Biol. 2015 - PubMed