. 2016 Sep 13;7(37):59482-59502.
doi: 10.18632/oncotarget.10699.

Short-term pyrrolidine dithiocarbamate administration attenuates cachexia-induced alterations to muscle and liver in ApcMin/+ mice

Affiliations

Short-term pyrrolidine dithiocarbamate administration attenuates cachexia-induced alterations to muscle and liver in ApcMin/+ mice

Aditi A Narsale et al. Oncotarget. .

Abstract

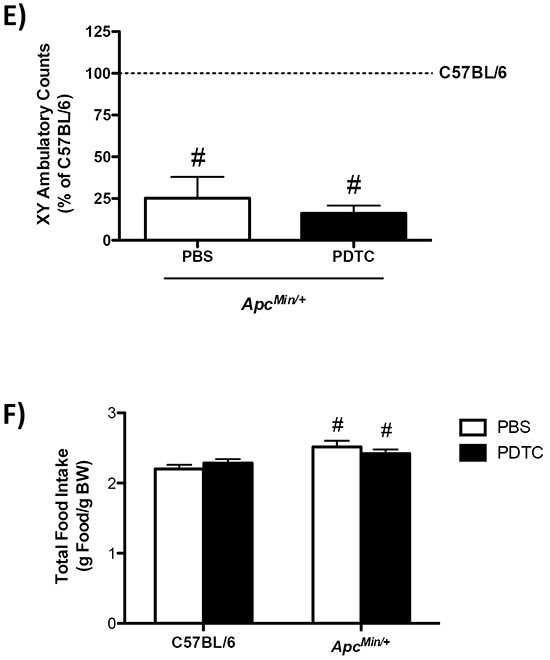
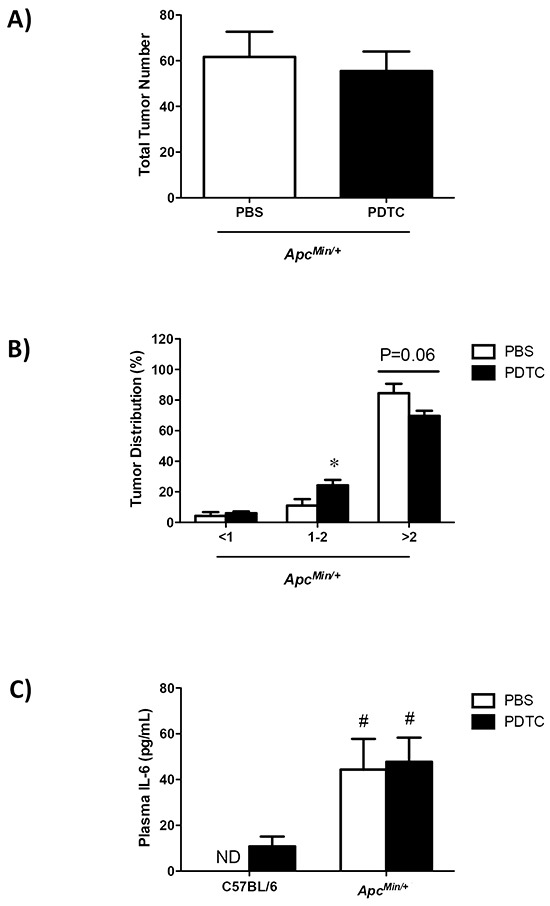
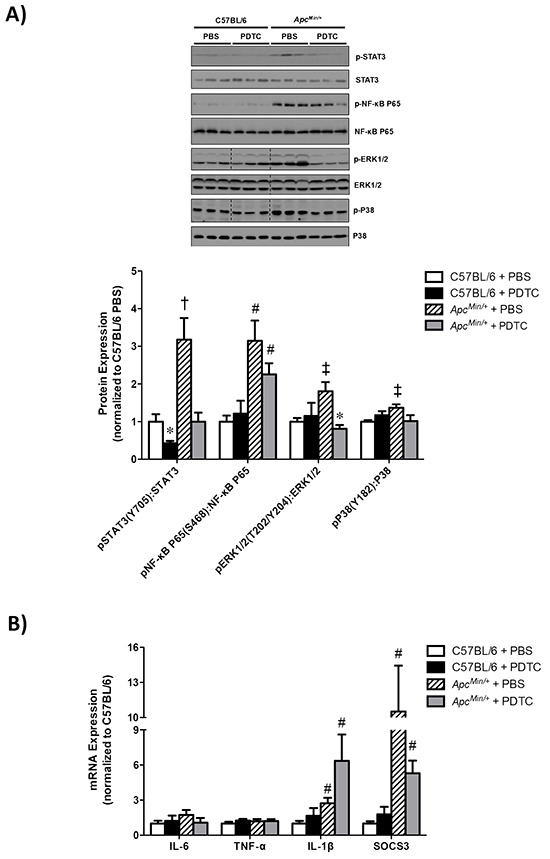
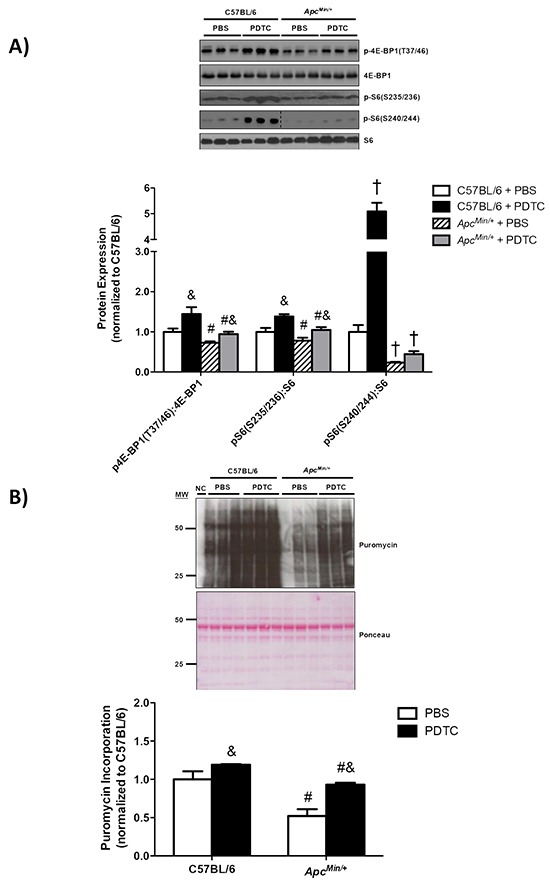
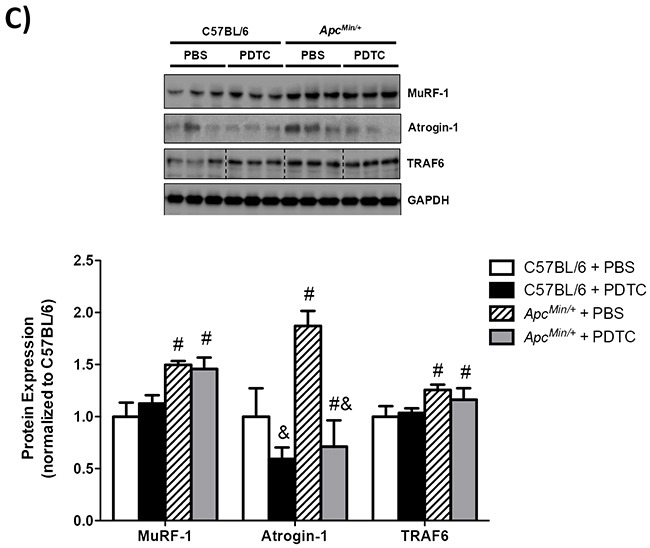
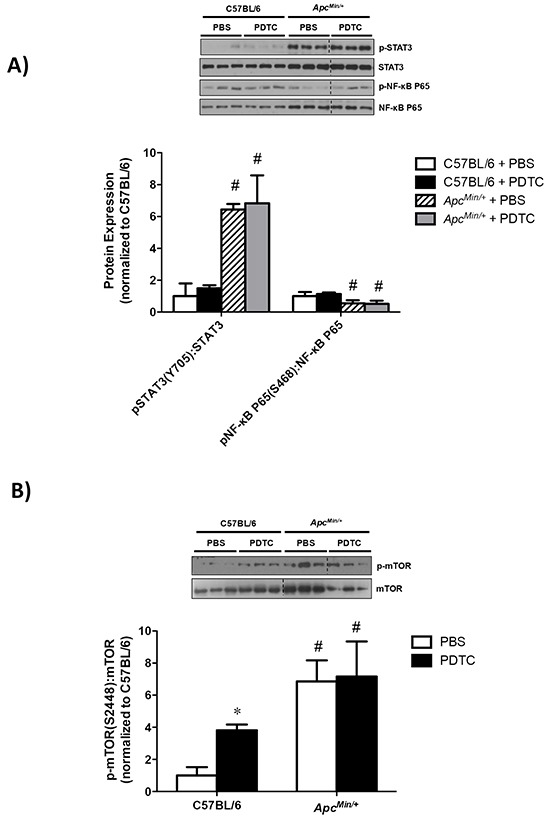
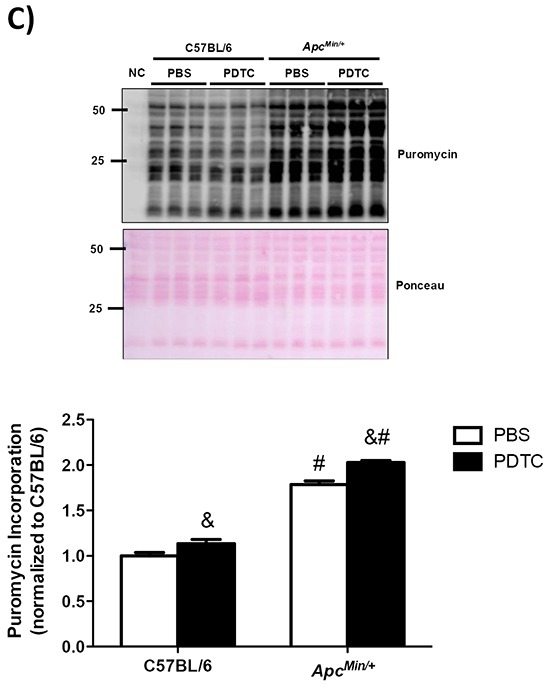
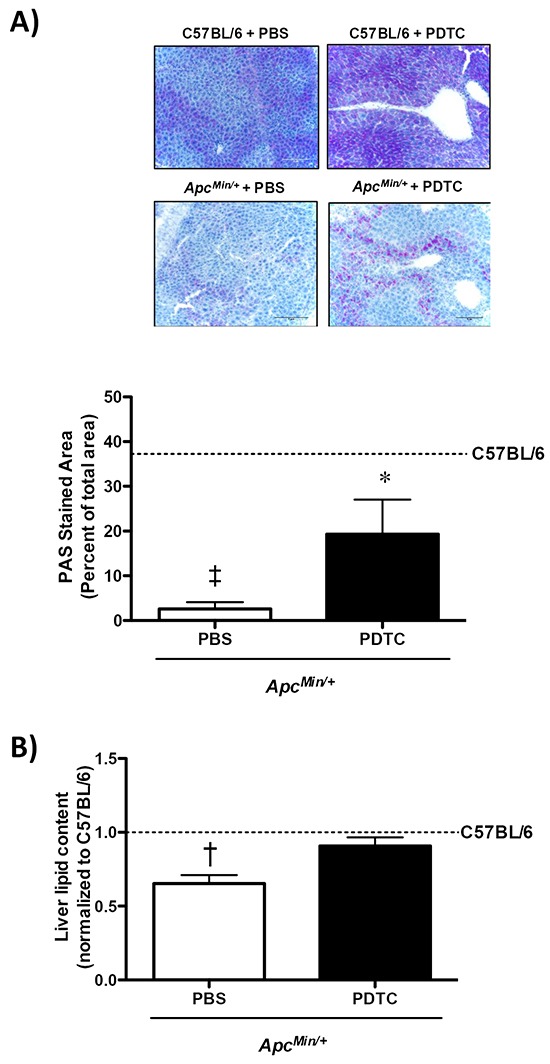
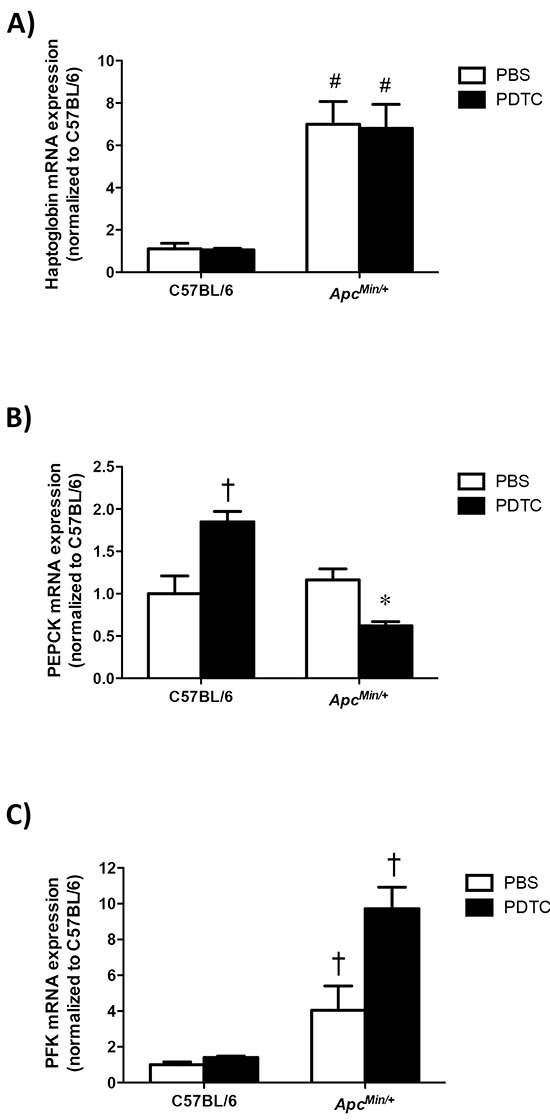
Cancer cachexia is a complex wasting condition characterized by chronic inflammation, disrupted energy metabolism, and severe muscle wasting. While evidence in pre-clinical cancer cachexia models have determined that different systemic inflammatory inhibitors can attenuate several characteristics of cachexia, there is a limited understanding of their effects after cachexia has developed, and whether short-term administration is sufficient to reverse cachexia-induced signaling in distinctive target tissues. Pyrrolidine dithiocarbamate (PDTC) is a thiol compound having anti-inflammatory and antioxidant properties which can inhibit STAT3 and nuclear factor κB (NF-κB) signaling in mice. This study examined the effect of short-term PDTC administration to ApcMin/+ mice on cachexia-induced disruption of skeletal muscle protein turnover and liver metabolic function. At 16 weeks of age ApcMin/+ mice initiating cachexia (7% BW loss) were administered PDTC (10mg/kg bw/d) for 2 weeks. Control ApcMin/+ mice continued to lose body weight during the treatment period, while mice receiving PDTC had no further body weight decrease. PDTC had no effect on either intestinal tumor burden or circulating IL-6. In muscle, PDTC rescued signaling disrupting protein turnover regulation. PDTC suppressed the cachexia induction of STAT3, increased mTORC1 signaling and protein synthesis, and suppressed the induction of Atrogin-1 protein expression. Related to cachectic liver metabolic function, PDTC treatment attenuated glycogen and lipid content depletion independent to the activation of STAT3 and mTORC1 signaling. Overall, these results demonstrate short-term PDTC treatment to cachectic mice attenuated cancer-induced disruptions to muscle and liver signaling, and these changes were independent to altered tumor burden and circulating IL-6.

Keywords: hepatomegaly; inflammation; metabolism; muscle atrophy; protein turnover.


Conflict of interest statement

CONFLICTS OF INTEREST

The authors declare no conflicts of interest.

Figures

Figure 1
Figure 1. The effect of PDTC treatment on cachexia progression in ApcMin/+ mice
A. Experimental Design. At 16 weeks of age C57BL/6 and ApcMin/+ mice were randomized to receive PBS or PDTC (10 mg/kg body weight/day) via intraperitoneal injection for 2 weeks. Mice were sacrificed at 18 weeks of age following a 5 hr fast. B. The percentage body weight loss pre- and post-treatment in ApcMin/+ mice. C. Total fat mass measured by DEXA in C57BL/6 and ApcMin/+ mice. D. Total lean body mass measured by DEXA in C57BL/6 and ApcMin/+ mice. E. XY ambulatory counts in C57BL/6 and ApcMin/+ mice. Data are expressed as the percentage of C57BL/6 + PBS. F. Total food intake during the 2-wk treatment period in a second cohort of ApcMin/+ mice that had initiated body weight loss (C57BL/6 + PBS: N=5, C57BL/6 + PDTC: N=6, ApcMin/+ + PBS: N=5, ApcMin/+ + PDTC: N=7). Values are means ± standard error. Significance was set at P<0.05. † = signifies difference to all groups. & = signifies main effect of PDTC treatment. # = signifies main effect of ApcMin/+ genotype. * = signifies difference from PBS treatment within genotype. Abbreviations: wks, weeks. mg, milligram. PBS, phosphate buffered saline. PDTC, pyrrolidine dithiocarbamate.DEXA, Dual-energy X-ray absorptiometry.
Figure 2
Figure 2. The effect of PDTC treatment on systemic inflammation in ApcMin/+ mice
A. Total tumor number in ApcMin/+ mice. B. Tumor size distribution in ApcMin/+ mice. C. Plasma IL-6 levels at the time of sacrifice in C57BL/6 and ApcMin/+ mice. D. Spleen weight in C57BL/6 and ApcMin/+ mice. Values are means ± standard error. Significance was set at P<0.05. † = signifies difference to all groups. * = signifies difference from PBS treatment within genotype. # = signifies main effect of ApcMin/+ genotype. Abbreviations: pg, picogram. mL, milliliter. mg, milligram. PBS, phosphate buffered saline. PDTC, pyrrolidine dithiocarbamate. ND, not detected.
Figure 3
Figure 3. The effect of PDTC treatment on muscle inflammatory signaling and gene expression in ApcMin/+ mice
A. Upper. Representative Western blot of phosphorylated STAT3 (Y705), total STAT3, phosphorylated P65 (S468), total P65 phosphorylated ERK1/2 (T202/Y204), total ERK1/2, phosphorylated P38 (Y182), and total P38. Lower. The quantified ratio of phosphorylated to total STAT3, P65, ERK1/2, and P38 expression. Data are normalized to C57BL/6 + PBS mice. All samples were run on the same gel. Dotted lines demonstrate that images were cropped for representative purposes. B. Muscle inflammatory gene expression. Data are normalized to C57BL/6 + PBS mice. Values are means ± standard error. Significance was set at P<0.05. * = signifies difference from PBS treatment within genotype. † = signifies difference from all other groups. ‡ = signifies differences from C57BL/6 + PBS. # = signifies main effect of ApcMin/+ genotype. Abbreviations: PBS, phosphate buffered saline. PDTC, pyrrolidine dithiocarbamate.
Figure 4
Figure 4. The effect of PDTC treatment on muscle protein turnover regulation in ApcMin/+ mice
A. Upper. Representative Western blot of phosphorylated 4E-BP1 (T37/46), total 4E-BP1, phosphorylated S6 (S235/236), phosphorylated S6 (S240/244), and total S6. Lower. The quantified ratio of phosphorylated to total 4E-BP1 and S6. Data are normalized to C57BL/6 + PBS mice. All samples were run on the same gel. Dotted lines demonstrate that images were cropped for representative purposes. B. Upper. Representative Western blot of total muscle puromycin incorporation. Lower. Quantification of total puromycin incorporation. Data are normalized to C57BL/6 + PBS mice. C. Upper. Representative Western blot of total MuRF-1, Atrogin-1, and TRAF6. Lower. The quantification of total MuRF-1, Atrogin-1, and TRAF6. Data are normalized to C57BL/6 + PBS mice. All samples were run on the same gel. Dotted lines demonstrate that images were cropped for representative purposes. Values are means ± standard error. Significance was set at P<0.05. † = signifies difference from all other groups. & = signifies main effect of PDTC treatment. # = signifies main effect of ApcMin/+ genotype. Abbreviations: PBS, phosphate buffered saline. PDTC, pyrrolidine dithiocarbamate.
Figure 5
Figure 5. The effect of PDTC treatment on liver inflammatory signaling and protein synthesis in ApcMin/+ mice
A. Upper. Representative Western blot of phosphorylated STAT3 (S727), total STAT3, phosphorylated P65 (S468), and total P65. Lower. The quantified ratio of phosphorylated to total STAT3 and P65 expression. Data are normalized to C57BL/6 + PBS mice. All samples were run on the same gel. Dotted lines demonstrate that images were cropped for representative purposes. B. Upper. Representative Western blot of phosphorylated (S2448) and total mTOR expression. Lower. The quantified ratio of phosphorylated to total mTOR expression. Data are normalized to C57BL/6 + PBS mice. All samples were run on the same gel. Dotted lines demonstrate that images were cropped for representative purposes. C. Left. Representative Western blot of liver puromycin incorporation. Lower. The quantification of liver puromycin incorporation. Data are normalized to C57BL/6 + PBS mice. All samples were run on the same gel. Values are means ± stardard error. Significance was set at P<0.05. * = signifies difference from PBS within genotype. & = signifies main effect of PDTC treatment. # = signifies main effect of ApcMin/+ genotype. Abbreviations: PBS, phosphate buffered saline. PDTC, pyrrolidine dithiocarbamate.
Figure 6
Figure 6. The effect of PDTC treatment on liver glycogen and lipid content in ApcMin/+ mice
A. Upper. Representative PAS stained liver. Lower. Quantification of liver glycogen content. B. Quantification of liver lipid content. Data are expressed as the percentage of C57BL/6 + PBS. Values are means ± standard error. Significance was set at P<0.05. ‡ = signifies differences from C57BL/6 + PBS. * = signifies difference from PBS within genotype. † = signifies difference from all other groups. Abbreviations: PAS, periodic acid-Schiff. PBS, phosphate buffered saline. PDTC, pyrrolidine dithiocarbamate.
Figure 7
Figure 7. The effect of PDTC treatment on liver metabolic gene expression in ApcMin/+ mice
A. Quantification of liver haptoglobin gene expression. Data are normalized to C57BL/6 + PBS mice. B. Quantification of liver PEPCK gene expression. Data are normalized to C57BL/6 + PBS mice. C. Quantification of liver PFK gene expression. Data are normalized to C57BL/6 + PBS mice. Values are means ± standard error. Significance was set at P<0.05. * = signifies difference from PBS within genotype. † = signifies difference from all other groups. # = signifies main effect of ApcMin/+ genotype. Abbreviations: PBS, phosphate buffered saline. PDTC, pyrrolidine dithiocarbamate. PEPCK, phosphoenolpyruvate carboxykinase. PFK, phosphofructokinase.

Similar articles

Cited by

References

    1. Tisdale MJ. Mechanisms of cancer cachexia. Physiol Rev. 2009;89:381–410. - PubMed
    1. Tisdale MJ. Cachexia in cancer patients. Nat Rev Cancer. 2002;2:862–871. - PubMed
    1. Fearon K, Arends J, Baracos V. Understanding the mechanisms and treatment options in cancer cachexia. Nat Rev Clin Oncol. 2013;10:90–99. - PubMed
    1. Baracos VE. Clinical trials of cancer cachexia therapy, now and hereafter. J Clin Oncol. 2013;31:1257–1258. - PubMed
    1. Evans WJ, Morley JE, Argiles J, Bales C, Baracos V, Guttridge D, Jatoi A, Kalantar-Zadeh K, Lochs H, Mantovani G, Marks D, Mitch WE, Muscaritoli M, et al. Cachexia: a new definition. Clin Nutr. 2008;27:793–799. - PubMed

Substances

LinkOut - more resources