

MicroRNA expression and gene regulation drive breast cancer progression and metastasis in PyMT mice
- PMID: 27449149
- PMCID: PMC4957901
- DOI: 10.1186/s13058-016-0735-z
MicroRNA expression and gene regulation drive breast cancer progression and metastasis in PyMT mice
Abstract
Background: MicroRNAs (miRNAs) are small non-coding RNA molecules of about 22 nucleotides which function to silence the expression of their target genes. Numerous studies have shown that miRNAs are not only key regulators in important cellular processes but are also drivers in the development of many diseases, especially cancer. Estrogen receptor positive luminal B is the second most common but the least studied subtype of breast cancer. Only a few studies have examined the expression profiles of miRNAs in luminal B breast cancer, and their regulatory roles in cancer progression have yet to be investigated.
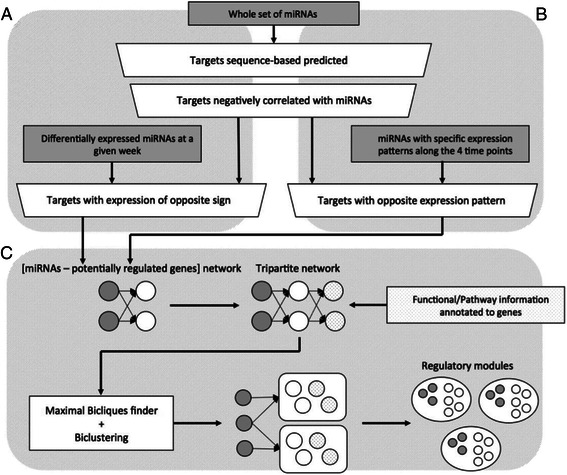
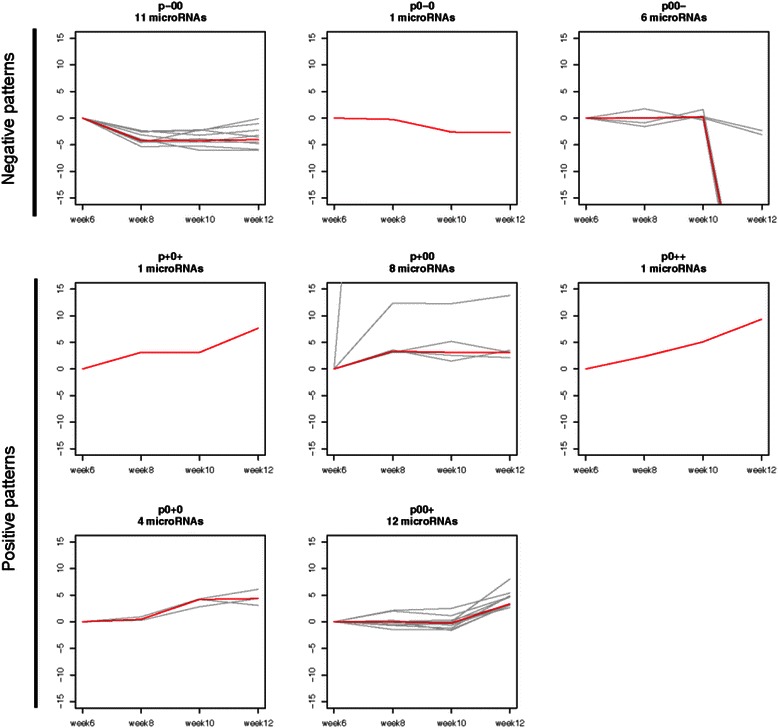
Methods: In this study, using polyoma middle T antigen (PyMT) mice, a widely used luminal B breast cancer model, we profiled microRNA (miRNA) expression at four time points that represent different key developmental stages of cancer progression. We considered the expression of both miRNAs and messenger RNAs (mRNAs) at these time points to improve the identification of regulatory targets of miRNAs. By combining gene functional and pathway annotation with miRNA-mRNA interactions, we created a PyMT-specific tripartite miRNA-mRNA-pathway network and identified novel functional regulatory programs (FRPs).
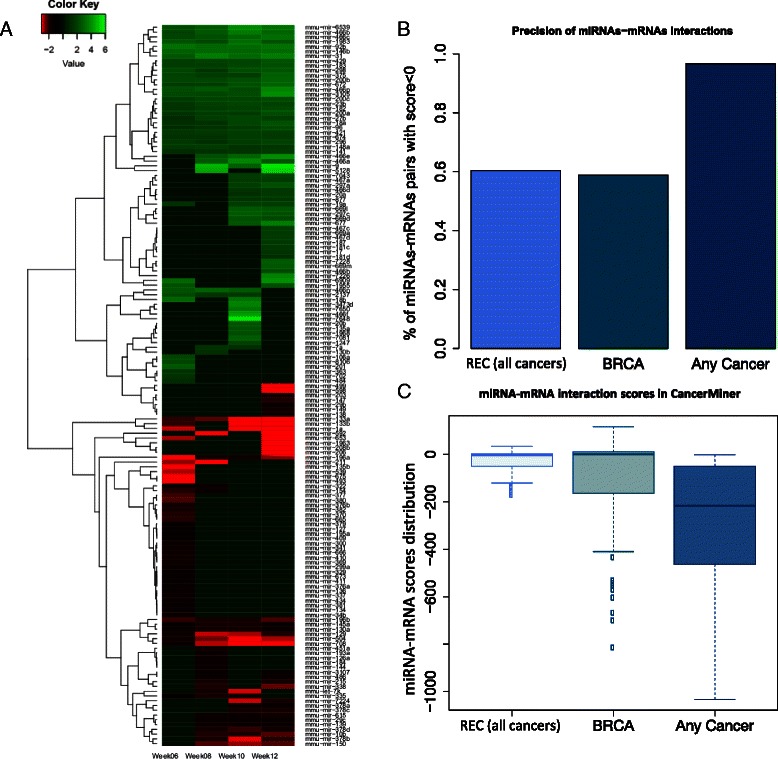
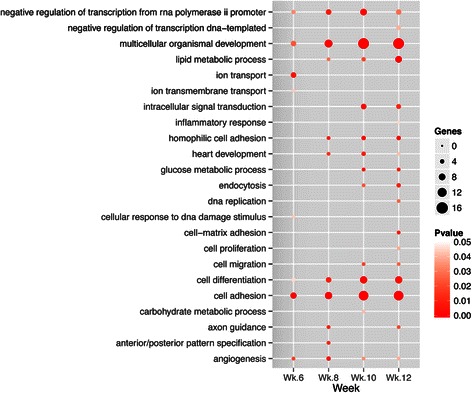
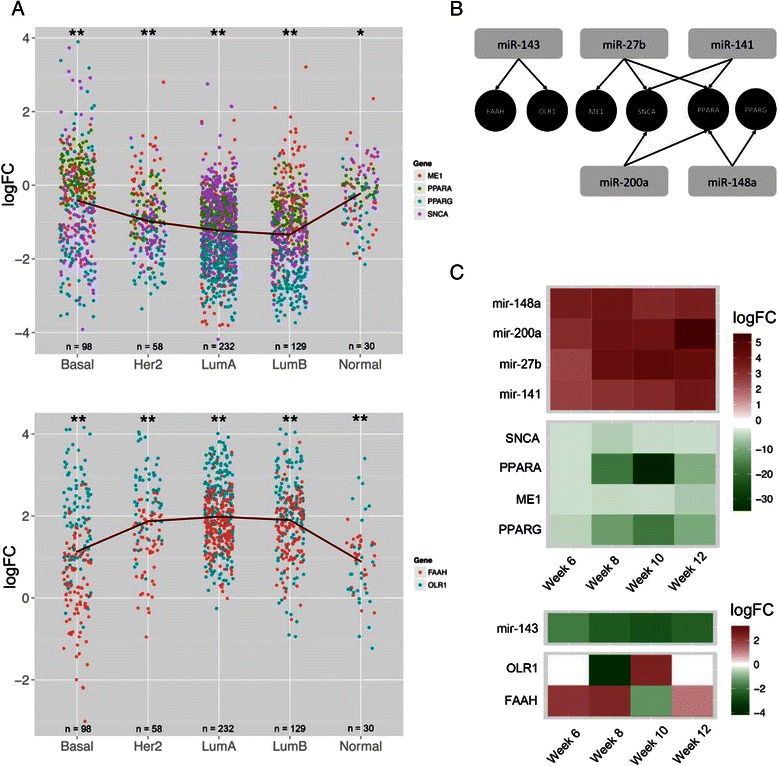
Results: We identified 151 differentially expressed miRNAs with a strict dual nature of either upregulation or downregulation during the whole course of disease progression. Among 82 newly discovered breast-cancer-related miRNAs, 35 can potentially regulate 271 protein-coding genes based on their sequence complementarity and expression profiles. We also identified miRNA-mRNA regulatory modules driving specific cancer-related biological processes.
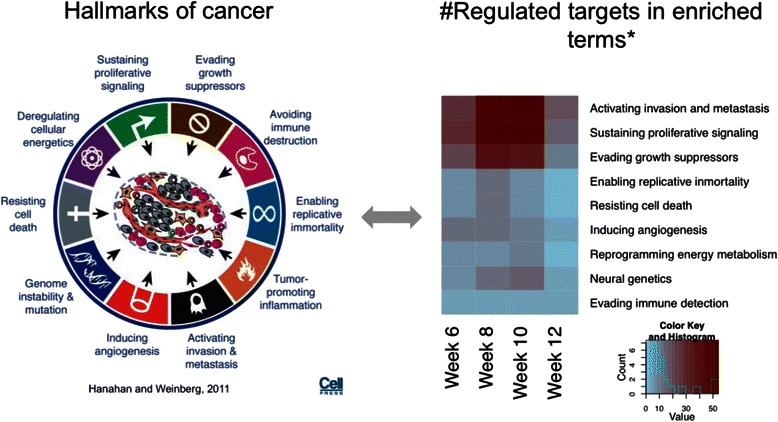
Conclusions: In this study we profiled the expression of miRNAs during breast cancer progression in the PyMT mouse model. By integrating miRNA and mRNA expression profiles, we identified differentially expressed miRNAs and their target genes involved in several hallmarks of cancer. We applied a novel clustering method to an annotated miRNA-mRNA regulatory network and identified network modules involved in specific cancer-related biological processes.
Keywords: Breast cancer; Cancer progression; Metastasis; MicroRNA; PyMT mouse model; Regulatory modules.
Figures
Similar articles
-
Analysis of the miRNA-mRNA-lncRNA networks in ER+ and ER- breast cancer cell lines.J Cell Mol Med. 2015 Dec;19(12):2874-87. doi: 10.1111/jcmm.12681. Epub 2015 Sep 28. J Cell Mol Med. 2015. PMID: 26416600 Free PMC article.
-
Prioritizing breast cancer subtype related miRNAs using miRNA-mRNA dysregulated relationships extracted from their dual expression profiling.J Theor Biol. 2013 Aug 21;331:1-11. doi: 10.1016/j.jtbi.2013.04.008. Epub 2013 Apr 22. J Theor Biol. 2013. PMID: 23619378
-
MicroRNA transcriptome profiling of mice brains infected with Japanese encephalitis virus by RNA sequencing.Infect Genet Evol. 2016 Apr;39:249-257. doi: 10.1016/j.meegid.2016.01.028. Epub 2016 Feb 2. Infect Genet Evol. 2016. PMID: 26845346
-
MicroRNA involvement in the pathogenesis and management of breast cancer.J Clin Pathol. 2009 May;62(5):422-8. doi: 10.1136/jcp.2008.060681. J Clin Pathol. 2009. PMID: 19398594 Review.
-
The Regulatory Role of MicroRNAs in Breast Cancer.Int J Mol Sci. 2019 Oct 6;20(19):4940. doi: 10.3390/ijms20194940. Int J Mol Sci. 2019. PMID: 31590453 Free PMC article. Review.
Cited by
-
An Integrated Analysis of mRNAs and miRNAs Microarray Profiles to Screen miRNA Signatures Involved in Nasopharyngeal Carcinoma.Technol Cancer Res Treat. 2020 Jan-Dec;19:1533033820956998. doi: 10.1177/1533033820956998. Technol Cancer Res Treat. 2020. PMID: 32985354 Free PMC article.
-
LINC00174 Facilitates Cell Proliferation, Cell Migration and Tumor Growth of Osteosarcoma via Regulating the TGF-β/SMAD Signaling Pathway and Upregulating SSH2 Expression.Front Mol Biosci. 2021 Jun 17;8:697773. doi: 10.3389/fmolb.2021.697773. eCollection 2021. Front Mol Biosci. 2021. Retraction in: Front Mol Biosci. 2023 May 04;10:1208571. doi: 10.3389/fmolb.2023.1208571. PMID: 34222341 Free PMC article. Retracted.
-
Jasmine: a Java pipeline for isomiR characterization in miRNA-Seq Data.Bioinformatics. 2019 Nov 4;36(6):1933-6. doi: 10.1093/bioinformatics/btz806. Online ahead of print. Bioinformatics. 2019. PMID: 31681943 Free PMC article.
-
Overexpression of miR-328-3p Inhibits Epithelial-Mesenchymal Transition in Prostate Cancer by Downregulating PFN1.Appl Biochem Biotechnol. 2025 Apr;197(4):2240-2257. doi: 10.1007/s12010-024-05103-1. Epub 2024 Dec 24. Appl Biochem Biotechnol. 2025. PMID: 39715971
-
Functional Role of miRNAs in the Progression of Breast Ductal Carcinoma in Situ.Am J Pathol. 2019 May;189(5):966-974. doi: 10.1016/j.ajpath.2018.06.025. Epub 2018 Sep 29. Am J Pathol. 2019. PMID: 30273605 Free PMC article. Review.
References
-
- Perou CM, Sorlie T, Eisen MB, van de Rijn M, Jeffrey SS, Rees CA, Pollack JR, Ross DT, Johnsen H, Akslen LA, et al. Molecular portraits of human breast tumours. Nature. 2000;406(6797):747–52. - PubMed
Publication types
MeSH terms
Substances
Grants and funding
LinkOut - more resources
Full Text Sources
Other Literature Sources
Medical
Molecular Biology Databases
