. 2016 Jul 23:5:e16937.
doi: 10.7554/eLife.16937.

Visual landmarks sharpen grid cell metric and confer context specificity to neurons of the medial entorhinal cortex

Affiliations

Visual landmarks sharpen grid cell metric and confer context specificity to neurons of the medial entorhinal cortex

José Antonio Pérez-Escobar et al. Elife. .

Abstract

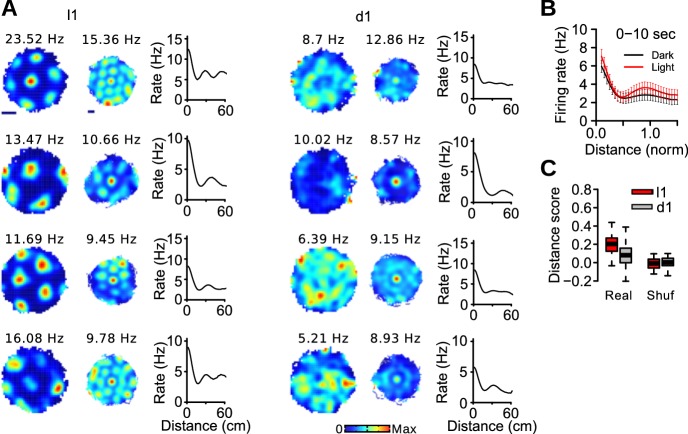
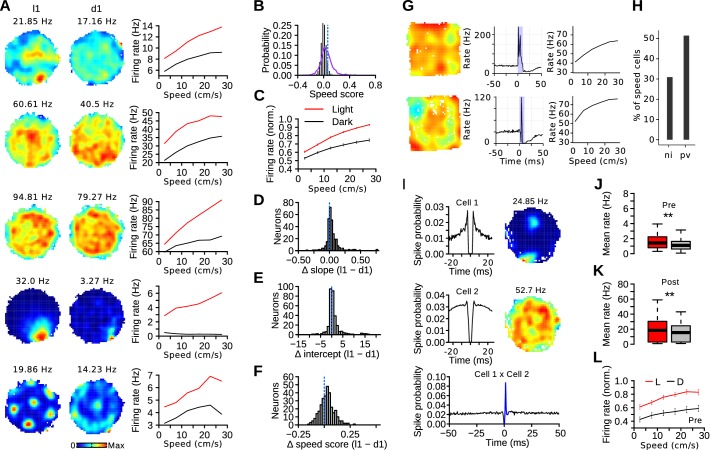
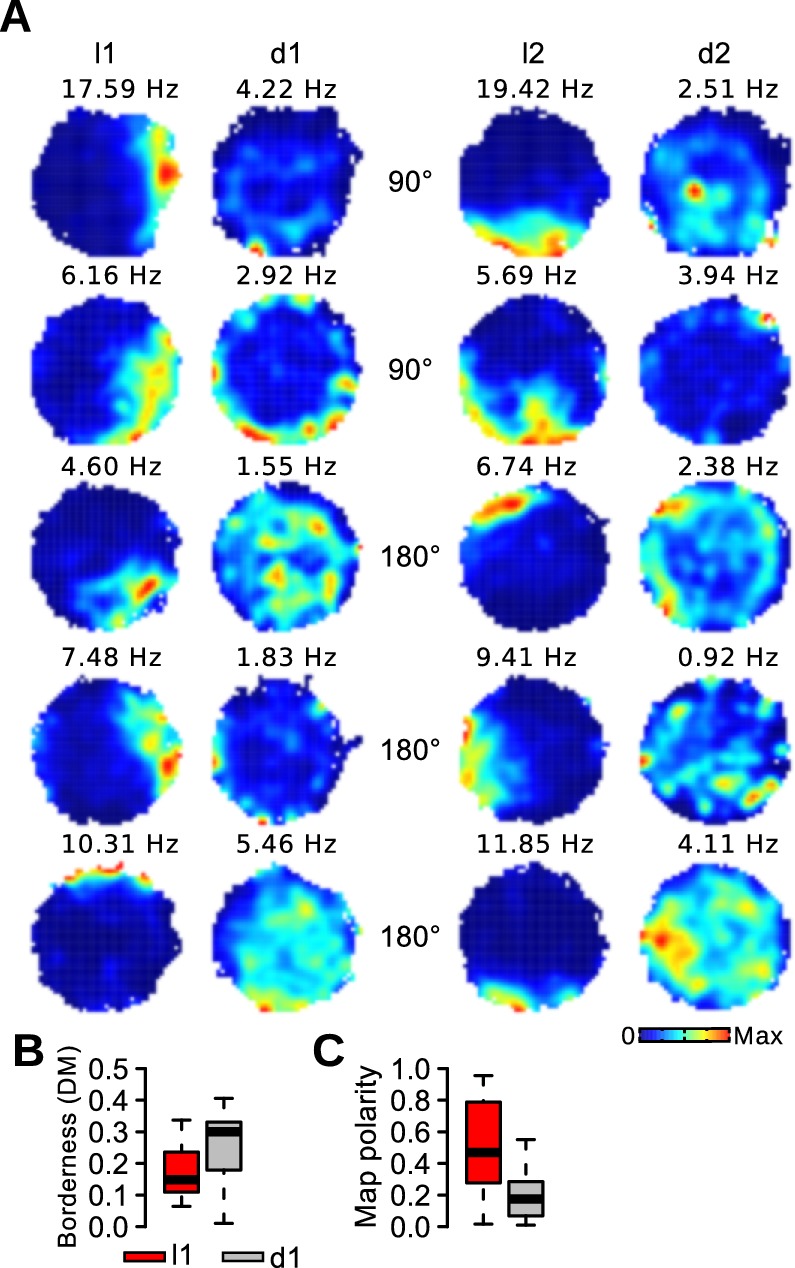
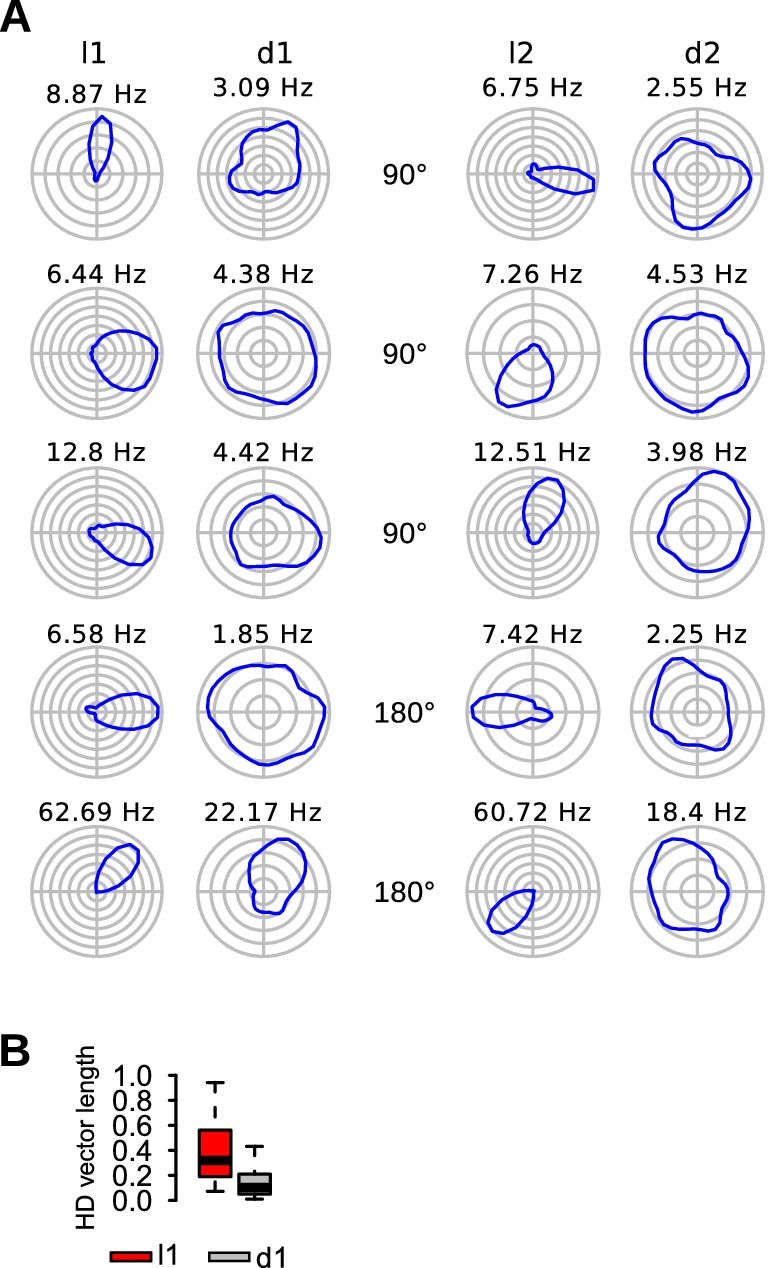
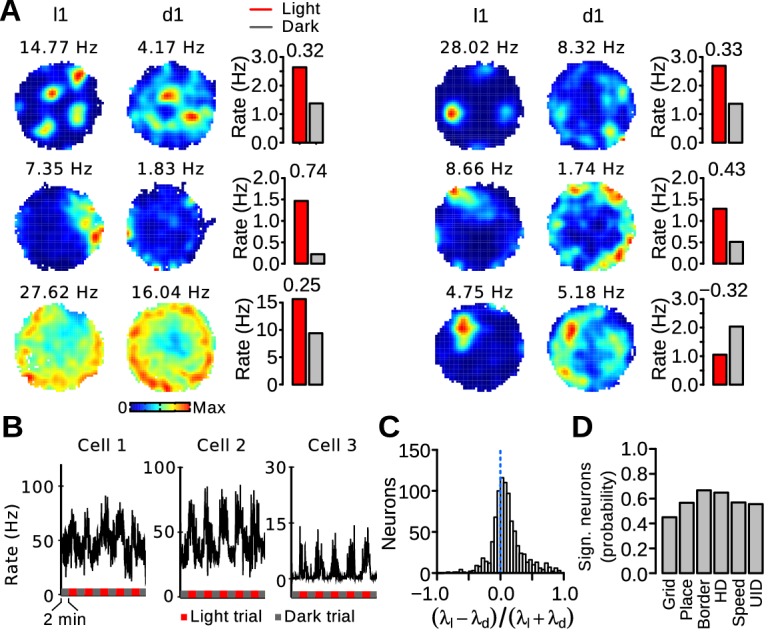
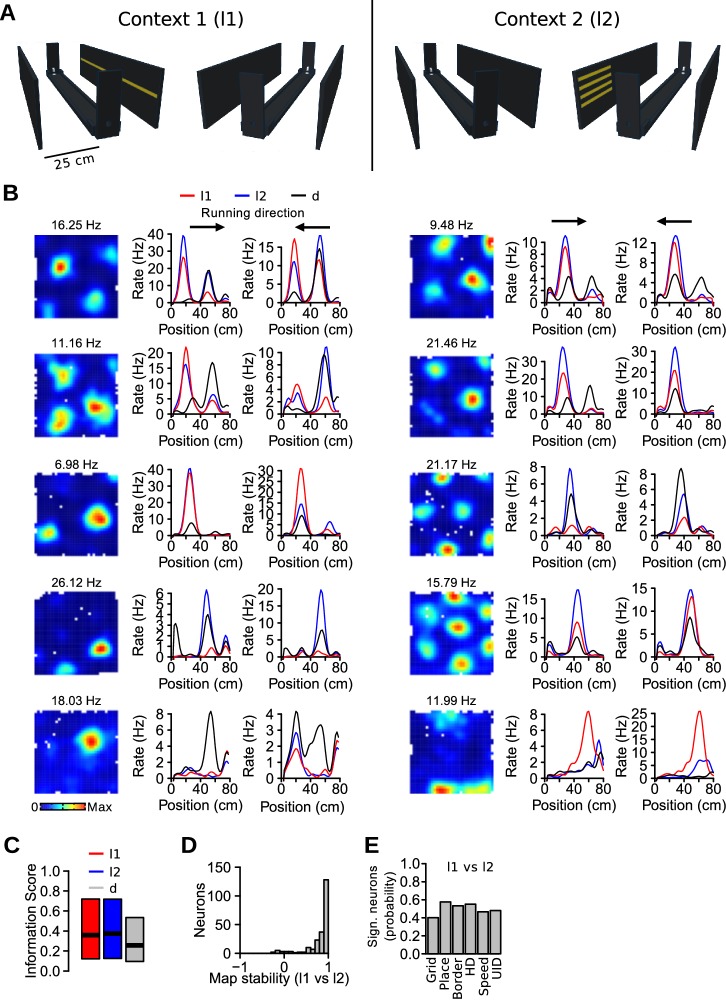
Neurons of the medial entorhinal cortex (MEC) provide spatial representations critical for navigation. In this network, the periodic firing fields of grid cells act as a metric element for position. The location of the grid firing fields depends on interactions between self-motion information, geometrical properties of the environment and nonmetric contextual cues. Here, we test whether visual information, including nonmetric contextual cues, also regulates the firing rate of MEC neurons. Removal of visual landmarks caused a profound impairment in grid cell periodicity. Moreover, the speed code of MEC neurons changed in darkness and the activity of border cells became less confined to environmental boundaries. Half of the MEC neurons changed their firing rate in darkness. Manipulations of nonmetric visual cues that left the boundaries of a 1D environment in place caused rate changes in grid cells. These findings reveal context specificity in the rate code of MEC neurons.

Keywords: border cells; grid cell; medial entorhinal cortex; mouse; navigation; neuroscience; path integration; speed cells.


Conflict of interest statement

The authors declare that no competing interests exist.

Figures

Figure 1.
Figure 1.. Recording protocol and cue control of MEC spatial representations.
(A) Schematic of the recording apparatus. Left: Side perspective. An elevated circular arena was located within a square box filled with water. Note that half of the black curtain and two light panels were omitted for better visualization. Right: Top view. Four LED panels were positioned outside the box at 90° to each other. (B) Recording protocol. Two lights out of four were selected at the beginning of each recording session (l1 and l2). The protocol started and ended with a 10-min baseline, one with each light (Baseline l1 and Baseline l2). In between were 60 2-min trials (T), alternating between light and dark trials. The presentation of the two lights (l1 and l2) followed a random sequence. Only one light could be switched on at any time. (C) Sagittal brain sections showing the location of the recording sites (red dots) in the MEC. (D) Examples of firing rate maps of two grid cells (left, one cell on each row), two irregular spatially selective neurons (middle) and two border cells (right) during trials with l1 and l2. Top and bottom rows contained cells recorded with l1 and l2 being at 90° and 180° to each other, respectively. The numbers above the firing rate maps are the peak firing rates. (E) Correlations between l1 and l2 maps after rotating l2 maps in 10° steps, plotted separately for sessions with 90° and 180° between l1 and l2. DOI: http://dx.doi.org/10.7554/eLife.16937.002
Figure 1—figure supplement 1.
Figure 1—figure supplement 1.. Spatial scores used to identify spatially selective neurons.
Observed (purple line) and surrogate (vertical black bars) distributions of the spatial scores during the baselines and trials. The 95th percentile is indicated by a red dotted line. The number next to the red line is the 95th percentile. DOI: http://dx.doi.org/10.7554/eLife.16937.005
Figure 2.
Figure 2.. Rapid degradation of grid cell periodicity in absence of visual landmarks.
(A) Firing maps of 6 grid cells during light and dark trials. (B) Distribution of grid and information scores of grid cells during l1 and d1 trials. The dotted blue line represents the surrogate (Shuf) distribution. (C) Grid and information scores during l1 and d1 trials for individual mice with at least 5 recorded grid cells. (D) Map similarity between 10-s block maps and l1 maps (left column in panel A). (E) Left: Firing rate associations of pairs of grid cells during l1 and l2 trials. Right: Firing rate associations of pairs of grid cells during l1 and d1 trials. (F) Mean firing rate of grid cells. DOI: http://dx.doi.org/10.7554/eLife.16937.006
Figure 2—figure supplement 1.
Figure 2—figure supplement 1.. Spike distance metric (SDM) during light and dark trials.
(A) Firing rate maps of 4 grid cells during l1 and d1 trials. (B) SDM for the spikes of the 4 grid cells shown in A. Time 0 represents the light-dark transitions between l1 and d1 trials. (C) Distribution of SDM of grid cell spikes for the last 60 s of l1 trials and the entire d1 trials. SDM scores were larger during dark trials (Wilcoxon signed rank test, n l1 = 282102 spikes, n d1 = 557570 spikes, w = 5.670310, p<10−16). (D) Mean SDM (black line) as a function of time (1-s time windows). 0 represents the light-dark transitions between l1 and d1 trials. The gray line indicates mean SDM after shifting the spike times by at least 20 s before recalculating the spike locations. (E) Mean SDM as a function of time from the light-dark transition. The regression lines for SDM scores between 0 and 10 s and between 10 and 60 s are shown in red. The numbers within the graph indicate the slopes of the two regression lines. DOI: http://dx.doi.org/10.7554/eLife.16937.007
Figure 3.
Figure 3.. Distance coding in grid cells.
(A) Examples of firing rate maps, spike-triggered firing maps and distance tuning curves of 4 grid cells during light and dark trials. The scale bars for firing maps represent 20 cm. (B) Mean distance tuning curves of grid cells. Distance was normalized to the spacing of each grid cell. (C) Distance score of grid cells during l1 and d1 trials for real and surrogate (Shuf) data. DOI: http://dx.doi.org/10.7554/eLife.16937.008
Figure 4.
Figure 4.. Visual stimuli alter the MEC speed code.
(A) Examples of firing rate maps and speed tuning curves during light and dark trials for cells with a significant speed score. (B) Real (purple line) and surrogate (solid black bars) distributions of speed scores from MEC neurons. The dotted blue line indicates the threshold for statistical significance. (C) Mean normalized firing rate (± s.e.m) of speed-modulated cells as a function of running speed during l1 and d1 trials. (D, E and F) Difference of speed-rate slopes, intercepts and speed scores of speed-modulated cells during l1 and d1 trials. The dotted lines indicates chance levels. (G) Firing rate map, response to laser stimulation and speed tuning curve of two PV-expressing neurons. (H) Percentage of speed-modulated cells in PV-expressing neurons (pv) and in non-identified MEC neurons (ni). (I) Example of a putative excitatory connection involving a post-synaptic speed cell. Left: spike-time autocorrelations of putative pre- (top) and post-synaptic (middle) neurons. Right: firing rate maps during light trials. Bottom: spike-time crosscorrelation of the two neurons. The blue color indicates the peak detection period. (J) Mean firing rate during light and dark trials of putative presynaptic neurons with excitatory interactions with a speed cell. (K) Mean firing rate during light and dark trials of speed cells receiving putative excitatory connections from a local neuron. (L) Mean firing rate (± s.e.m) as function of running speed of putative presynaptic neurons with excitatory interactions with a speed cell. **p<0.01. DOI: http://dx.doi.org/10.7554/eLife.16937.009
Figure 5.
Figure 5.. Impairment of border representation in darkness.
(A) Firing maps of 5 border cells during light and dark trials. (B) Borderness (DM) of the firing rate maps of border cells during light and dark trials. (C) Polarity of the firing rate maps of border cells during light and dark trials. DOI: http://dx.doi.org/10.7554/eLife.16937.010
Figure 6.
Figure 6.. Reduced head-direction selectivity in darkness.
(A) Firing maps of 5 head-direction cells during light and dark trials. (B) Head-direction vector length of head-direction cells during l1 and d1 trials. DOI: http://dx.doi.org/10.7554/eLife.16937.011
Figure 7.
Figure 7.. Firing rate changes of MEC neurons between light and dark trials.
(A) Firing maps and mean firing rates during light and dark trials for 6 neurons. The number above each bar plot is the rate discrimination index. (B) Examples of instantaneous firing rates of 3 neurons during light and dark trials (smoothing kernel width s.d = 900 ms). (C) Distribution of the rate discrimination indices for all recorded neurons (including putative interneurons). Most neurons had a positive discrimination index, indicating higher firing rates during light trials. The dotted line indicates chance level. (D) Proportion of neurons with a significant rate change between light and dark trials in different functionally defined cell types (Grid: grid cells, Place: irregular spatially selective cells, Border: border cells, HD: head-direction cells, Speed: speed-modulated cells, UID: unidentified cells). DOI: http://dx.doi.org/10.7554/eLife.16937.012
Figure 8.
Figure 8.. Nonmetric contextual visual cues affect firing rates of MEC neurons in a 1D environment.
(A) Schematic of the linear track and side walls. The linear track was flanked by two side walls on which LED arrays were attached. In the first context (l1, left), a single row of LEDs on one wall was turned on. In the other context (l2, right), 4 shorter rows of LEDs on the opposite wall were turned on. All LEDs were turned off during dark (d) trials. (B) Example of neurons with firing rate changes between the different conditions. First column, firing rate maps in the square open field. Next two columns, linear firing rate maps for the 3 conditions, plotted separately for each running direction. Note that the range of the y-axes varies. (C) Spatial information scores (median, first and third quartiles) in the 3 conditions. (D) Stability of linear firing rate maps (correlation coefficient) between l1 and l2 conditions. (E) Proportion of neurons with a significant rate change between l1 and l2 across functionally defined cell types (Grid: grid cells, Place: irregular spatially selective cells, Border: border cells, HD: head-direction cells, Speed: speed-modulated cells, UID: unidentified cells). DOI: http://dx.doi.org/10.7554/eLife.16937.013

Similar articles

Cited by

References

    1. Ainge JA, Tamosiunaite M, Wörgötter F, Dudchenko PA. Hippocampal place cells encode intended destination, and not a discriminative stimulus, in a conditional T-maze task. Hippocampus. 2012;22:534–543. doi: 10.1002/hipo.20919. - DOI - PubMed
    1. Allen K, Gil M, Resnik E, Toader O, Seeburg P, Monyer H. Impaired path integration and grid cell spatial periodicity in mice lacking GluA1-containing AMPA receptors. Journal of Neuroscience. 2014;34:6245–6259. doi: 10.1523/JNEUROSCI.4330-13.2014. - DOI - PMC - PubMed
    1. Allen K, Rawlins JN, Bannerman DM, Csicsvari J. Hippocampal place cells can encode multiple trial-dependent features through rate remapping. Journal of Neuroscience. 2012;32:14752–14766. doi: 10.1523/JNEUROSCI.6175-11.2012. - DOI - PMC - PubMed
    1. Barry C, Hayman R, Burgess N, Jeffery KJ. Experience-dependent rescaling of entorhinal grids. Nature Neuroscience. 2007;10:682–684. doi: 10.1038/nn1905. - DOI - PubMed
    1. Bender F, Gorbati M, Cadavieco MC, Denisova N, Gao X, Holman C, Korotkova T, Ponomarenko A. Theta oscillations regulate the speed of locomotion via a hippocampus to lateral septum pathway. Nature Communications. 2015;6:8521. doi: 10.1038/ncomms9521. - DOI - PMC - PubMed

Publication types