

Development of an image Mean Square Displacement (iMSD)-based method as a novel approach to study the intracellular trafficking of nanoparticles
- PMID: 27449340
- PMCID: PMC5483853
- DOI: 10.1016/j.actbio.2016.07.031
Development of an image Mean Square Displacement (iMSD)-based method as a novel approach to study the intracellular trafficking of nanoparticles
Abstract
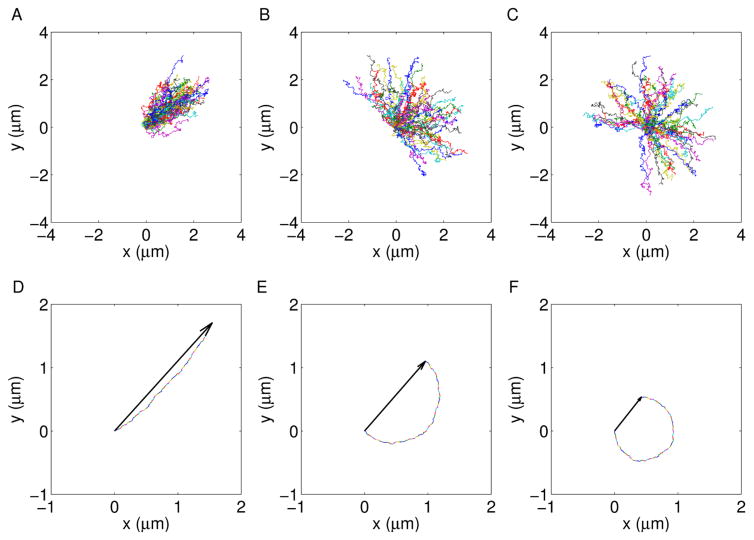
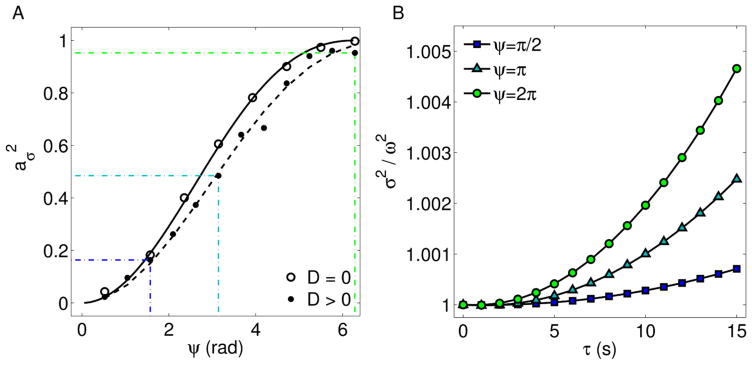
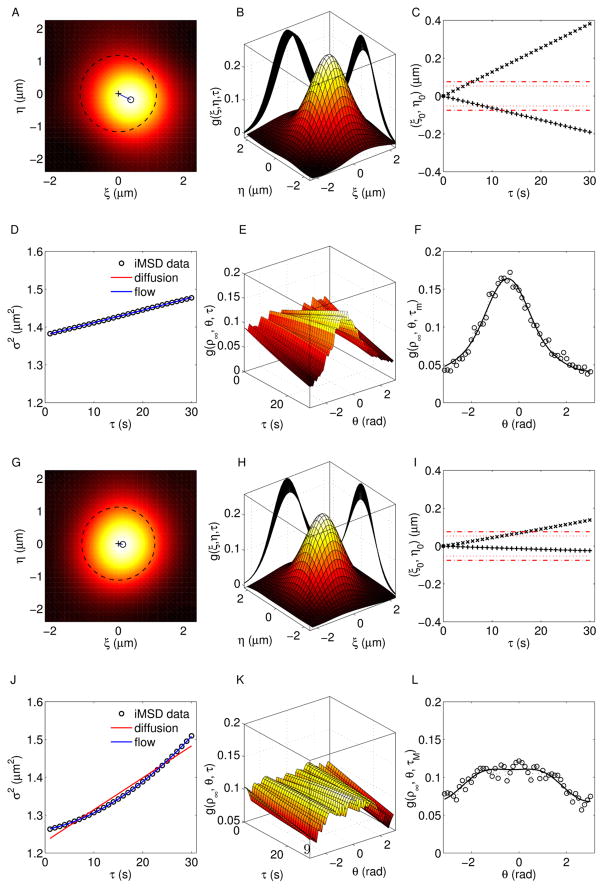
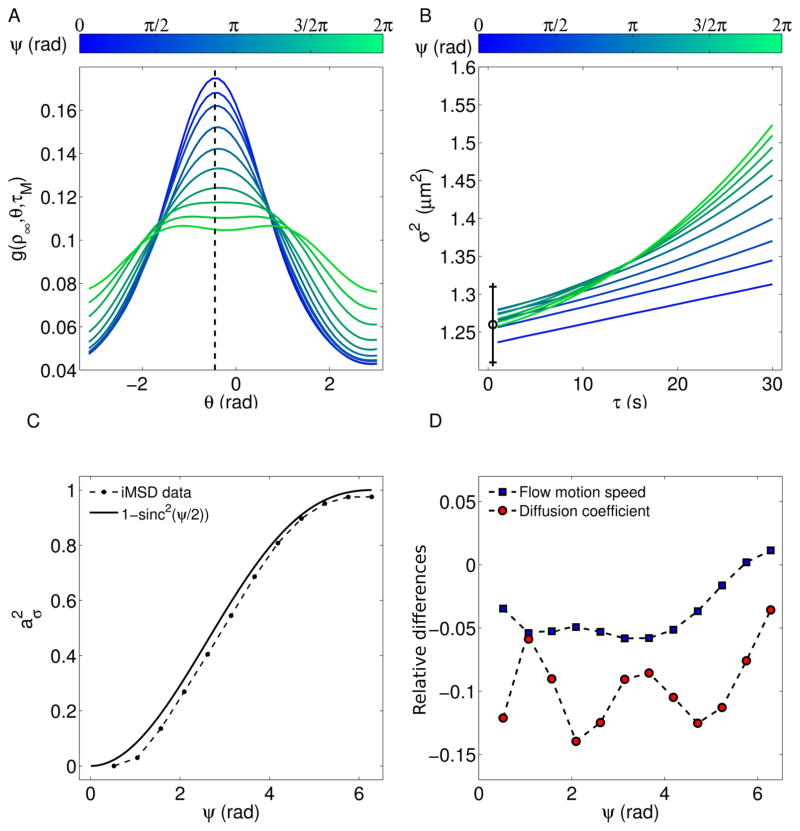
Fluorescence microscopy and spectroscopy techniques are commonly used to investigate complex and interacting biological systems (e.g. proteins and nanoparticles in living cells), since these techniques can explore intracellular dynamics with high time resolution at the nanoscale. Here we extended one of the Image Correlation Spectroscopy (ICS) methods, i.e. the image Mean Square Displacement, in order to study 2-dimensional diffusive and flow motion in confined systems, whose driving speed is uniformly distributed in a variable angular range. Although these conditions are not deeply investigated in the current literature, they can be commonly found in the intracellular trafficking of nanocarriers, which diffuse in the cytoplasm and/or may move along the cytoskeleton in different directions. The proposed approach could reveal the underlying system's symmetry using methods derived from fluorescence correlation concepts and could recover dynamic and geometric features which are commonly done by single particle analyses. Furthermore, it improves the characterization of low-speed flow motions, when compared to SpatioTemporal Image Correlation Spectroscopy (STICS). Although we present a specific example (lipoplexes in living cells), the emphasis is in the discussion of the method, its basic assumptions and its validation on numeric simulations.
Statement of significance: Recent advances in nanoparticle-based drug and gene delivery systems have pointed out the interactions at cellular and subcellular levels as key-factors for the efficiency of the adopted biomaterials. Such biochemical and biophysical interactions drive and affect the intracellular dynamics, that is commonly characterized by means of fluorescence microscopy and spectroscopy techniques. Here we present a novel Image Correlation Spectroscopy (ICS) method as a promising tool to capture the intracellular behavior of nanoparticles with high resolution and low background's sensitivity. This study overcomes some of the approximations adopted so far, by decoupling the flow terms of the investigated dynamics and thus recovering ensemble's information from specific single particle behaviors. Finally, relevant implications for nanoparticle-based drug delivery are shown.
Keywords: Drug and gene delivery; Image Correlation Spectroscopy (ICS); Intracellular trafficking.
Copyright © 2016 Acta Materialia Inc. All rights reserved.
Figures
References
-
- Keating E, Nohe A, Petersen NO. Studies of distribution, location and dynamic properties of egfr on the cell surface measured by image correlation spectroscopy. Eur Biophys J. 2008;37:469–481. - PubMed
-
- Brown CM, Petersen NO. An image correlation analysis of the distribution of clathrin associated adaptor protein (ap-2) at the plasma membrane. J Cell Sci. 1998;111:271–281. - PubMed
-
- Kogure T, Karasawa S, Araki T, Saito K, Kinjo M, Miyawaki A. A fluorescent variant of a protein from the stony coral montipora facilitates dual-color single-laser fluorescence cross-correlation spectroscopy. Nat Biotechnol. 2006;24:577–581. - PubMed
MeSH terms
Substances
Grants and funding
LinkOut - more resources
Full Text Sources
Other Literature Sources
Research Materials
