. 2017 Jun;37(6):2084-2097.
doi: 10.1177/0271678X16660986. Epub 2016 Jan 1.

Inadequate food and water intake determine mortality following stroke in mice

Affiliations

Inadequate food and water intake determine mortality following stroke in mice

Athanasios Lourbopoulos et al. J Cereb Blood Flow Metab. 2017 Jun.

Abstract

Experimental stroke models producing clinically relevant functional deficits are often associated with high mortality. Because the mechanisms that underlie post-stroke mortality are largely unknown, results obtained using these models are often difficult to interpret, thereby limiting their translational potential. Given that specific forms of post-stroke care reduce mortality in patients, we hypothesized that inadequate food and water intake may underlie mortality following experimental stroke. C57BL/6 mice were subjected to 1 h of intraluminal filament middle cerebral artery occlusion. Nutritional support beginning on the second day after filament middle cerebral artery occlusion reduced the 14-day mortality rate from 59% to 15%. The surviving mice in the post-stroke support group had the same infarct size as non-surviving control mice, suggesting that post-stroke care was not neuroprotective and that inadequate food and/or water intake are the main reasons for filament middle cerebral artery occlusion-induced mortality. This notion was supported by the presence of significant hypoglycemia, ketonemia, and dehydration in control mice. Taken together, these data suggest that post-filament middle cerebral artery occlusion mortality in mice is not primarily caused by ischemic brain damage, but secondarily by inadequate food and/or water intake. Thus, providing nutritional support following filament middle cerebral artery occlusion greatly minimizes mortality bias and allows the study of long-term morphological and functional sequelae of stroke in mice.

Keywords: chronic stroke model; filament middle cerebral artery occlusion; mortality; stroke care; translational medicine.


Figures
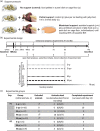
Figure 1.
Figure 1.
Schematic overview of the stroke model and nutritional support protocols. (a) Illustration of the three post-stroke protocols. (b) Timeline depicting the study design and two experiments. The primary outcome of experiment 1 was 14-day survival. Experiment 2 focused on locomotor activity (via open field analysis), water and food intake, blood levels of glucose, beta-hydroxybutyric acid, urea, electrolytes, pH, and white blood cells. (c) Summary of the mice in the various groups. aThese animals were excluded due to the presence of a brain lesion following sham surgery; bThese animals were excluded due to intestinal trauma caused by repeated insertion of a rectal probe in ischemic/dehydrated animals. Note that experiment 2 did not include a rectal probe; therefore, the animals with ischemia did not develop intestinal trauma.
Figure 2.
Figure 2.
Nutritional support reduces mortality. (a) A Kaplan–Meier survival plot shows that maximal nutritional support (M-poj group) doubled the 14-day survival rate compared with control mice (M-p). (b) Both nutritional support protocols delayed fMCAo-associated mortality; however, only maximal support reduced the total number of dead animals. (c) Representative MAP2-stained brain sections (+1.0 mm or −2.0 mm relative to Bregma); the infarct lesion appears as white tissue. (d) Summary of %Vinf (corrected for atrophy and/or edema) in animals that survived to day 14 (“survived,” black filled symbols) and animals that died before day 14 (“dead,” open gray symbols). (e) Representative Nissl-stained brain sections adjacent to the respective sections shown in panel (c), showing left hemispheric atrophy. (f) Summary of ipsilateral atrophy. The horizontal lines in (b), (d), and (f) represent the mean values. *p < 0.05; **p < 0.01.
Figure 3.
Figure 3.
Post-stroke nutritional support does not reduce fMCAo-induced focal neurological or systemic behavioral deficits measured using the experimental stroke scale (ESS). (a) Summary of focal deficits (fESS) in the indicated groups at the indicated times following fMCAo or sham surgery. Note that the apparent improvement in the M-p group at day 7 was due to the high mortality rate in this group, which resulted in a bias toward surviving animals. (b) The fESS scores were correlated with infarct volume measured on day 14; the data depict the M-poj group. (c) Summary of general systemic behavioral deficits (gESS) in the indicated groups at the indicated times following fMCAo or sham surgery. The symbols correspond to the groups shown in panel (a). (d) The gESS scores do not correlate strongly with infarct volume measured on day 14. (e) Distribution of the stroke severity in the indicated groups based on fESS clustering, showing the degree of bias in the M-p group due to high mortality and the subsequent loss of severely affected animals from the analysis. *p < 0.05 versus M-poj; p < 0.05 versus M-po.
Figure 4.
Figure 4.
Maximal nutritional support facilitates the ability to measure fMCAo-associated weight loss and hypothermia by reducing mortality. (a) Summary of body weight loss in the indicated groups at the indicated times following fMCAo or sham surgery (expressed as the percent loss relative to baseline BW; the horizontal gray line at −15% corresponds to “85% baseline BW”). (b) Maximum body weight loss is significantly correlated with infarct volume. (c) Summary of body temperature measured in the indicated groups at the indicated times following fMCAo or sham surgery. The symbols correspond to the groups shown in panel (a). The horizontal gray line corresponds to 37.5℃ (normothermia). (d) Maximum hypothermia (i.e. the lowest body temperature measured in the animal) is significantly correlated with infarct volume. The data in panels (b) and (d) show the M-poj group.
Figure 5.
Figure 5.
fMCAo reduces water and food intake in mice, leading to changes in blood glucose and bHB levels. (a) Summary of food intake (grams/day per mouse) in the indicated groups at the indicated times following fMCAo or sham surgery. For days 3 and 7, animals in M-poj group consumed food either spontaneously as pellets (part of the bars with oblique lines) or assisted (white part of the bars). (b) Summary of water intake (ml/day per mouse) in the indicated groups at the indicated times following fMCAo or sham surgery. Note that the jelly food given to the M-poj group contains water. Similar to (a), on days 3 and,7 M-poj animals consumed water either spontaneously from the cage bottle (oblique lines) or from the assisted feeding (white part of the bars). (c,d) Graphs showing the negative correlation between the infarct volume and the spontaneous food (c) and water (d) consumption on day 3, indicative of anorexia. (e,f) Summary of blood glucose levels (e) and plasma bHB levels (f) in the indicated groups at the indicated times following fMCAo or sham surgery. (g) Total bacterial load in lungs of naive, S-p, M-p, and M-poj groups at the time of death or sacrifice for each animal (“pos.c.” and “neg.c.” stand for positive and negative technical control samples (i.e. fecal sample and water, respectively). (h) White blood cell (WBC) count on days 3–14 post-fMCAO. *p < 0.05, **p < 0.01, ***p < 0.001 for comparisons with naive; ##p < 0.01, ###p < 0.001. Bars show means ± s.e. Dotted gray lines in (a), (b), (e), (f), and (h) indicate the range (95% confidence intervals) of food (a) and water (b) consumption as well as the blood glucose (e), plasma ketone bodies (bHB, f) and WBCs (h) in mice that were not subjected to surgery (naïve).
Figure 6.
Figure 6.
Locomotor activity in the S-p, M-p, and M-poj groups (experiment 2; see Figure 1). (a) Cumulative heat maps depicting the time spent by each animal in the open field arena at baseline and on days 3, 7, and 14 following fMCAo or sham surgery. Note that data were not available for the M-p group on days 7 and 14, as 9 of the 11 animals died prior to this time point. (b) Schematic diagram depicting the open field arena used together with Ethovision software. The open zone in the middle, four walls, and four corners (“+”) are indicated. (c,d) Percent change in total distance covered (c) and percent change in movement (d) relative to baseline (0%) for the indicated groups at the indicated times following fMCAo or sham surgery. Note that the high mortality rate in the M-p group precluded analysis after day 3. *p < 0.05 versus baseline.

References

    1. Donnan GA, Fisher M, Macleod M, et al. Stroke. Lancet 2008; 371: 1612–1623. - PubMed
    1. Grotta JC, Hacke W. Stroke neurologist's perspective on the new endovascular trials. Stroke 2015; 46: 1447–1452. - PubMed
    1. Dirnagl U, Endres M. Found in translation: preclinical stroke research predicts human pathophysiology, clinical phenotypes, and therapeutic outcomes. Stroke 2014; 45: 1510–1518. - PubMed
    1. O'Collins VE, Macleod MR, Donnan GA, et al. 1,026 experimental treatments in acute stroke. Ann Neurol 2006; 59: 467–477. - PubMed
    1. Sena ES, van der Worp HB, Bath PM, et al. Publication bias in reports of animal stroke studies leads to major overstatement of efficacy. PLoS Biol 2010; 8: e1000344. - PMC - PubMed