

Properties of skeletal muscle in the teleost Sternopygus macrurus are unaffected by short-term electrical inactivity
- PMID: 27449658
- PMCID: PMC5111878
- DOI: 10.1152/physiolgenomics.00068.2016
Properties of skeletal muscle in the teleost Sternopygus macrurus are unaffected by short-term electrical inactivity
Abstract
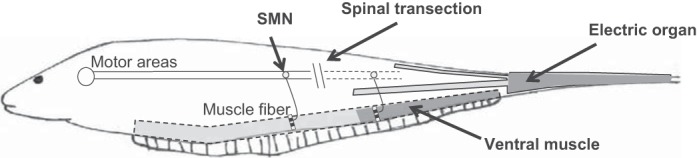
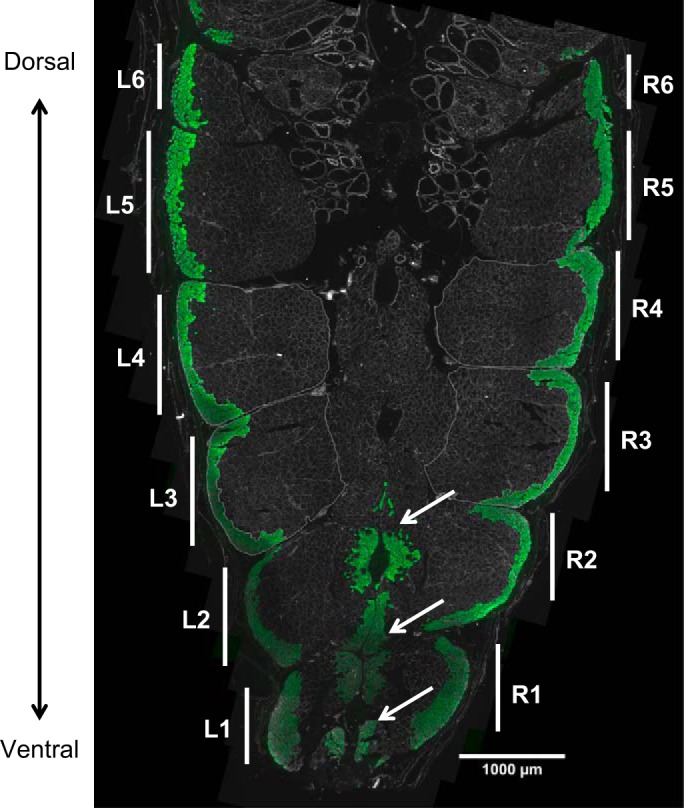
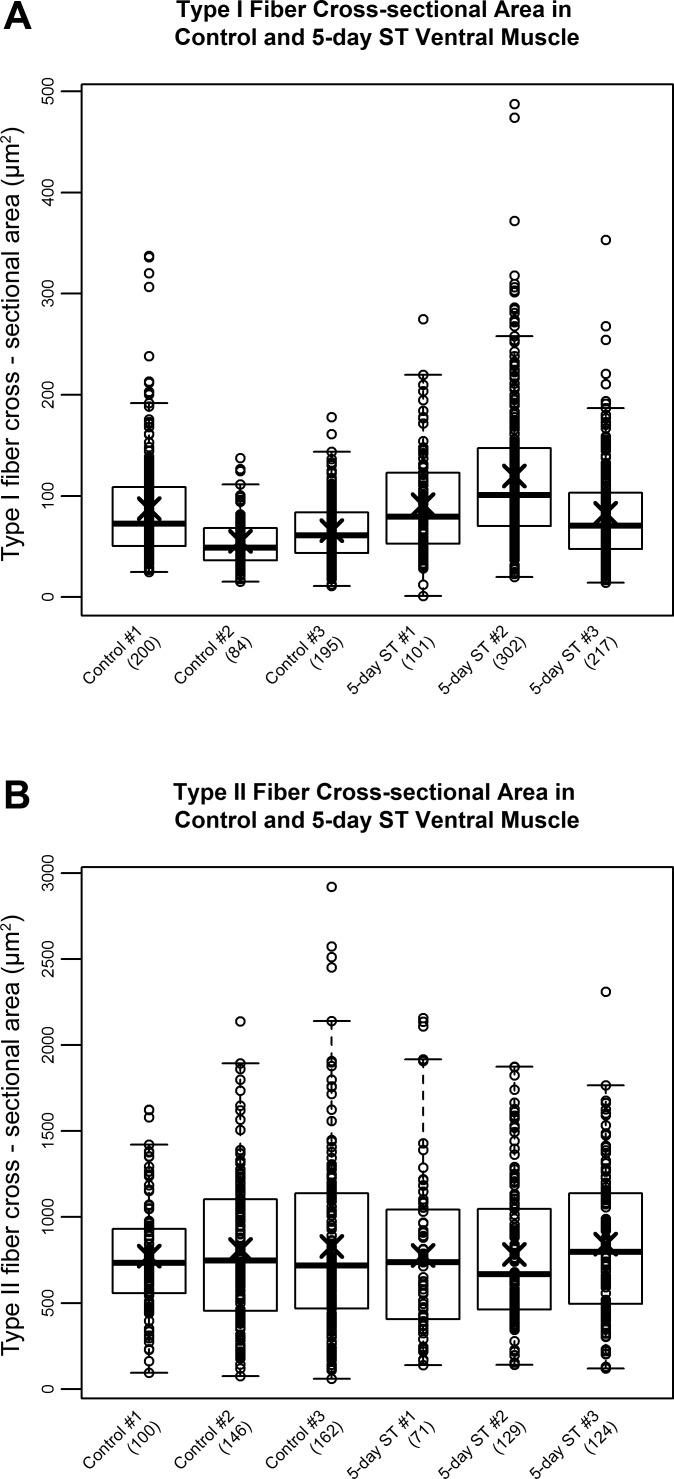
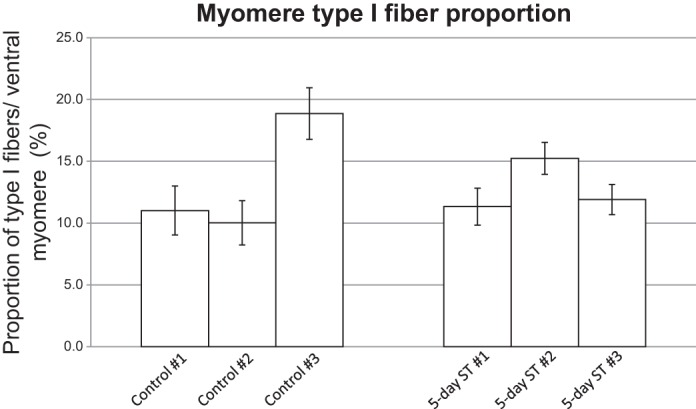
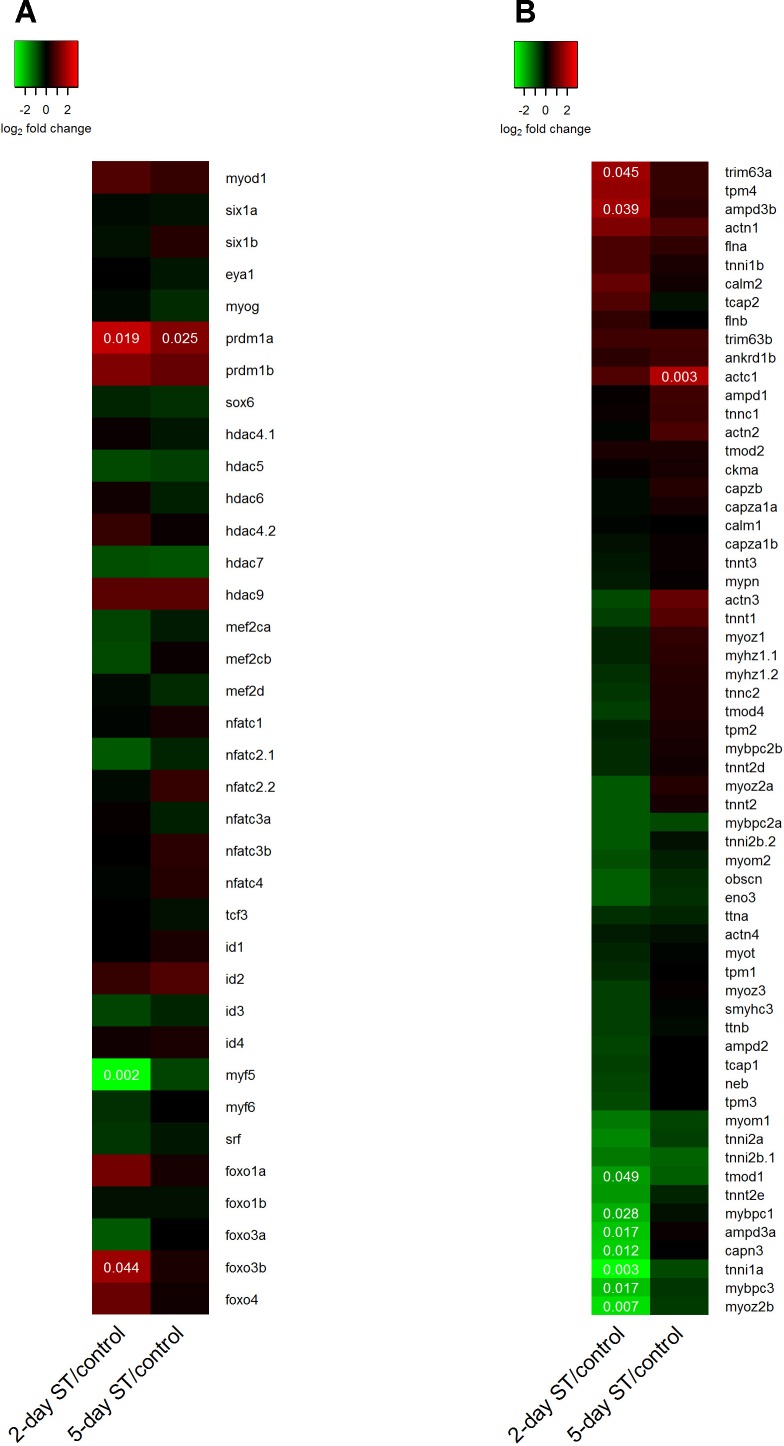
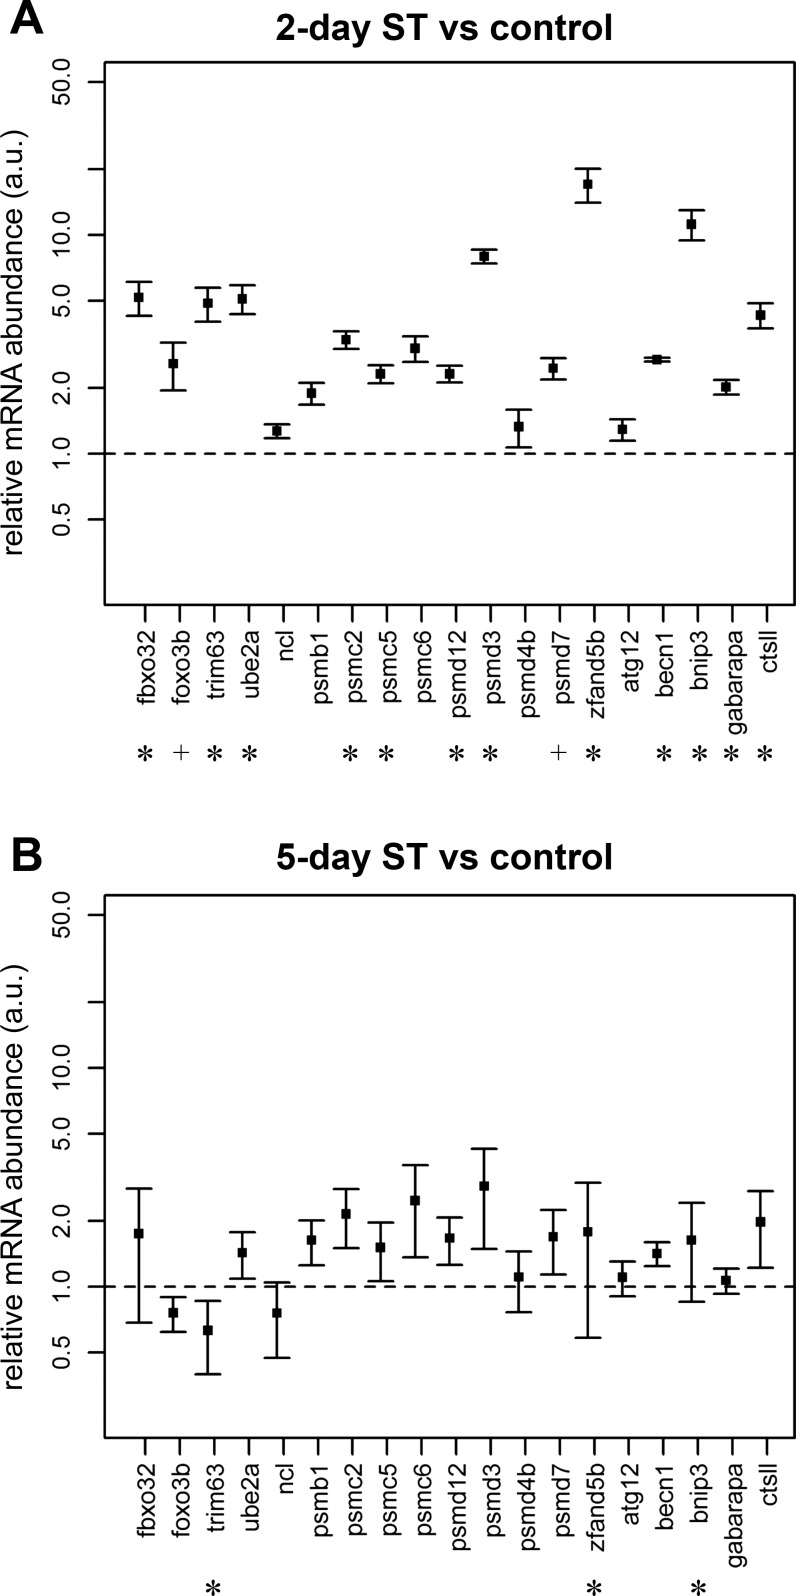
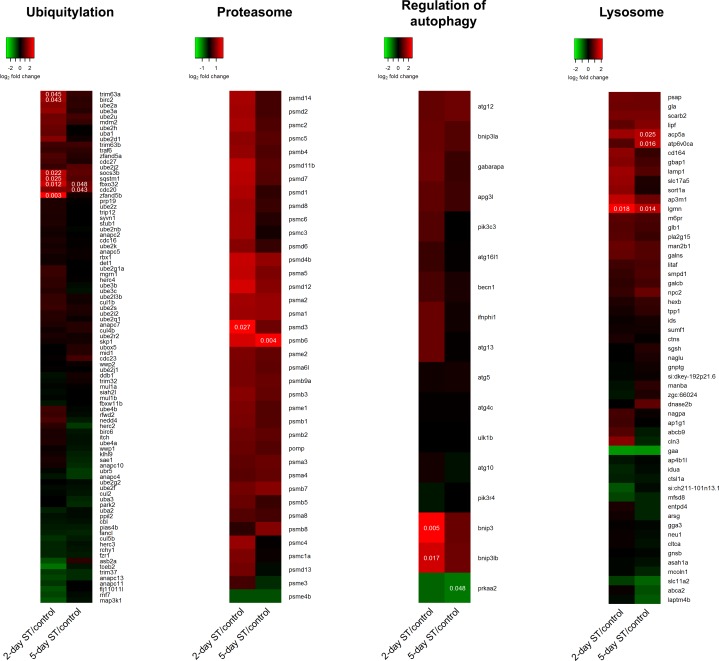
Skeletal muscle is distinguished from other tissues on the basis of its shape, biochemistry, and physiological function. Based on mammalian studies, fiber size, fiber types, and gene expression profiles are regulated, in part, by the electrical activity exerted by the nervous system. To address whether similar adaptations to changes in electrical activity in skeletal muscle occur in teleosts, we studied these phenotypic properties of ventral muscle in the electric fish Sternopygus macrurus following 2 and 5 days of electrical inactivation by spinal transection. Our data show that morphological and biochemical properties of skeletal muscle remained largely unchanged after these treatments. Specifically, the distribution of type I and type II muscle fibers and the cross-sectional areas of these fiber types observed in control fish remained unaltered after each spinal transection survival period. This response to electrical inactivation was generally reflected at the transcript level in real-time PCR and RNA-seq data by showing little effect on the transcript levels of genes associated with muscle fiber type differentiation and plasticity, the sarcomere complex, and pathways implicated in the regulation of muscle fiber size. Data from this first study characterizing the acute influence of neural activity on muscle mass and sarcomere gene expression in a teleost are discussed in the context of comparative studies in mammalian model systems and vertebrate species from different lineages.
Keywords: fiber types in teleost fish; muscle inactivation; muscle transcriptome; skeletal muscle atrophy; spinal cord transection.
Copyright © 2016 the American Physiological Society.
Figures
Similar articles
-
Molecular feature-based classification of retroperitoneal liposarcoma: a prospective cohort study.Elife. 2025 May 23;14:RP100887. doi: 10.7554/eLife.100887. Elife. 2025. PMID: 40407808 Free PMC article.
-
Surveillance for Violent Deaths - National Violent Death Reporting System, 50 States, the District of Columbia, and Puerto Rico, 2022.MMWR Surveill Summ. 2025 Jun 12;74(5):1-42. doi: 10.15585/mmwr.ss7405a1. MMWR Surveill Summ. 2025. PMID: 40493548 Free PMC article.
-
Identification and Functional Characterization of Two Distinct Muscle Stem Cell Populations in Golden Pompano Trachinotus ovatus.Mar Biotechnol (NY). 2025 Jun 9;27(3):93. doi: 10.1007/s10126-025-10470-9. Mar Biotechnol (NY). 2025. PMID: 40488926
-
Pharmacological and electronic cigarette interventions for smoking cessation in adults: component network meta-analyses.Cochrane Database Syst Rev. 2023 Sep 12;9(9):CD015226. doi: 10.1002/14651858.CD015226.pub2. Cochrane Database Syst Rev. 2023. PMID: 37696529 Free PMC article.
-
Assessing the comparative effects of interventions in COPD: a tutorial on network meta-analysis for clinicians.Respir Res. 2024 Dec 21;25(1):438. doi: 10.1186/s12931-024-03056-x. Respir Res. 2024. PMID: 39709425 Free PMC article. Review.
Cited by
-
Sternopygus macrurus electric organ transcriptome and cell size exhibit insensitivity to short-term electrical inactivity.J Physiol Paris. 2016 Oct;110(3 Pt B):233-244. doi: 10.1016/j.jphysparis.2016.11.005. Epub 2016 Nov 15. J Physiol Paris. 2016. PMID: 27864094 Free PMC article.
References
-
- Allen DL, Sartorius CA, Sycuro LK, Leinwand LA. Different pathways regulate expression of the skeletal myosin heavy chain genes. J Biol Chem 276: 43524–43533, 2001. - PubMed
-
- van Asselt E, van Raamsdonk W, de Graaf F, Smit-Onel MJ, Diegenbach PC, Heuts B. Enzyme histochemical profiles of fish spinal motoneurons after cordotomy and axotomy of motor nerves. Brain Res 531: 25–35, 1990. - PubMed
-
- Baldwin KM, Haddad F. Effects of different activity and inactivity paradigms on myosin heavy chain gene expression in striated muscle. J Appl Physiol 90: 345–357, 2001. - PubMed
-
- Bassel-Duby R, Olson EN. Signaling pathways in skeletal muscle remodeling. Annu Rev Biochem 75: 19–37, 2006. - PubMed
-
- Batt J, Bain J, Goncalves J, Michalski B, Plant P, Fahnestock M, Woodgett J. Differential gene expression profiling of short and long term denervated muscle. FASEB J 20: 115–117, 2006. - PubMed
Publication types
MeSH terms
Grants and funding
LinkOut - more resources
Full Text Sources
Other Literature Sources