Comparative Study
. 2016 Oct 1;80(7):509-21.
doi: 10.1016/j.biopsych.2016.05.012. Epub 2016 May 24.

Circuit-Based Corticostriatal Homologies Between Rat and Primate

Affiliations
Comparative Study

Circuit-Based Corticostriatal Homologies Between Rat and Primate

Sarah R Heilbronner et al. Biol Psychiatry. .

Abstract

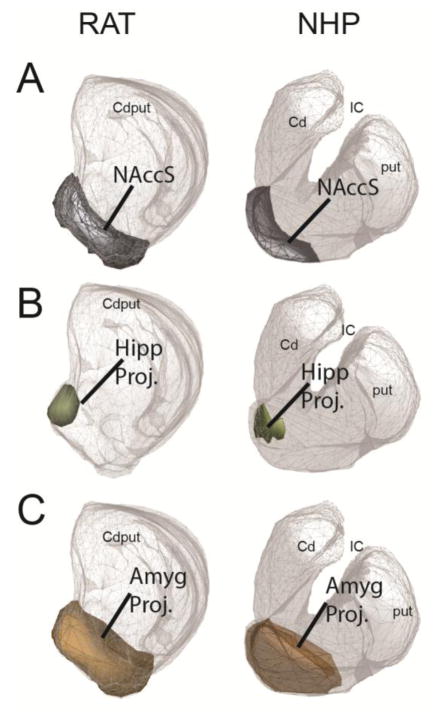
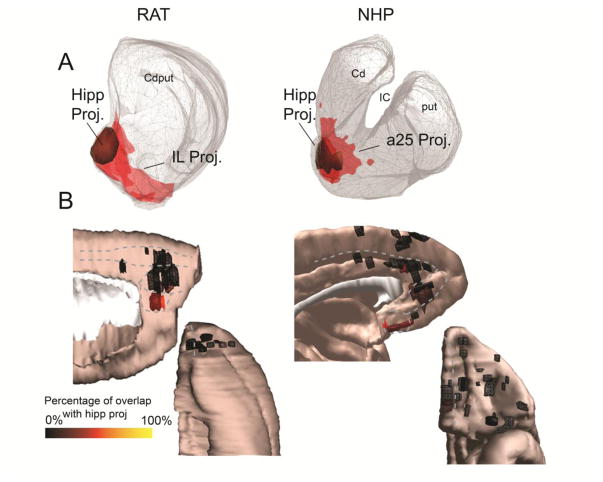
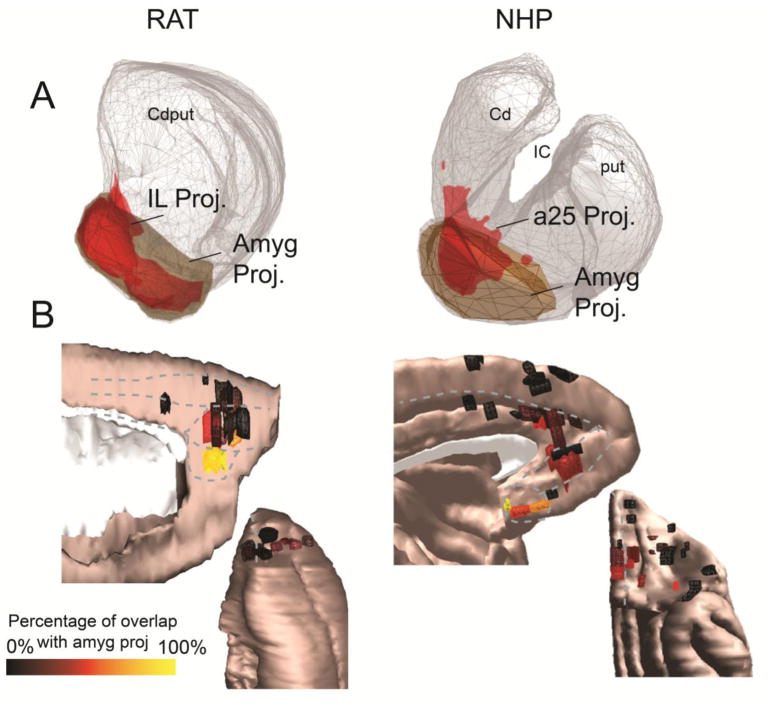
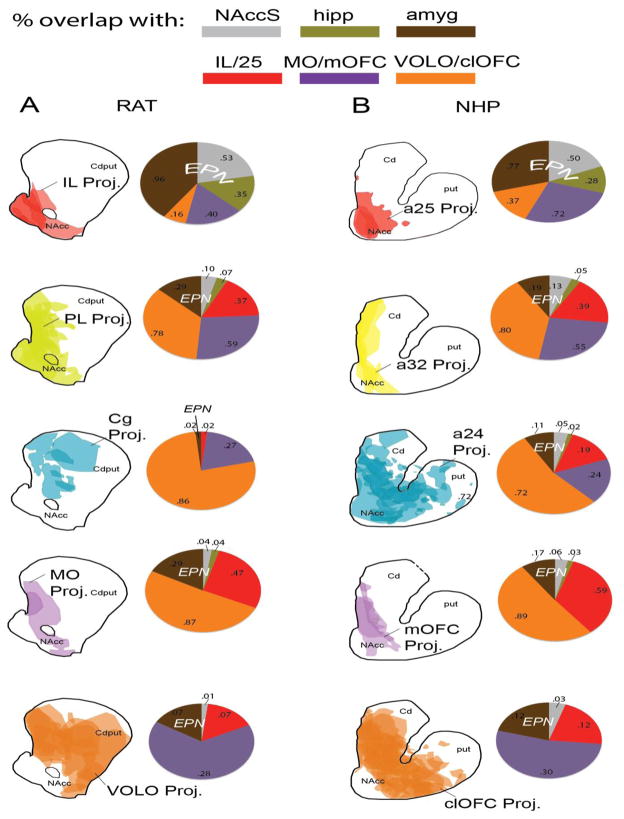
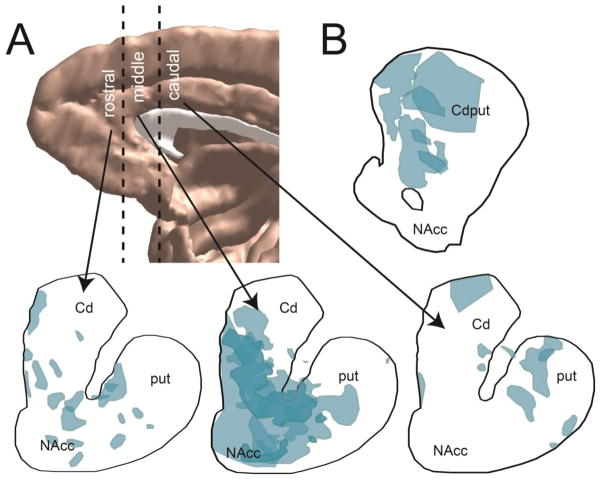
Background: Understanding the neural mechanisms of psychiatric disorders requires the use of rodent models; however, frontal-striatal homologies between rodents and primates are unclear. In contrast, within the striatum, the shell of the nucleus accumbens, the hippocampal projection zone, and the amygdala projection zone (referred to as the striatal emotion processing network [EPN]) are conserved across species. We used the relationship between the EPN and projections from the anterior cingulate cortex (ACC) and orbitofrontal cortex (OFC) to assess network similarities across rats and monkeys.

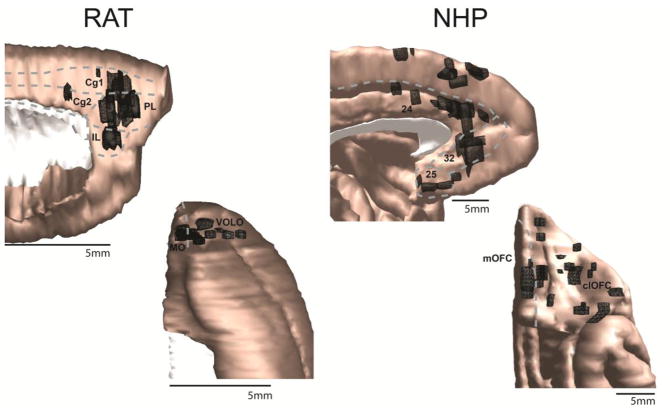
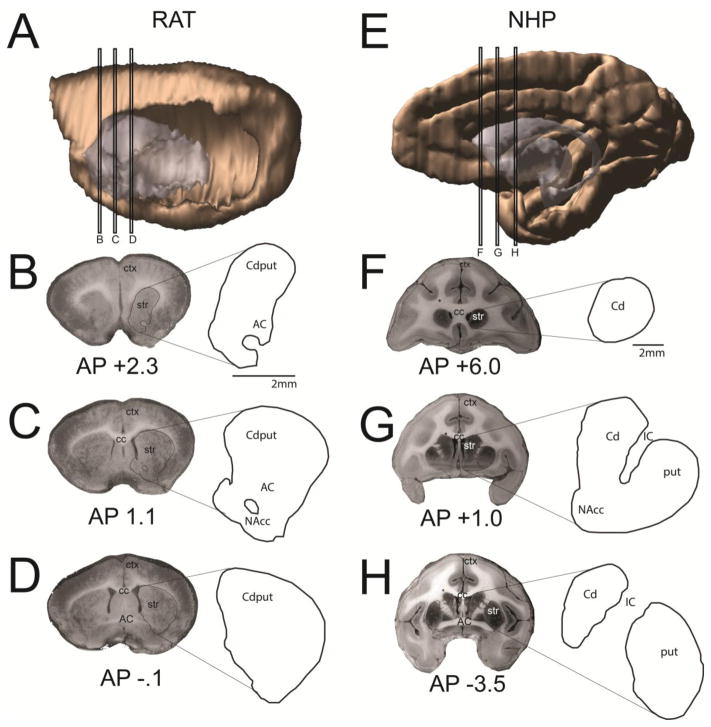
Methods: We first compared the location and extent of each major component of the EPN in rats and macaques. Next, we used anatomic cases with anterograde injections in ACC/OFC to determine the extent to which corticostriatal terminal fields overlapped with these components and with each other.

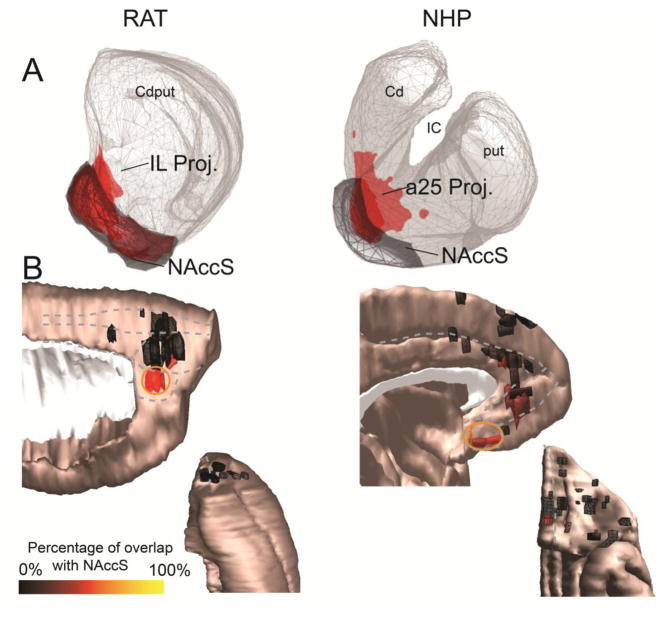
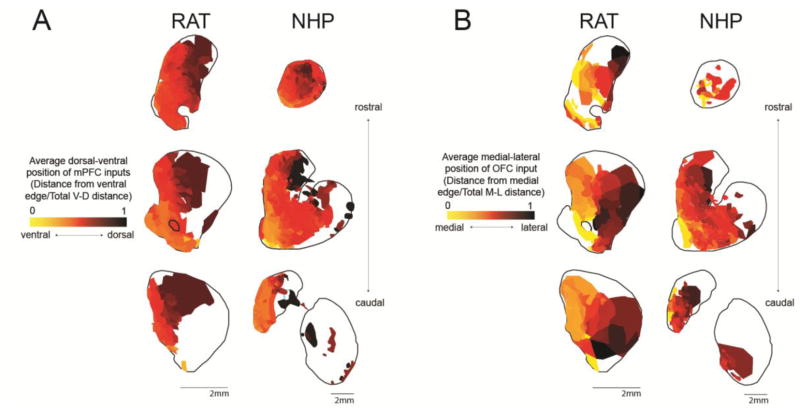
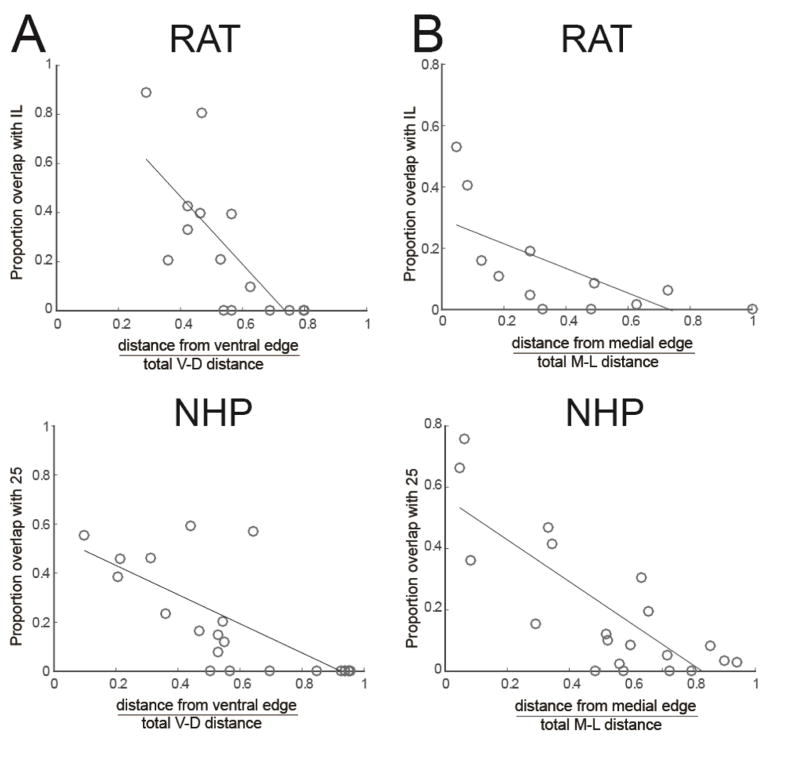
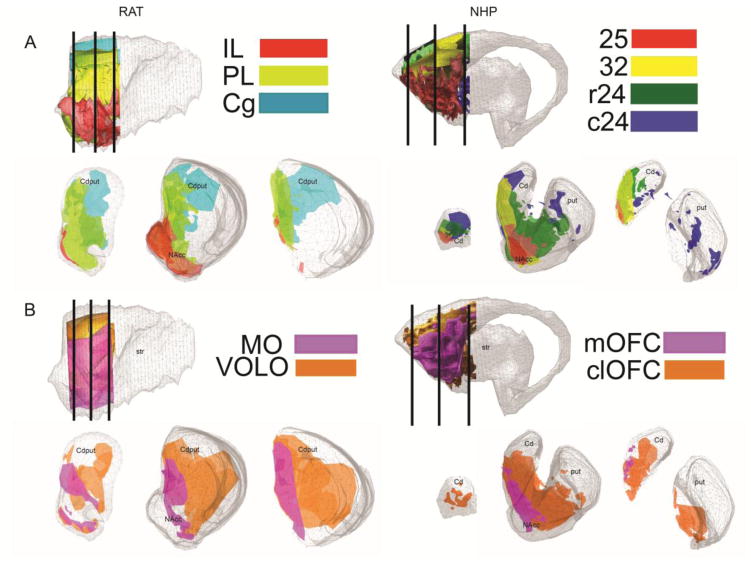
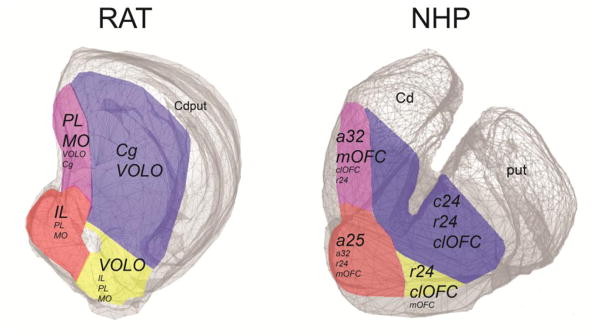
Results: The location and size of each component of the EPN were similar across species, containing projections primarily from infralimbic cortex in rats and area 25 in monkeys. Other ACC/OFC terminals overlapped extensively with infralimbic cortex/area 25 projections, supporting cross-species similarities in OFC topography. However, dorsal ACC had different connectivity profiles across species. These results were used to segment the monkey and rat striata according to ACC/OFC inputs.

Conclusions: Based on connectivity with the EPN, and consistent with prior literature, the infralimbic cortex and area 25 are likely homologues. We also see evidence of OFC homologies. Along with segmenting the striatum and identifying striatal hubs of overlapping inputs, these results help to translate findings between rodent models and human pathology.

Keywords: Cingulate; Homology; Infralimbic; Orbitofrontal; Prefrontal; Prelimbic.


Figures

Figure 1
Figure 1. Injection sites
Injection sites for the rat (left) and NHP (right) are shown in black on the medial (top) and orbital (middle) frontal cortices. Approximate regional boundaries are demarcated with gray dotted lines. As in all figures, the rat brain has been enlarged relative to its actual size in comparison to the NHP brain for comparison purposes. clOFC=central/lateral orbitofrontal cortex; Cg1/2=cingulate areas 1/2; IL=infralimbic cortex; MO=medial orbital cortex; mOFC=medial orbitofrontal cortex; PL=prelimbic cortex; VOLO=ventral and lateral orbital cortex
Figure 2
Figure 2. Striatal reference slices
A–D. Striatal reference slices for the rat A. Sagittal view showing levels from which coronal slices were drawn. B. Rostral striatal reference slice in the rat. C. Central striatal reference slice in the rat. D. Caudal striatal reference slice in the rat. E–H. Striatal reference slices for the NHP E. Sagittal view showing levels from which coronal slices were drawn. F. Rostral striatal reference slice in the NHP. G. Central striatal reference slice in the NHP. H. Caudal striatal reference slice in the NHP. AP=anterior-posterior distance from bregma, estimated from (46, 81); AC=anterior commissure; cc=corpus callosum; Cd=caudate; ctx=cortex; IC=internal capsule; NAcc=nucleus accumbens; put=putamen; str=striatum
Figure 3
Figure 3. The striatal EPN in rats (left) and NHPs (right)
A. The NAccS is shown in gray on the central striatal reference slice. It occupies similar positions (ventral) and areas (10.5% in rats and 10.4% in NHPs) in both species. B. The hippocampal projection zone is shown in olive on the central striatal reference slice. It occupies similar positions (medial NAccS) and areas in both species (4.6% in rats and 3.5% in NHPs). C. The amygdala projection zone is shown in brown on the central striatal reference slice. It occupies similar positions (ventral, but extending dorsally to the NAccS) and areas (25% in rats and 17.2% in NHPs) in both species.
Figure 4
Figure 4. Projections to the shell of the nucleus accumbens from ACC and OFC regions
A. The cortico-striatal projections from the IL (rat, left) and a25 (NHP, right) show substantial overlap with the NAccS (gray) in both species. B. Medial sagittal (top) and orbital (bottom) views of cortical injection sites, colored according to the proportion of the corresponding striatal terminal field that occupies the NAccS. Warmer colors indicate greater overlap with the NAccS. Clear “hot spots” of cortico-striatal connectivity with the NAccS (orange circle) can be observed in the IL cortex (rat, left) and area 25 (NHP, right).
Figure 5
Figure 5. Projections to the hippocampal projection zone from ACC and OFC regions
A. The cortico-striatal projections from the IL (rat, left) and a25 (NHP, right) show substantial overlap with the hippocampal projection zone (olive) in both species. B. Medial sagittal (top) and orbital (bottom) views of cortical injection sites, colored according to the proportion of the corresponding striatal terminal field that occupies the hippocampal projection zone. Warmer colors indicate greater overlap with the hippocampal projection zone. Clear “hot spots” of cortico-striatal connectivity with the hippocampal projection zone can be observed in the IL cortex (rat, left) and area 25 (NHP, right).
Figure 6
Figure 6. Projections to the amgydala projection zone from ACC and OFC regions
A. The cortico-striatal projections from the IL (rat, left) and a25 (NHP, right) show substantial overlap with the amygdala-striatal projection region (brown) in both species. B. Medial sagittal (top) and orbital (bottom) views of cortical injection sites, colored according to the proportion of the corresponding striatal terminal field that occupies the amygdala projection zone. Warmer colors indicate greater overlap with the amygdala projection zone. Clear “hot spots” of cortico-striatal connectivity with the amygdala projection zone can be observed in the IL cortex (rat, left) and a25 (NHP, right).
Figure 7
Figure 7. Striatal projection location is related to cortical position in both species
A. Heat maps show the average ventral-dorsal position of mPFC input to each position in the striatum, at 3 rostral-caudal levels (as shown in Figure 2). Maps were created by averaging the V-D position of every mPFC injection site that resulted in dense terminal field in the specified striatal location. V-D positions were normalized according to the total V-D distance on the medial surface at the coronal slice corresponding to the center of the injection site in question. B. Heat maps show the average medial-lateral position of OFC input to each position in the striatum, at 3 rostral-caudal levels (as shown in Figure 1). Maps were created by averaging the M-L position of every OFC injection site that resulted in dense terminal field in the specified striatal location. M-L positions were normalized according to the total M-L distance on the orbital surface at the coronal slice corresponding to the center of the injection site in question.
Figure 8
Figure 8. Comparable mPFC and OFC-striatal organization across species
A. Proportion of mPFC striatal field overlap (central slice as shown in Figures 2C and 2G) with IL/a25 projection zone decreases with more dorsal injection sites in rats (top) and NHPs (bottom). B. Proportion of OFC striatal field overlap (central slice as shown in Figures 2C/G) with IL/a25 projection zone decreases with more lateral injection sites in rats (top) and NHPs (bottom). Thus, more lateral and dorsal ACC/OFC areas are less integrated with the striatal EPN.
Figure 9
Figure 9. Detailed analyses of individual ACC and OFC areas
A–B: Drawings show the overlapping striatal terminal fields from different frontal cortical cases, grouped by region. Pie charts show proportion of the corresponding striatal terminal field that overlaps with projection zones from the IL/a25 (red), MO/mOFC (purple), VOLO/clOFC (orange), amygdala (brown), and hippocampus (olive), and the NAccS (gray). Numbers inside pie charts indicate the mean proportion of the cortical area’s striatal terminal field overlapping with the striatal zone indicated (central coronal slice, Figure 2C/G). For example, for the pie chart shown at the upper left, the 96% of the average terminal field from IL falls within the amygdala-striatal projection zone, 53% falls within the NAccS, 35% falls within the hippocampal-striatal projection zone, 40% falls within the MO-striatal projection zone, and 16% falls within the VOLO-striatal projection zone.
Figure 10
Figure 10. Rostral vs caudal primate a24 show different striatal projection patterns
A. Upper left shows subdivsions of rostral, middle, and caudal dACC zones in NHP (boundaries indicated by dotted lines). Bottom shows corresponding striatal projections. Rostral and middle a24 terminals span ventral and dorsal striatum (and elsewhere in the paper are combined and described as only “rostral a24”). Caudal primate a24 terminals are mainly located in the dorsal striatum. B. a24 subdivisions used for A. C. The rat Cg striatal projection is shown for comparison purposes (there are no rostral-caudal differences in rat Cg projections).
Figure 11
Figure 11. Striatal projection zones according to identifiable ACC/OFC homologies
A. IL (red), PL (yellow-green), and Cg (teal) projections in rat (left); areas a25 (red), a32 (yellow), rostral 24 (r24, green), and caudal a24 (c24, blue) in NHP (right). B. MO/mOFC (purple) and VOLO/clOFC (orange) projections in rat (left) and NHP (right). For both species, reference slice locations are shown in sagittal slices at upper left, and in Figure 2.
Figure 12
Figure 12. Schematic representation of cross-species striatal segmentation, according to characteristic ACC/OFC projections
Although there are substantial areas of overlap among cortical terminal fields, different striatal segments have unique combinations of ACC/OFC inputs (listed in italics within each segment; dominant ones are in larger font). Within each segment, hubs of unique cortical and subcortical connections can be found.

Comment in

  • Making the Right Connections.
    Lee AT, Sohal VS. Lee AT, et al. Biol Psychiatry. 2016 Oct 1;80(7):502-3. doi: 10.1016/j.biopsych.2016.08.002. Biol Psychiatry. 2016. PMID: 27601338 No abstract available.

References

    1. Mayberg HS, Brannan SK, Mahurin RK, Jerabek PA, Brickman JS, Tekell JL, et al. Cingulate function in depression: a potential predictor of treatment response. Neuroreport. 1997;8:1057–1061. - PubMed
    1. Milad MR, Quirk GJ. Fear extinction as a model for translational neuroscience: ten years of progress. Annu Rev Psychol. 2012;63:129–151. - PMC - PubMed
    1. Volkow ND, Wang GJ, Fowler JS, Tomasi D, Telang F. Addiction: beyond dopamine reward circuitry. Proc Natl Acad Sci U S A. 2011;108:15037–15042. - PMC - PubMed
    1. Haber SN, Heilbronner SR. Translational research in OCD: circuitry and mechanisms. Neuropsychopharmacology. 2013;38:252–253. - PMC - PubMed
    1. Petrides M, Pandya DN. Comparative architectonic analysis of the human and macaque frontal cortex. In: Boller F, Grafman J, editors. Handbook of Neuropsychology. Amsterdam: Elsevier; 1994. pp. 17–58.

Publication types

MeSH terms

LinkOut - more resources