Review
. 2016 Sep:18:66-97.
doi: 10.1016/j.plrev.2016.07.005. Epub 2016 Jul 11.

Mathematical models to characterize early epidemic growth: A review

Affiliations
Review

Mathematical models to characterize early epidemic growth: A review

Gerardo Chowell et al. Phys Life Rev. 2016 Sep.

Abstract

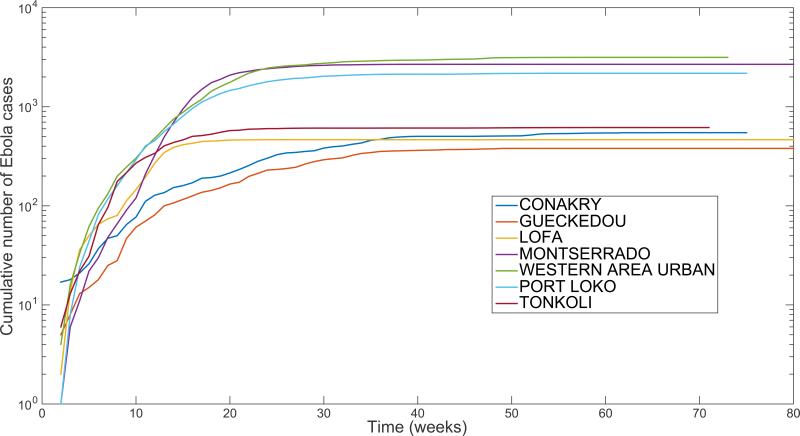
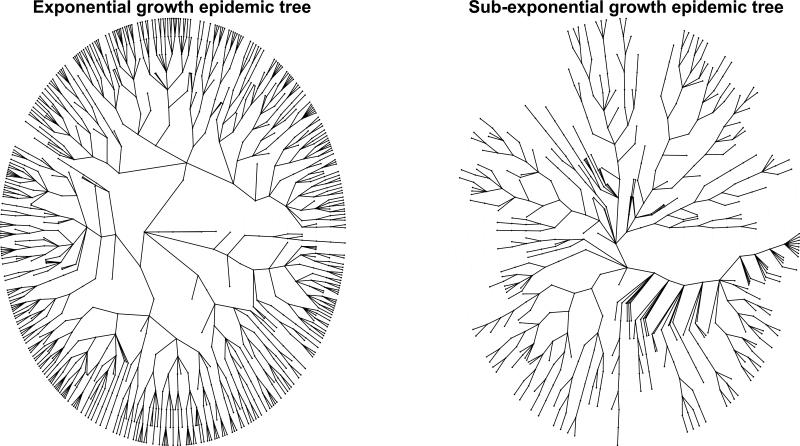
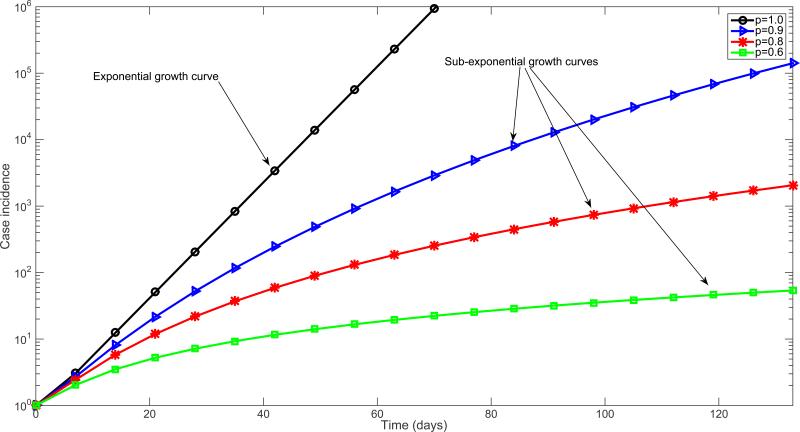
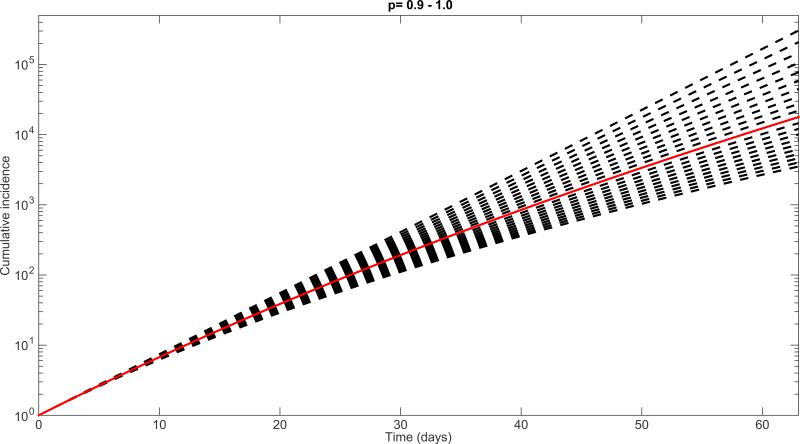
There is a long tradition of using mathematical models to generate insights into the transmission dynamics of infectious diseases and assess the potential impact of different intervention strategies. The increasing use of mathematical models for epidemic forecasting has highlighted the importance of designing reliable models that capture the baseline transmission characteristics of specific pathogens and social contexts. More refined models are needed however, in particular to account for variation in the early growth dynamics of real epidemics and to gain a better understanding of the mechanisms at play. Here, we review recent progress on modeling and characterizing early epidemic growth patterns from infectious disease outbreak data, and survey the types of mathematical formulations that are most useful for capturing a diversity of early epidemic growth profiles, ranging from sub-exponential to exponential growth dynamics. Specifically, we review mathematical models that incorporate spatial details or realistic population mixing structures, including meta-population models, individual-based network models, and simple SIR-type models that incorporate the effects of reactive behavior changes or inhomogeneous mixing. In this process, we also analyze simulation data stemming from detailed large-scale agent-based models previously designed and calibrated to study how realistic social networks and disease transmission characteristics shape early epidemic growth patterns, general transmission dynamics, and control of international disease emergencies such as the 2009 A/H1N1 influenza pandemic and the 2014-2015 Ebola epidemic in West Africa.

Keywords: Epidemic growth patterns; Epidemic modeling; Individual-based model; Reproduction number; Spatial models; Sub-exponential epidemic growth.


Figures

Figure 1
Figure 1
The district level curves of weekly Ebola case counts during the 2014 Ebola epidemic are largely characterized by sub-exponential growth during the early epidemic phase, shown by the strong curvature in the cumulative incidence curves in semi-logarithmic scale.
Figure 2
Figure 2
Schematic epidemic trees characterized by exponential and sub-exponential growth dynamics with12 generations of disease transmission where the index case is located in the center. The epidemic tree with exponential growth dynamics was stochastically generated assuming a mean basic reproduction number of 1.5 in the absence of interventions or behavior changes. The epidemic trees with sub-exponential growth dynamics are characterized by an effective reproduction number that declines towards unity over subsequent generations.
Figure 3
Figure 3
Simulated profiles of epidemic growth supported by the generalized growth model when varying the deceleration of growth parameter p (Equation 1) between 0 and 1. The growth rate parameter r is fixed at 0.2 per day and the initial number of cases, C(0)=1. In semi-logarithmic scale, exponential growth patterns are visually evident if a straight line fits well several consecutive disease generations of the epidemic curve, whereas a strong downward curvature in semi-logarithmic scale is indicative of sub-exponential growth.
Figure 4
Figure 4
Simulations of epidemic growth profiles assessing the sensitivity of the cumulative number of cases to small variations in the deceleration of growth parameter p from p=0.9 to p=1.0 (i.e., exponential growth-dynamics) using the generalized-growth model (Equation 1) while fixing parameter r at 0.2 per day and C(0)=1. The solid red curve denotes the solution curve when p=0.95.
Figure 5
Figure 5
Estimates of p and corresponding 95% confidence intervals derived from various infectious disease outbreaks for a range of diseases including influenza, Ebola, foot-and-mouth disease, HIV/AIDS, plague, measles and smallpox [7]. The vertical dashed line separates Ebola and non-Ebola outbreak estimates.
Figure 6
Figure 6. The 1918 influenza pandemic in San Francisco, California
Representative fits of the generalized-growth model (Equation 1) to an increasing amount of case incidence data during the initial epidemic growth phase (top panels) and the corresponding empirical distribution of the deceleration of growth parameter, p (bottom panel).
Figure 7
Figure 7. The 1948 measles epidemic in London
Representative fits of the generalized-growth model (Equation 1) to an increasing amount of case incidence data during the initial epidemic growth phase (top panels) and the corresponding empirical distribution of the deceleration of growth parameter, p (bottom panel).
Figure 8
Figure 8. The 1905-06 plague epidemic in Bombay, India
Representative fits of the generalized-growth model (Equation 1) to an increasing amount of case incidence data during the initial epidemic growth phase (top panels) and the corresponding empirical distribution of the deceleration of growth parameter, p (bottom panel).
Figure 9
Figure 9. The 2014 Ebola epidemic in Western Area Urban, Sierra Leone
Representative fits of the generalized-growth model (Equation 1) to an increasing amount of case incidence data during the initial epidemic growth phase (top panels) and the corresponding empirical distribution of the deceleration of growth parameter, p (bottom panel).
Figure 10
Figure 10
The impact of assuming exponential growth dynamics when forecasting a near-exponential epidemic growth phase. We first calibrated the exponential growth model to the first 3 generations of disease transmission from 500 stochastic simulations of early growth disease transmission derived using the generalized-growth model where each disease generation is fixed at 5 days, the ‘deceleration of growth’ parameter p (Equation 1) is set at 0.92, 0.94, and 0.96, just slightly below exponential growth, the true growth rate parameter is set at 0.4 per day, and C(0)=1. Next, using the calibrated exponential model for each of the stochastic simulations, we forecasted epidemic growth for the following 3 disease generations for each epidemic realization. The gray curves correspond to the ensemble of epidemic forecasts. The red solid and dashed lines correspond to the median and interquartile range computed from the ensemble of stochastic realizations, respectively. The vertical dashed line separates the model calibration period from the forecasting horizon. The stochastic simulations derived from the “true model” using the generalized-growth equation are shown for reference.
Figure 11
Figure 11
Local epidemics generated using a cross-coupled metapopulation model where 100 local populations are spatially arranged in a 10 × 10 square lattice with periodic boundary conditions. The local dynamics across all patches follow a simple SEIR (susceptible-exposed-infectious-removed) transmission model with a mean latent period of 2 days, a mean infectious period of 3 days, a local basic reproduction number, R0 at 1.5, and a local population size in each patch of 100,000 individuals. A constant transmission between the 4-nearest neighbors is modeled as a fraction ρ of the local transmission rate, which takes values of A) 0.1%, B) 0.5%, C) 1% and D) 5%. For reference, the red dotted line corresponds to the curve of total incidence while the dashed black line corresponds to the solution of the homogenous mixing SEIR model considering the total homogenously-mixed population in a single patch.
Figure 12
Figure 12
Local epidemics generated using a cross-coupled metapopulation model where 100 local populations are spatially arranged in a 10 × 10 square lattice. The local dynamics across all patches follow a simple SEIR (susceptible-exposed-infectious-removed) transmission model with a mean latent period of 2 days, a mean infectious period of 3 days, a local basic reproduction number, R0 at 1.5, and the local population size is 100,000 individuals. The nearest neighbor transmission rate is modeled as a fraction p of the local transmission rate, which takes values of A) 0.1%, B) 0.5%, C) 1% and D) 5%. In addition to nearest-neighbor transmission, transmission with a single hub population is possible with which all patches interact by modeling a hub-transmission rate which is assumed to be fixed at 1% of the nearest neighbor transmission rate.
Figure 13
Figure 13
Characterization of the epidemic growth pattern from the incidence curve of the 2009 A/H1N1 influenza pandemic in Mexico City as provided by GLEAM [66]. Using the generalized-growth model described in Section 2, we found near-exponential growth dynamics during the early phase of the 2009 A/H1N1 influenza pandemic in Mexico City, which is in line with the early dynamics of pandemic influenza described in [7].
Figure 14
Figure 14
Early epidemic growth profiles simulated using the SIR (susceptible-infectious-recovered) model on a 2D square lattice with dimensions 90 × 90 (90,000 individuals) with periodic boundary conditions. The mean of 200 stochastic simulations is shown for lattices with an increasing number of long-range random links as a function of the total population size (0%, 0.1%, 0.2%, 0.3%, 0.4%, 0.5%).
Figure 15
Figure 15
Schematic representation of 2D square lattices where each node is connected to its 4-nearest neighbors with periodic boundary conditions and with the addition of a few random long-range links.
Figure 16
Figure 16
SIR-type early growth simulations on small-world networks constructed using the Watts-Strogatz model in ref. [78] with a low edge rewiring probability parameter (psw) varying from 0.001 to 0.01. The baseline SIR early transmission dynamics on the regular network with node connectivity to the 4 nearest neighbors and without long-range links correspond to a wave of steady disease spread at about 4 cases per day.
Figure 17
Figure 17
Estimation of the deceleration of growth parameter (Equation 1) from the early growth phase of SIR simulations on small-world networks with varying edge rewiring probability ranging from 0.001 to 0.01. Findings indicate that the deceleration of growth parameter displays a bimodal distribution for the low values of the rewiring edge probability (0.001-0.006) with many stochastic curves characterized by almost constant incidence. The bimodal shape vanishes as the edge rewiring probability approaches 0.01 (1% of the network edges are rewired at random according to the Watts-Strogatz network model). That is, the early growth dynamics in the small-world network model quickly approach the exponential growth regime as psw increases.
Figure 18
Figure 18
Characterization of the early epidemic growth pattern from epidemic simulations derived by the detailed individual-level Ebola transmission model developed by Merler et al. [28]. We analyzed 200 stochastic simulations of the early epidemic growth. We found a deceleration of growth parameter p at 0.68 (95% CI: 0.58, 0.75), indicating approximately cubic growth during the first 4-5 generations of disease transmission.
Figure 19
Figure 19
Characterization of the epidemic growth pattern from the best fit of the spatial Ebola model of Kiskowski to the early phase of the Ebola epidemic in Liberia[27]. We estimated the deceleration of growth parameter p at 0.82 (95% CI: 0.72,0.92), which slightly higher than that obtained from the simulations derived from Merler et al's model.
Figure 20
Figure 20
A) Representative profiles of the time-dependent transmission rate β(t), B) the effective reproduction number, Rt for different values of the decline rate parameter q and γ = 1/6, β0 = 0.5 , C) The decline rate parameter q > 0 can be interpreted through the value log(2)q, which is the mean half time to achieve a transmission rate β0(1+ϕ)2, and D) the basic reproduction number as a function of the q parameter. If q = 0, the transmission rate: β(t) = β0 remains at the baseline value and recovers the standard SEIR transmission dynamics with R0=β0γ. Importantly, whenever q > 0 the basic reproduction number, R0, is no longer simply the product of the initial transmission rate β0 and the mean infectious period 1γ because the transmission rate β(t) declines during the duration of the infectious period. In general, the higher the value of q the faster the decline of the transmission rate towards ϕβ0 where ϕ=γβ0 in order to reach an effective reproduction number of 1.0.
Figure 21
Figure 21
Representative profiles of the transmission rate β(t)(A), the effective reproduction number Rt(B), and corresponding simulations of the early epidemic growth phase (C) derived from the SIR modeling framework described in the text (Equations 5) for different values of the 1 decline rate parameter q, β0 = 0.4 and γ=15. The epidemic simulations start with one 5 infectious individual. In semi-logarithmic scale, exponential growth is evident if a straight line fits well several consecutive disease generations of the epidemic curve, whereas a strong downward curvature in semi-logarithmic scale is indicative of sub-exponential growth. Our simulations show that case incidence curves display early sub-exponential growth dynamics even for very low values of q.
Figure 22
Figure 22
Simulations of the early epidemic growth phase derived from the SIR model 1 described by Equations 6 for different values of the power-law scaling parameter α, γ=15, and 5 (A) β0 = 0.4, (B) β0 = 0.6 in a large population size N set at 108. The epidemic simulations start with one infectious individual. In semi-logarithmic scale, exponential growth is evident if a straight line fits well several consecutive disease generations of the epidemic curve, whereas a strong downward curvature in semi-logarithmic scale is indicative of sub-exponential growth. Our simulations show that case incidence curves display early sub-exponential growth dynamics even for values of α slightly below 1.0.
Figure 23
Figure 23
Simulations of the early epidemic growth phase derived from the SIR model based on disease generations described by Equations 7 for different values of the basic reproduction number with a power-law scaling parameter α set at 0.96, just slightly below the homogenous mixing regime (i.e., α = 1), γ=15 and a large population size (N=108). The epidemic simulations start with one infectious individual. Because α < 1, the effective reproduction number according to disease generations, Rg, follows a declining trend towards 1.0. The downward curvature of the case incidence curve in semi-logarithmic scale is also indicative of sub-exponential growth dynamics.
Figure 24
Figure 24
Simulations of the early epidemic growth phase using the SIR model based on disease generations described by Equations 7 for different values of the basic reproduction number with a power-law scaling parameter α set at 1.0 (i.e., homogenous mixing), γ=15, and a large population size (N=108). The epidemic simulations start with one infectious individual. Because α = 1, the effective reproduction number according to disease generations, Rg, remains invariant during the first few disease generations. As expected, exponential growth during the early growth phase is also evident as a straight line fits well several consecutive disease generations of the epidemic curve.

Comment in

Similar articles

Cited by

References

    1. Anderson RM, May RM. Infectious diseases of humans. Oxford University Press; Oxford: 1991.
    1. Heesterbeek H, Anderson RM, Andreasen V, Bansal S, De Angelis D, et al. Modeling infectious disease dynamics in the complex landscape of global health. Science. 2015;347:aaa4339. - PMC - PubMed
    1. Ross R. The Prevention of Malaria. John Murray; London: 1911.
    1. Kermack WO, McKendrick AG. Contributions to the mathematical theory of epidemics: IV. Analysis of experimental epidemics of the virus disease mouse ectromelia. J Hyg (Lond) 1937;37:172–187. - PMC - PubMed
    1. Chowell G, Viboud C, Hyman JM, Simonsen L. The Western Africa ebola virus disease epidemic exhibits both global exponential and local polynomial growth rates. PLoS Curr. 2015;7 - PMC - PubMed