. 2016 Sep 23;291(39):20692-706.
doi: 10.1074/jbc.M116.732719. Epub 2016 Jul 22.

The Microtubule Plus End Tracking Protein TIP150 Interacts with Cortactin to Steer Directional Cell Migration

Affiliations

The Microtubule Plus End Tracking Protein TIP150 Interacts with Cortactin to Steer Directional Cell Migration

Gregory Adams Jr et al. J Biol Chem. .

Abstract

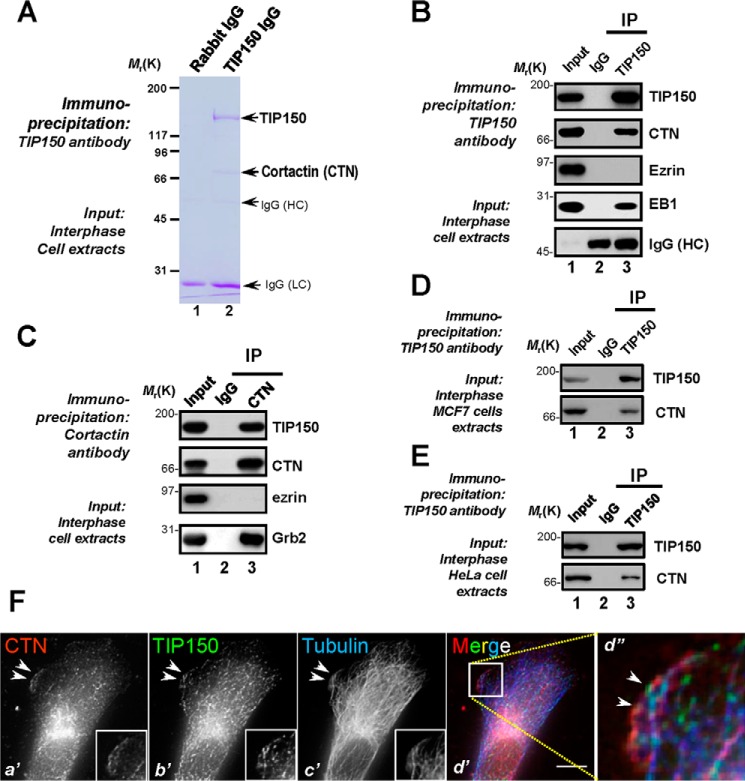
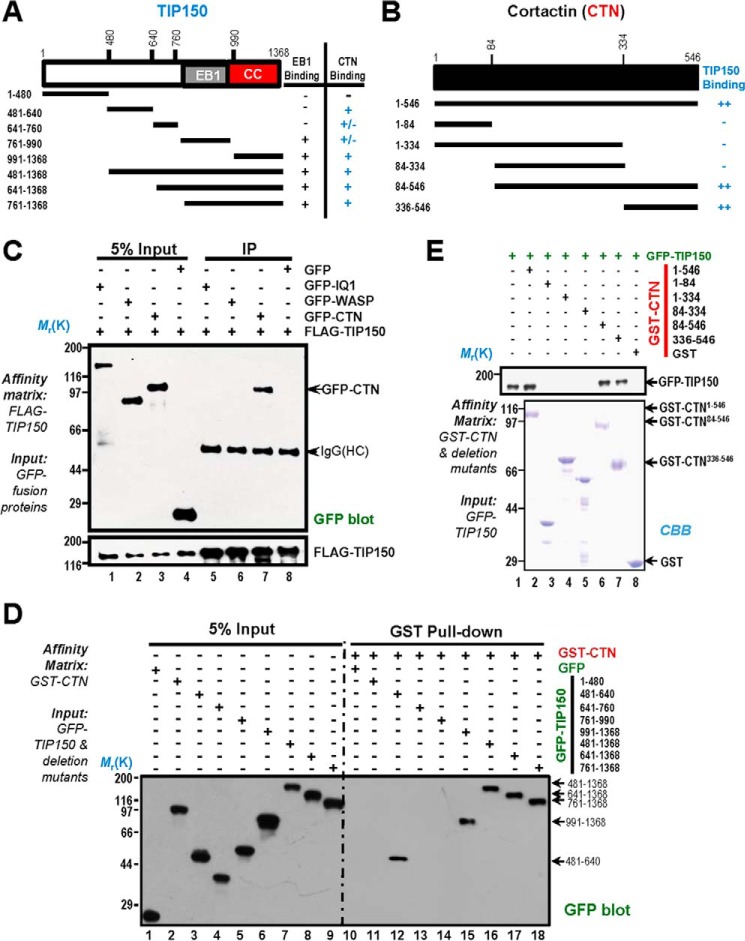
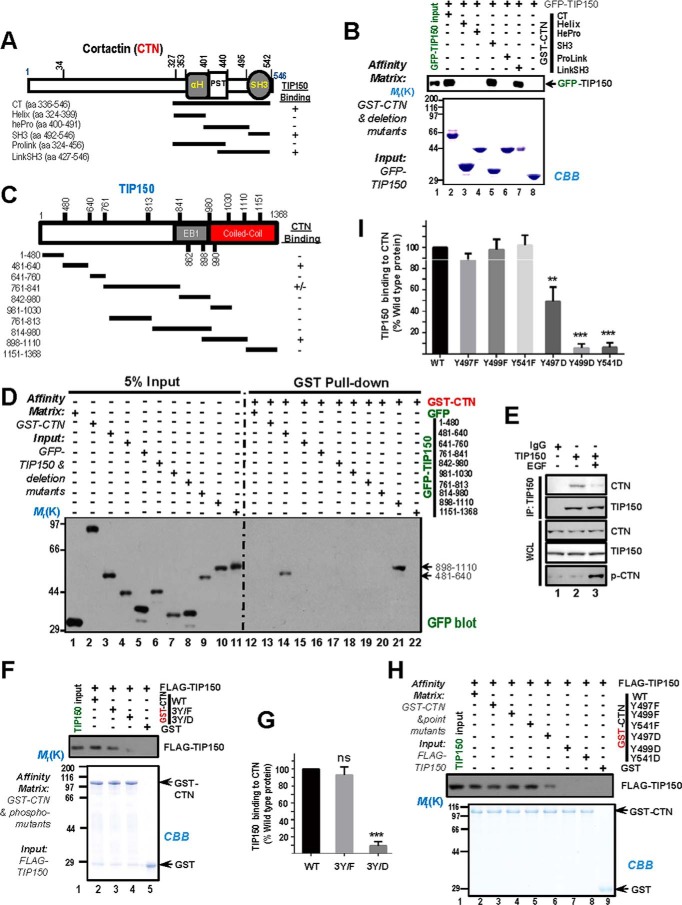
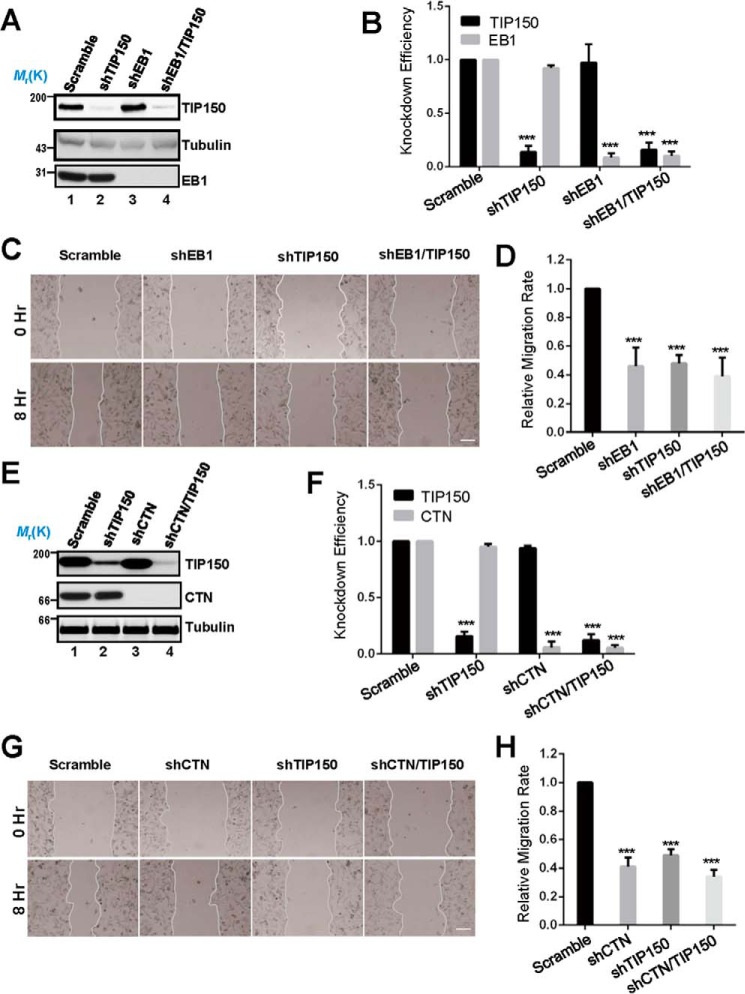
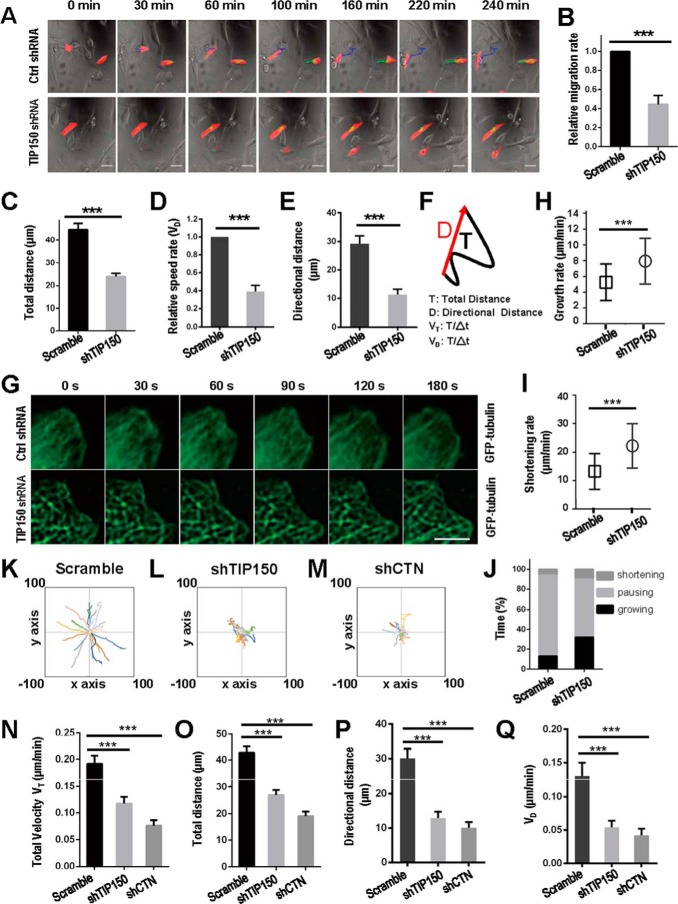
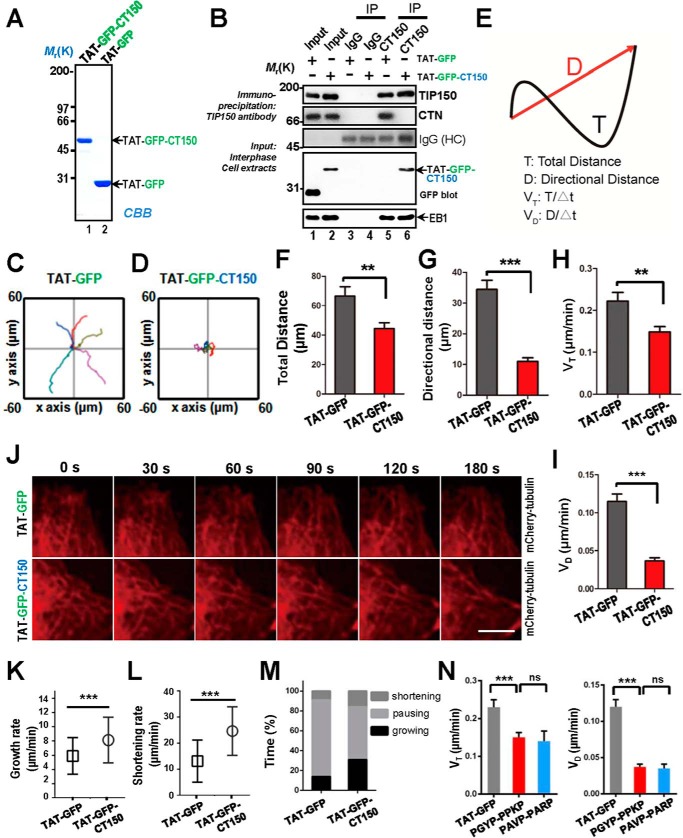
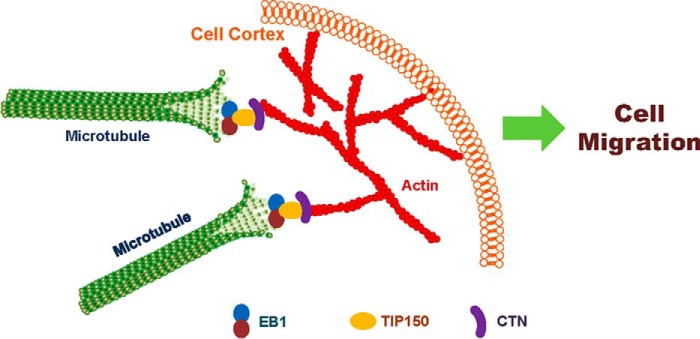
Cell migration is orchestrated by dynamic interactions of microtubules with the plasma membrane cortex. How these interactions facilitate these dynamic processes is still being actively investigated. TIP150 is a newly characterized microtubule plus end tracking protein essential for mitosis and entosis (Ward, T., Wang, M., Liu, X., Wang, Z., Xia, P., Chu, Y., Wang, X., Liu, L., Jiang, K., Yu, H., Yan, M., Wang, J., Hill, D. L., Huang, Y., Zhu, T., and Yao, X. (2013) Regulation of a dynamic interaction between two microtubule-binding proteins, EB1 and TIP150, by the mitotic p300/CBP-associated factor (PCAF) orchestrates kinetochore microtubule plasticity and chromosome stability during mitosis. J. Biol. Chem. 288, 15771-15785; Xia, P., Zhou, J., Song, X., Wu, B., Liu, X., Li, D., Zhang, S., Wang, Z., Yu, H., Ward, T., Zhang, J., Li, Y., Wang, X., Chen, Y., Guo, Z., and Yao, X. (2014) Aurora A orchestrates entosis by regulating a dynamic MCAK-TIP150 interaction. J. Mol. Cell Biol. 6, 240-254). Here we show that TIP150 links dynamic microtubules to steer cell migration by interacting with cortactin. Mechanistically, TIP150 binds to cortactin via its C-terminal tail. Interestingly, the C-terminal TIP150 proline-rich region (CT150) binds to the Src homology 3 domain of cortactin specifically, and such an interaction is negatively regulated by EGF-elicited tyrosine phosphorylation of cortactin. Importantly, suppression of TIP150 or overexpression of phospho-mimicking cortactin inhibits polarized cell migration. In addition, CT150 disrupts the biochemical interaction between TIP150 and cortactin in vitro, and perturbation of the TIP150-cortactin interaction in vivo using a membrane-permeable TAT-CT150 peptide results in an inhibition of directional cell migration. We reason that a dynamic TIP150-cortactin interaction orchestrates directional cell migration via coupling dynamic microtubule plus ends to the cortical cytoskeleton.

Keywords: cell invasion; cell migration; cell motility; cellular regulation; microtubule; microtubule-associated protein (MAP).


Figures

FIGURE 1.
FIGURE 1.
CTN is a novel TIP150-interacting partner at leading edges of migrating cells. A, TIP150 forms a novel complex with CTN in interphase cells. Aliquots of MDA-MB-231 cells were collected by centrifugation and extracted with Triton X-100-containing buffer as described under “Materials and Methods.” Clarified cell lysates were incubated with Sepharose bead affinity matrix covalently coupled with TIP150 antibody and control rabbit IgG, as described under “Materials and Methods.” The beads were washed successively with PBS before elution with 0.2 m glycine (pH 2.3). All samples were separated by SDS-PAGE. HC, heavy chain; LC, light chain. B, TIP150 immunoprecipitates from MDA-MB-231 cells in interphase were immunoblotted with antibodies against TIP150, CTN, ezrin, and EB1. Note that TIP150 immunoprecipitation (IP) brought down CTN and EB1 but not ezrin. C, CTN immunoprecipitates from MDA-MB-231 cells in interphase were immunoblotted with antibodies against TIP150, CTN, ezrin, and Grb2. Note that CTN immunoprecipitation brought down CTN and Grb2 but not ezrin. D, TIP150 immunoprecipitates from MCF7 cells in interphase were immunoblotted with antibodies against TIP150 and CTN. Note that TIP150 immunoprecipitation brought down CTN. E, immunoprecipitation of the endogenous TIP150-CTN protein complex in HeLa cells using TIP150 antibody or preimmune IgG. F, MDA-MB-231 cells were labeled with antibodies against CTN (red), TIP150 (green), and tubulin (blue). Scale bar = 10 μm. Note that the membrane ruffle-like localization of TIP150 is superimposed onto that of CTN, as shown in the magnified montage (d”).
FIGURE 2.
FIGURE 2.
Biochemical characterization reveals a physical link between the TIP150 and CTN. A, schematic of TIP150 truncation mutants. Residue numbers at domain boundaries are indicated. CC, coiled coil. B, schematic of CTN truncation mutants. Residue numbers at domain boundaries are indicated. C, confirmation of the TIP150-CTN interaction. MDA-MB-231 cells transfected with FLAG-TIP150 and GFP-IQGAP, N-WASP, and CTN were lysed and incubated with anti-FLAG M2 affinity matrix. Immunoprecipitates were resolved by SDS-PAGE and detected by immunoblotting with anti-GFP antibody (top) and anti-FLAG antibody (bottom). IP, immunoprecipitation; HC, heavy chain. D, the TIP150 C terminus binds to the CTN in vitro. Purified GST-CTN fusion proteins were used to isolate GFP-TIP150 deletion mutants from HEK293T cell lysates and fractionated by anti-GFP blotting analysis. E, GST-tagged CTN deletion mutants were purified on glutathione beads and used as an affinity matrix for absorbing a full-length GFP-TIP150 protein from HEK293T cells. GST protein-bound agarose beads were used as a negative control. Anti-TIP150 immunoblotting analyses confirmed that the C-terminal of CTN (amino acids 336–546) is responsible for TIP150-binding (top panel, lane 7). CBB, Coomassie Brilliant Blue.
FIGURE 3.
FIGURE 3.
Phosphorylation of CTN in its SH3 domain regulates the CTN-TIP150 interaction. A, schematic of deletion mutants of CTN C-terminal. +, positive; −, negative. aa, amino acids. B, purified GST-CTN and its binding domains (CT, C-terminal; Helix, helical; hePro, helical proline-rich; SH3; ProLink, proline-rich; and LinkSH3) fragments were used to absorb GFP-TIP150 from the HEK293T cell lysates. GST-CTN and its bound materials were resolved by SDS-PAGE followed by Coomassie Brilliant Blue (CBB) staining and immunoblotted with an anti-GFP antibody. C, schematic of TIP150 deletion mutants. +, positive; −, negative. D, purified GST-CTN was used as an affinity matrix to isolate proline-rich mutants of GFP-TIP150 from the lysates of HEK293T cells. Western blotting was performed as described in B. E, serum-starved MDA-MB-231 cells were treated with or without EGF. Endogenous TIP150 was immunoprecipitated, and precipitated endogenous CTN was detected by Western blotting. IP, immunoprecipitation. WCL, whole cell lysate. F, phospho-mutants of purified GST-CTN at tyrosine sites 421, 466, and 482 were used as affinity matrices to isolate FLAG-TIP150 from the lysates of HEK293T cells. Western blotting was performed as described previously. G, the intensity of bands as shown in F was quantified and normalized to that of CTNWT. Data represent mean ± S.E. from three independent experiments. ***, p < 0.001; ns, not significant. H, phospho-mutants of purified GST-CTN were used to absorb FLAG-TIP150 from the HEK293T cell lysates. After washing, proteins bound to agarose beads were analyzed by Coomassie Brilliant Blue staining and Western blotting using an anti-FLAG antibody. I, the intensity of bands as shown in H was quantified and normalized to that of CTNWT. Data represent mean ± S.E. from three independent experiments. **, p < 0.01; ***, p < 0.001.
FIGURE 4.
FIGURE 4.
TIP150 and CTN are essential for EGF-elicited cell migration. A, characterization of the knockdown efficiency of TIP150 shRNA and EB1 shRNA. The protein levels of TIP150 and EB1 were significantly decreased in cells transfected with corresponding shRNAs. B, quantitative analysis of the knockdown efficiency of TIP150 shRNA in A. The data represent mean ± S.E. from three independent experiments. ***, p < 0.001. C, in MDA-MB-231 cells, suppression of either TIP150 or EB1 perturbed directional migration. The cells were treated with the indicated shRNAs for 72 h and were then scratched, followed by visualization with phase-contrast microscopy at the indicated time points. Scale bar = 100 μm. D, relative migration rates in C were calculated and graphed. Statistical significance was evaluated by Student's t test. Data are presented as mean ± S.E. from three independent experiments. ***, p < 0.001. E, knockdown efficiency of CTN shRNA. MDA-MB-231 cells were transfected with the indicated shRNA for 72 h and then subjected to immunoblotting. TIP150 shRNA was used as a control. F, quantitative analysis of the knockdown efficiency of CTN shRNA in E. Data represent mean ± S.E. from three independent experiments. ***, p < 0.001. G, in MDA-MB-231 cells, suppression of CTN or TIP150 caused defects in directional migration. The cells were treated with the indicated shRNAs for 72 h and were then scratched, followed by visualization with phase-contrast microscopy at the indicated time points. Scale bar = 100 μm. H, quantitative analysis of the relative migration velocities of cells toward the opposite side in G. Data are presented as mean ± S.E. from three independent experiments. ***, p < 0.001.
FIGURE 5.
FIGURE 5.
TIP150 and CTN are essential for directional cell movement. A, MDA-MB-231 cells transfected with control or TIP150 shRNA (red) were treated as described under “Materials and Methods,” and images were collected at 10-min intervals. Ctrl, control. B, migration rates of TIP150-supppressed MDA-MB-231 cells were measured, and statistical significance was determined using Student's t test. ***, p < 0.001. C, quantitative analysis measuring total migration distance of control or TIP150 shRNA-treated groups. Data represent mean ± S.E. of 65 cells collected from three independent experiments. Statistical significance was determined by Student's t test. ***, p < 0.001. D, quantitative analysis of relative cell speed. Data represent mean ± S.E. n = 65, respectively. ***, p < 0.001 by t test. E, quantitative analysis of directional distance. Data represent mean ± S.E. n = 65. ***, p < 0.001 by t test. F, visual demonstration of path length. The total distance between starting and ending points (T) and the actual trajectory (D) are indicated. G, TIP150 is required for microtubule plus end stabilization in the region of the cell cortex. Time-lapse images show the microtubule plus end dynamics in TIP150 knockdown cells. MDA-MD-231 cells were co-transfected with GFP-tubulin and control or TIP150 shRNAs for 72 h. Live-cell images were collected at 10-s intervals. Scale bar = 5 μm. H and I, statistical analysis of microtubule growth rate and shortening rate at the cell cortex in F. Data are presented as mean ± S.D. and derived from ∼100 microtubules in 25 cells. ***, p < 0.001 by t test. J, the percentages of growing, pausing, and shortening times microtubules displayed at the cell cortex in F. Data are derived from ∼100 microtubules in 25 cells. K–M, migration tracks of the indicated groups are presented from at least 20 cells. Data were collected from three independent experiments. N, quantitative analysis of total velocity in K–M. Data represent mean ± S.E. from three independent experiments. Statistical significance was determined by Student's t test. ***, p < 0.001. O, quantitative analysis of measured total distance in K–M. ***, p < 0.001 by t test. P, quantitative analysis of directional distance in K–M. Data represent mean ± S.E. from three independent experiments. Statistical significance was determined by Student's t test. ***, p < 0.001. Q, quantitative analysis of measured speed rates in K–M. ***, p < 0.001 by t test.
FIGURE 6.
FIGURE 6.
Perturbation of the TIP150-CTN interaction inhibited cell migration. A, Coomassie Brilliant Blue (CBB) staining of SDS-PAGE gel showed the quality and quantities of the purified TAT-GFP-His6-tagged proteins. Bacteria expressing TAT-GFP-peptide (TAT-GFP-CT150) and TAT-GFP-His6 (TAT-GFP) were purified with nickel-nitrilotriacetic acid affinity chromatography and desalted into L-15. B, TIP150 immunoprecipitates from MDA-MB-231 cells incubated with TAT-GFP or TAT-GFP-CT150 peptide in interphase were immunoblotted with TIP150, CTN, EB1, and GFP antibodies. Nonspecific IgG-coupled beads were used as a control. Note that the EB1-TIP150 interaction was not altered by addition of the TAT-GFP-CT150 peptide but that the endogenous TIP150-CTN interaction was perturbed by addition of the TAT-GFP-CT150 peptide. IP, immunoprecipitation; HC, heavy chain. C and D, MDA-MB-231 cells were treated with the TAT-GFP or TAT-GFP-CT150 peptide for 30 min. The 5-h tracks of five randomly picked cells are presented for each group. E, visual demonstration of path length. The total distance between starting and ending points (T) and the actual trajectory (D) are indicated. F and G, quantitative analyses of total distance and directional distance. Data represent mean ± S.E. n = 35 and 29, respectively. **, p < 0.01; ***, p < 0.001. H and I, quantitative analyses of cell speed and velocity. Data represent mean ± S.E. n = 35 and 29, respectively. **, p < 0.01, ***, p < 0.001. J, the TIP150-CTN interaction is required for microtubule plus end stabilization in the region of the cell cortex. Time-lapse images show the microtubule plus end dynamics in mCherry-tubulin-expressing cells, which were treated with the TAT-GFP or TAT-GFP-CT150 for 30 min, and then live-cell images were collected at 10-s intervals. TAT-GFP-CT150-treated cells show microtubule retraction and bending. Scale bar = 5 μm. K and L, statistical analysis of microtubule growth rate and shortening rate at the cell cortex in J. Data are presented as mean ± S.D. and derived from approximately 100 microtubule bundles from 25 cells. ***, p < 0.001 by t test. M, the percentages of growing, pausing, and shortening times microtubules displayed at the cell cortex in F. Data are derived from ∼100 microtubule bundles from 25 cells. N, MDA-MB-231 cells were treated with the TAT-GFP-CT150 (PGYP-PPKP) or TAT-GFP-CT150 mutant (PAVP-PARP) for 30 min Presented are quantitative analyses of total distance and directional distance for 5 h. Data represent mean ± S.E. n = 36. ns, non-significant. Also presented are quantitative analyses of cell speed and velocity. Data represent mean ± S.E. n = 36.
FIGURE 7.
FIGURE 7.
Proposed working model accounting for the TIP150-CTN interaction in directional cell migration. TIP150 functions as a microtubule plus end stabilizer that interacts with CTN to promote microtubule-actin cortex interaction. EGF stimulation promotes phosphorylation of CTN, which accelerates a dynamic TIP150-CTN interaction at the leading edges of migrating cells for directional movement. Thus, the TIP150-CTN complex serves as a link to orchestrate directional cell migration via coupling dynamic microtubule plus ends with the cell cortex.

References

    1. Chen J., Yao Y., Gong C., Yu F., Su S., Chen J., Liu B., Deng H., Wang F., Lin L., Yao H., Su F., Anderson K. S., Liu Q., Ewen M. E., et al. (2011) CCL18 from tumor-associated macrophages promotes breast cancer metastasis via PITPNM3. Cancer Cell 19, 541–555 - PMC - PubMed
    1. Richardson B. E., and Lehmann R. (2010) Mechanisms guiding primordial germ cell migration: strategies from different organisms. Nat. Rev. Mol. Cell Biol. 11, 37–49 - PMC - PubMed
    1. Cosen-Binker L. I., and Kapus A. (2006) Cortactin: the gray eminence of the cytoskeleton. Physiology 21, 352–361 - PubMed
    1. Murphy D. A., and Courtneidge S. A. (2011) The “ins” and “outs” of podosomes and invadopodia: characteristics, formation and function. Nat. Rev. Mol. Cell Biol. 12, 413–426 - PMC - PubMed
    1. MacGrath S. M., and Koleske A. J. (2012) Cortactin in cell migration and cancer at a glance. J. Cell Sci. 125, 1621–1626 - PMC - PubMed

Publication types

LinkOut - more resources