. 2016 Aug 22;26(16):2090-100.
doi: 10.1016/j.cub.2016.06.030. Epub 2016 Jul 21.

Transient Tissue-Scale Deformation Coordinates Alignment of Planar Cell Polarity Junctions in the Mammalian Skin

Affiliations

Transient Tissue-Scale Deformation Coordinates Alignment of Planar Cell Polarity Junctions in the Mammalian Skin

Wen Yih Aw et al. Curr Biol. .

Abstract

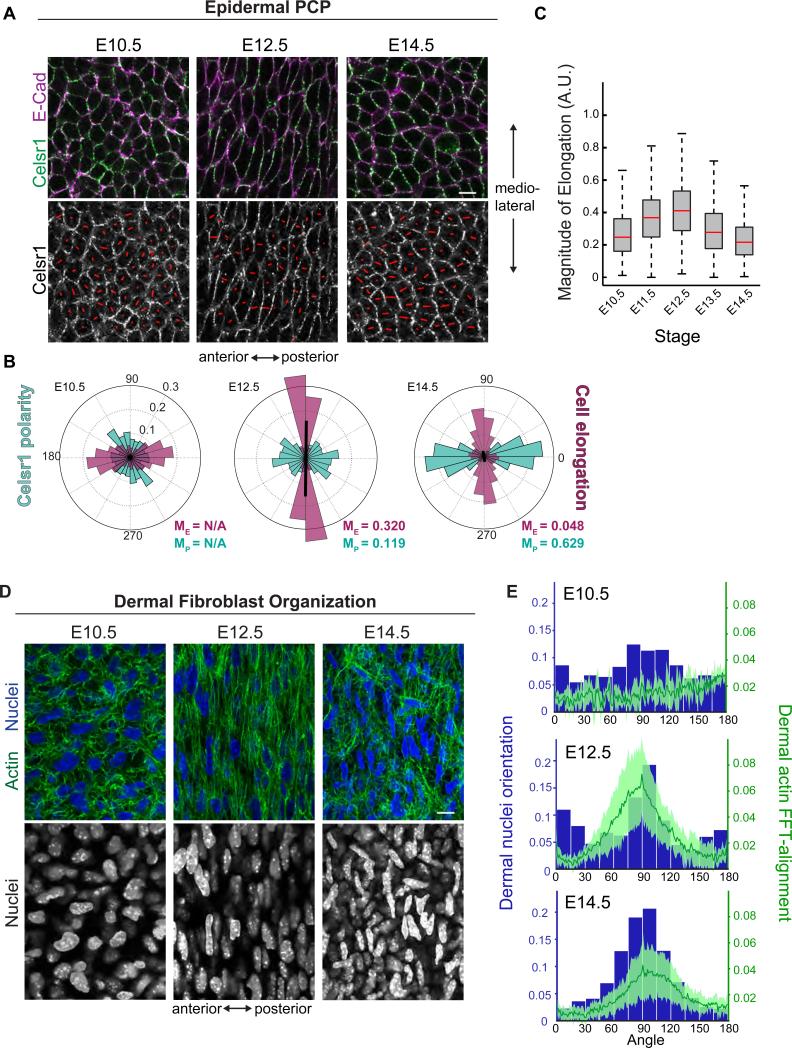
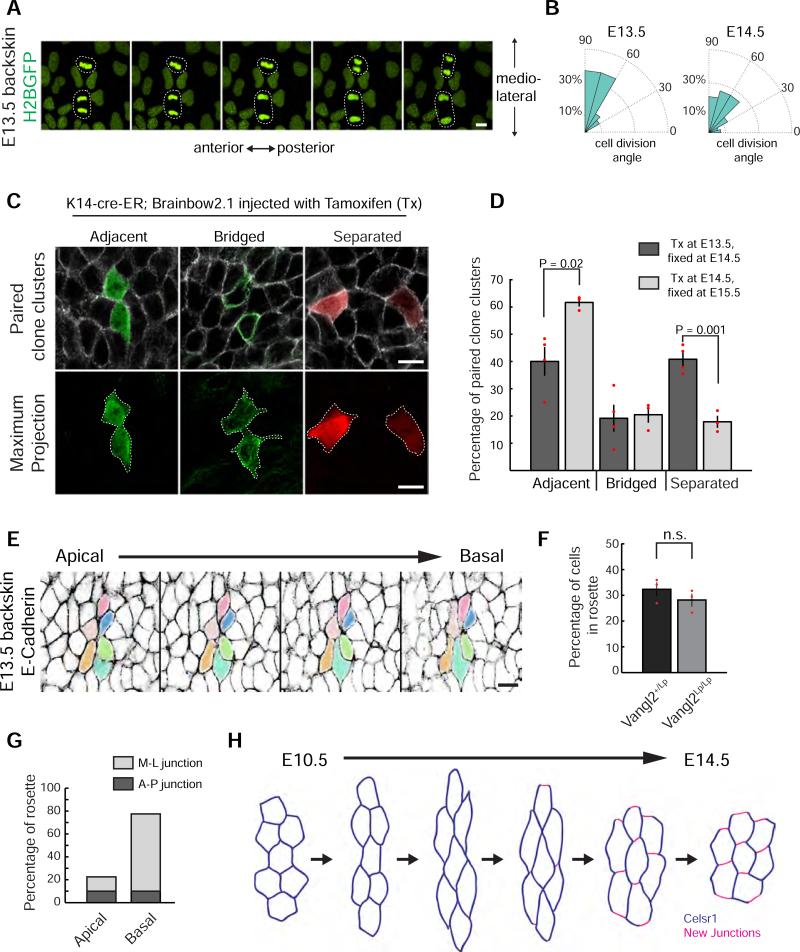
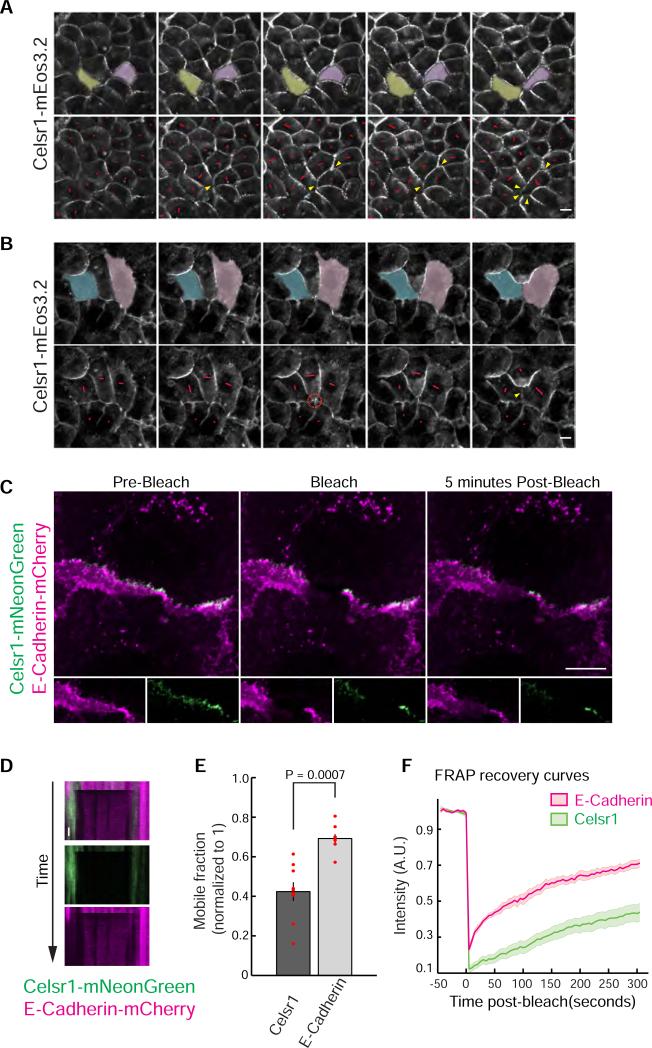
Planar cell polarity (PCP) refers to the collective alignment of polarity along the tissue plane. In skin, the largest mammalian organ, PCP aligns over extremely long distances, but the global cues that orient tissue polarity are unknown. Here, we show that Celsr1 asymmetry arises concomitant with a gradient of tissue deformation oriented along the medial-lateral axis. This uniaxial tissue tension, whose origin remains unknown, transiently transforms basal epithelial cells from initially isotropic and disordered states into highly elongated and aligned morphologies. Reorienting tissue deformation is sufficient to shift the global axis of polarity, suggesting that uniaxial tissue strain can act as a long-range polarizing cue. Observations both in vivo and in vitro suggest that the effect of tissue anisotropy on Celsr1 polarity is not a direct consequence of cell shape but rather reflects the restructuring of cell-cell interfaces during oriented cell divisions and cell rearrangements that serve to relax tissue strain. We demonstrate that cell intercalations remodel intercellular junctions predominantly between the mediolateral interfaces of neighboring cells. This restructuring of the cell surface polarizes Celsr1, which is slow to accumulate at nascent junctions yet stably associates with persistent junctions. We propose that tissue anisotropy globally aligns Celsr1 polarity by creating a directional bias in the formation of new cell interfaces while simultaneously aligning the persistent interfaces at which Celsr1 prefers to accumulate.


Figures

Figure 1
Figure 1
Temporal evolution of Celsr1 polarity. (a) Confocal planar sections through basal layer of whole-mount E10.5 to E14.5 backskin labeled with Celsr1 (green) and E-Cadherin (magenta). In all figures, anterior is left. Red lines within individual cells denote magnitude (length of line) and axis of Celsr1 polarity. (b) Angular distribution of Celsr1 polarity and cell deformation from E10.5 to E14.5 backskin. E10.5, 3 embryos (871 cells); E12.5, 8 embryos (614 cells); E14.5, 13 embryos (7,179 cells). The significance of the angular variation within each stage was assessed using nonparametric permutation test. Statistical significance = p < 0.05 (if p ≥ 0.05, magnitude of average Celsr1 polarity or cell elongation, MP/ME = N/A). (c) Quantification of basal epidermal cell shape anisotropy from E10.5 to E14.5. (d) Whole-mount immunofluorescence of E10.5, E12.5, and E14.5 backskins labeled for F-actin (green) and nuclei (Hoechst, blue) imaged in the dermis. (e) 2D-Fast Fourier Transform was performed to measure the orientation of dermal actin fibers. Radial summation of pixel distribution was plotted between 0 and 180 degrees (anterior-posterior, mean ± standard deviation (s.d.m)). Note that location of the peak corresponds to principal orientation of fiber alignment and the peak height corresponds to overall fibers anisotropy; E10.5, 4 embryos (705 cells); E12.5, 3 embryos (401 cells); E14.5, 11 embryos (2,094 cells). Scale bar, 10 μm. See also Figure S1-S2.
Figure 2
Figure 2
Spatial correlation of Celsr1 polarity with tissue anisotropies. (a) Confocal sections through epidermis and dermis of E14.5 proximal and distal forelimbs. Distribution plots show the orientation of Celsr1 polarity, basal cell elongation, dermal fibroblast orientation and actin alignment. Note the reorientation of Celsr1 polarity and cell alignments from proximal to distal limb regions (n = 3). (b) Distribution of Celsr1 polarity and cell elongation along mediolateral and anteroposterior axes of E13.5 backskins (n = 7). Note that the magnitude of average Celsr1 polarity (MP) increases from lateral to medial. (c) Quantified apical surface area and cell height along mediolateral axis. Cells along the midline are longer and flatter. (d) Lack of correlation between magnitude of Celsr1 polarity and cell elongation on a cell-by-cell basis. n = 7 embryos (850 data-points randomly selected from 5,702 cells). Scale bars, 10 μm. See also Figure S3.
Figure 3
Figure 3
Celsr1 polarity reorients upon exogenous stretch. (a-b) Images of E14.5 backskins labeled for Celsr1 (green) and Actin (magenta) captured 24h after stretching either along mediolateral or anterior-posterior axis. (c-d) Distribution plots of basal cell elongation and Celsr1 polarity. (e-f) Compass plots show the average orientation of Celsr1 polarity from individual fields of view. The length of each line defines average magnitude of polarity (per field of view). Paired samples are plotted in the same color. (g) Experimental design for stretching explants. (h) Quantification of dermal actin alignments in stretched E14.5 backskins (mean ± s.d.m). Scale bar, 20 μm in (a); 10 μm in inset. See also Figure S4.
Figure 4
Figure 4
Oriented division and cell rearrangement during and after the establishment of Celsr1 polarity. (a) Time-lapse images showing examples of oriented divisions along mediolateral axis at E13.5. (b) Quantification of division angle normalized to anterior-posterior axis extracted from fixed samples; E13.5, n = 3 (70 divisions). E14.5, n = 3 (69 divisions). (c) Random generation of paired clone clusters based on recombination of Brainbow reporter activated by low doses of Tamoxifen (Tx) injected either at E13.5 or E14.5. Clones are classified as adjacent, bridged, and separated. (d) Percentage of clones at E14.5 and E15.5 (mean ± s.e.m); unpaired t-test; E14.5, n = 4 (97 clones). E15.5, n = 3 (122 clones) (e) Confocal images and outlines of epithelial cells from apical to basal ends in E13.5 backskin. Note that adjacent cells at the apical surface became separated at the basal end and vice versa. (f) Fraction of cells participating in multicellular rosette structures in E14.5 control littermates and Vangl2Lp/Lp backskins. Data are represented as mean± s.d.m. (Paired t-test, n = 3 embryos, 1,698 cells analyzed in control and 2,100 cells analyzed in Vangl2Lp/Lp) (g) Analysis of rosette position and orientation of evolving cell boundary within rosette structure at E13.5, n = 40 rosettes (7 embryos) (h) Schematic illustrates one potential consequence of neighbor exchange, driven by anisotropic cell deformation, on Celsr1 polarity. Scale bars, 10 μm.
Figure 5
Figure 5
Spontaneous emergence of local polarity in vitro. (a) Single confocal section of a representative ALI culture labeled with Celsr1 (cyan) and Phalloidin (magenta). Scale bar, 50μm. (b) Angular distributions for Celsr1 polarity in vitro shown with and without normalization.For normalization, we set the elongation angles to 0°/180° (magenta line) and plotted the corresponding Celsr1 polarities (white line). Note that Celsr1 polarity correlates with cell elongation in vitro. n = 1,919 cells. (c) Lack of correlation between magnitude of Celsr1 polarity and elongation at individual cell level. (d) Schematic for calculation of local polarity. Polarity tensors for each cell are averaged with those from adjacent cells. Local polarity is represented by mean of the magnitudes from all neighbor comparisons (Mp local). Permutation tests are performed to determine percentile of calculated real-neighbor Mp local with that of 100,000 random comparisons of the same cells. (e) Violin plots showing distribution of permutated neighbor comparisons per field of view. Mp local from corresponding real-neighbor comparisons are overlaid (red line, s.e.m in black). (f) Global Mp per field of view is compared to corresponding local Mp and average Mp of permutation. P values are determined based on comparisons between collective means (white dots); n=8 fields of view; 1,919 cells.
Figure 6
Figure 6
Local Celsr1 polarity emerges and reorients upon junctional remodeling. (a) Time-lapse images of a Celsr1-mEos3.2 organotypic culture. Red lines show nematics of Celsr1 polarity. Note that starting from a mostly uniform distribution of Celsr1, Celsr1 polarity emerges as cell forms new junctions (arrowhead) with neighboring cells. (b) Time-lapse imaging of Celsr1-mEos3.2 organotypic culture shows a rearrangement of Celsr1 polarity when rosette resolves. Red lines highlight vertices where 5 or more cells converge into a point. Arrowhead highlights the new junction. (c) Representative images of FRAP on Celsr1-mNeonGreen and E-Cadherin-mCherry junctions. Fluorescence recovery was analyzed in the surrounding region. Arrowheads highlight bleached regions. (d) Kymograph of Celsr1 and E-Cadherin recovery after photobleaching. (e) Mobile fraction plots comparing Celsr1 and E-Cadherin junctions. (unpaired t-test, n = 9 cells) (f) FRAP curve of Celsr1 (red) and E-Cadherin (green) junctions. Insets and kymograph magnified for clarity. Scale bars, 10 μm. See also Movie S1-3.

References

    1. Goodrich LV, Strutt D. Principles of planar polarity in animal development. Development. 2011;138:1877–1892. - PMC - PubMed
    1. Vladar EK, Antic D, Axelrod JD. Planar cell polarity signaling: the developing cell's compass. Cold Spring Harb Perspect Biol. 2009;1:a002964. - PMC - PubMed
    1. Simons M, Mlodzik M. Planar cell polarity signaling: from fly development to human disease. Annu Rev Genet. 2008;42:517–540. - PMC - PubMed
    1. Devenport D. The cell biology of planar cell polarity. J Cell Biol. 2014;207:171–179. - PMC - PubMed
    1. Shimada Y, Usui T, Yanagawa S, Takeichi M, Uemura T. Asymmetric colocalization of Flamingo, a seven-pass transmembrane cadherin, and Dishevelled in planar cell polarization. Curr Biol. 2001;11:859–863. - PubMed

Publication types

LinkOut - more resources