. 2016 Aug 8;30(2):229-242.
doi: 10.1016/j.ccell.2016.06.004. Epub 2016 Jul 21.

PDK1-SGK1 Signaling Sustains AKT-Independent mTORC1 Activation and Confers Resistance to PI3Kα Inhibition

Affiliations

PDK1-SGK1 Signaling Sustains AKT-Independent mTORC1 Activation and Confers Resistance to PI3Kα Inhibition

Pau Castel et al. Cancer Cell. .

Abstract

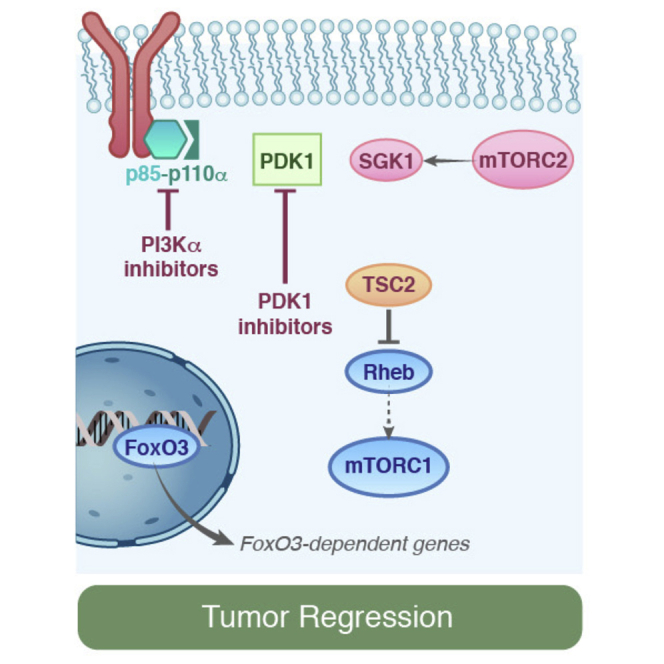
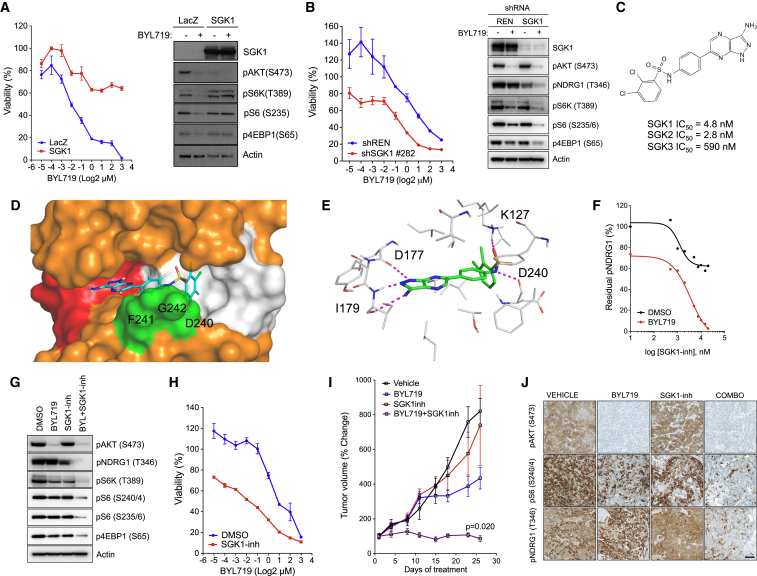
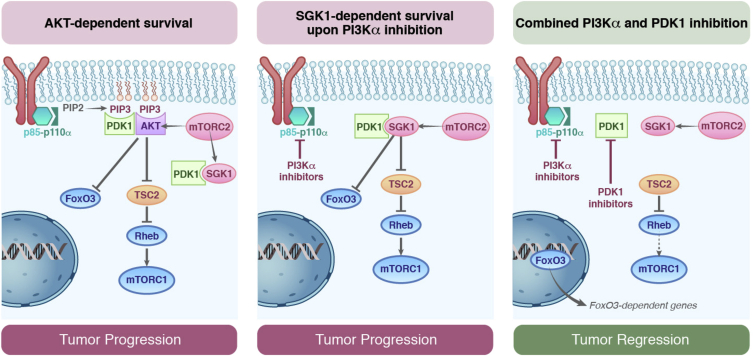
PIK3CA, which encodes the p110α subunit of PI3K, is frequently mutated and oncogenic in breast cancer. PI3Kα inhibitors are in clinical development and despite promising early clinical activity, intrinsic resistance is frequent among patients. We have previously reported that residual downstream mTORC1 activity upon treatment with PI3Kα inhibitors drives resistance to these agents. However, the mechanism underlying this phenotype is not fully understood. Here we show that in cancer cells resistant to PI3Kα inhibition, PDK1 blockade restores sensitivity to these therapies. SGK1, which is activated by PDK1, contributes to the maintenance of residual mTORC1 activity through direct phosphorylation and inhibition of TSC2. Targeting either PDK1 or SGK1 prevents mTORC1 activation, restoring the antitumoral effects of PI3Kα inhibition in resistant cells.


Figures

None
Graphical abstract
Figure 1
Figure 1
PDK1 Inhibition Sensitizes Resistant Cells to BYL719 (A) Dose-response curves from HCC1954 cells transduced with shGFP and shPDK1 and treated with BYL719 for 6 days. (B) Western blot comparing cells from (A) treated with BYL719 (1 μM) for 4 hr. (C) PARP western blot in cells transduced with shGFP and shPDK1 and treated with BYL719 (1 μM) for 24 hr. (D) Caspase 3/7 DEVDase activity of HCC1954 shGFP and shPDK1 cells treated with BYL719 (1 μM) for 12 hr in the presence or absence of caspase inhibitor zVAD-fmk (20 μM). Staurosporine was used as a positive control (1 μM; 4 hr). (E) HCC1954 shGFP and shPDK1 xenografts treated with vehicle or BYL719 (n = 10/arm). (F) IHC analysis of tumors from (E) collected at the end of the experiment after 4 hr of the last treatment. Scale bar, 100 μm. (G) Dose-response curves from HCC1954 cells treated with BYL719 in the presence or absence of GSK2334470 (1 μM) over 6 days. (H) Western blot comparing HCC1954 cells treated with BYL719 (1 μM), GSK2334470 (1 μM), or the combination of both agents for 4 hr. (I) Western blot of PARP in cells treated for 24 hr. (J) Caspase 3/7 DEVDase activity of lysates from HCC1954 cells treated with BYL719 (1 μM), GSK2334470 (1 μM), or the combination of both agents for 12 hr in the presence or absence of caspase inhibitor zVAD-fmk (20 μM). Staurosporine was used as a positive control (1 μM, 4 hr). (K) HCC1954 xenografts treated with vehicle, BYL719 (25 mg kg−1), GSK2334470 (100 mg kg−1), or the combination of both agents (n = 10/arm). (L) IHC analysis of tumors from (K) collected at the end of the experiment after 4 hr of the last treatment. Scale bar, 100 μm. p Values were calculated using Student's t test. Error bars denote ±SEM. See also Figures S1 and S2.
Figure 2
Figure 2
FOXO Activation upon PDK1 and PI3Kα Inhibition (A) Changes in the top 200 differentially expressed genes in HCC1954 and JIMT1 cells treated with DMSO, BYL719 (1 μM), GSK2334470 (1 μM), or the combination of both agents for 4 hr. Gene upregulation is in red and gene downregulation is in green. (B) Enrichment plot for the FOXO3 signature in HCC1954 cells. NES, normalized enrichment score. (C) Heatmap showing changes in expression of FOXO3 targets in HCC1954 and JIMT1 cells. (D) mRNA expression in HCC1954 cells treated with DMSO, BYL719 (1 μM), GSK2334470 (1 μM), or the combination of both agents for 4 hr. (E) Representative images of FOXO3 immunofluorescence (green) in HCC1954 cells treated with DMSO, BYL719 (1 μM), GSK2334470 (1 μM), or the combination of both agents for 4 hr. Nuclei are shown in blue (DAPI). Scale bar, 25 μm. (F) Western blot analysis of FOXO1/3 phosphorylation (T24/T32) in HCC1954 and JIMT1 cells treated with DMSO, BYL719 (1 μM), GSK2334470 (1 μM), or the combination of both agents for 4 hr. (G) Luciferase reporter assay in HCC1954 cells stably transduced with the FOXO consensus motif reporter construct treated as indicated for 12 hr. RLU, relative light units. (H) ChIP-qPCR assay of FOXO3A binding at TNFSF10A and IRS2 promoters in HCC1954 cells treated as indicated in (F). p Values were calculated using Student's t test. Error bars denote ±SEM. See also Figure S3.
Figure 3
Figure 3
SGK1 Upregulation in BYL719-Resistant Cell Lines (A) SGK1 mRNA levels in breast cancer cell lines sensitive or resistant to BYL719 (n = 27). Box indicates the median and the interquartile range, and whiskers represent minimum and maximum. (B) SGK1 mRNA levels in a panel of PIK3CA-mutant breast cancer cell lines sensitive or resistant to BYL719. (C) Western blot analysis of SGK1, SGK2, SGK3, and phosphorylated NDRG1 in a panel of PIK3CA-mutant breast cancer cell lines. Arrowheads indicate the SGK1 isoforms. (D) Representative images of phosphorylated NDRG1 (T346) IHC in breast cancer tumors and quantification of the stainings observed in a cohort of 273 breast cancer cases. (E) Summary of the median number of days of progression-free survival (PFS) and the number of patients experiencing progression of disease (POD) as best response according to RECIST criteria in association with SGK1 mRNA levels and positivity to pNDRG1 staining by IHC. (F) Waterfall plot showing changes in tumor size of the patients included in the study. Heatmap represents the SGK1 mRNA levels for each tumor sample. (G) Western blot for NDRG1 and phosphorylated NDRG1 (T346) in BYL719-sensitive and -resistant breast cancer cell lines treated with BYL719 (1 μM) for 4 hr. (H) Western blot of phosphorylated NDRG1 (T346) in resistant cells treated with DMSO, BYL719 (1 μM), GSK2334470 (1 μM), or the combination of both agents for 4 hr. (I) Endogenous kinase assay for SGK1 and AKT in HCC1954 cells treated with DMSO, BYL719 (1 μM), GSK2334470 (1 μM), or the combination of both agents for 4 hr. p Values were calculated using Student's t test. Error bars denote ±SEM. See also Figure S4.
Figure 4
Figure 4
SGK1 Inhibitor Sensitizes Resistant Cells to BYL719 (A) (Left) Dose-response curves from MDA-MB-361 cells transduced with pLenti7.3-LacZ or pLenti7.3-SGK1 (Δ60, S422D) constructs and treated with increasing concentrations of BYL719 for 6 days. (Right) Western blot analysis of LacZ and SGK1 transduced MDA-MB-361 cells treated with BYL719 (1 μM) for 4 hr. (B) (Left) Growth curves of HCC1954 cells stably expressing doxycycline-inducible control (REN) or SGK1 knockdown treated with increasing concentrations of BYL719 for 6 days. (Right) Western blot analysis of GFP-sorted control (REN) and SGK1 shRNA cells treated with BYL719 (1 μM) for 4 hr. (C) Chemical structure of SGK1-inh and in vitro SGK1 kinase activity assay in the presence of increasing concentrations of SGK1-inh. IC50 for SGK1, SGK2, and SGK3 are indicated. (D) Docking overview of SGK1-inh in the DFG-out conformation of SGK1. The hinge region is colored in red, the DFG motif in green, the “allosteric” hydrophobic cavity that results from the DFG flip in grey, and the rest of the kinase in orange. The DFG motif amino acids are indicated (D240, F241, and G242). (E) Detailed residues that mediate the interaction between SGK1-inh and the inactive conformation of SGK1. Hydrogen bonds are shown as purple dotted lines. (F) Western blot quantification of NDRG1 phosphorylation (T346) in HCC1954 cells treated with increasing concentrations of SGK1-inh for 4 hr in the absence or presence of BYL719 (1 μM). (G) Western blot analysis of HCC1954 cells treated with BYL719 (1 μM), SGK1-inh (10 μM), or both agents for 4 hr. (H) Dose-response curves from HCC1954 cells treated with BYL719 for 6 days in the absence or presence of SGK1-inh. (I) HCC1954 xenograft treated with vehicle, BYL719 (25 mg kg−1), SGK1-inh (50 mg kg−1), or the combination of both agents (n = 10/arm). (J) IHC analysis of tumors from (K) collected at the end of the experiment 4 hr after the last dosage. Scale bar, 100 μm. p Values were calculated using Student's t test. Error bars denote ±SEM. See also Figure S5.
Figure 5
Figure 5
SGK1 Interacts with and Phosphorylates TSC2 (A) Co-immunoprecipitation assay in 293T cells ectopically express the indicated proteins. (B) Representative efficiency images from the FRET experiment performed in HeLa cells, with the constructs indicated above. Scale bar, 5 μm. Quantification of FRET efficiency dots is shown on the right. ROI, region of interest. (C) Co-immunoprecipitation (IP) of endogenous SGK1 and TSC2 in JIMT1 cells. IgG, immunoglobulin G. (D) Co-immunoprecipitation assay in 293T cells between FLAG-SGK1 and truncation mutants of HA-TSC2. Asterisk indicates IgG. Truncation TSC2 mutants are shown schematically at the top. Domains: LZ, leucine zipper; CC, coiled coil; GAP, GTPase activation protein. (E) In vitro kinase assay using recombinant His-SGK1 and immunoprecipitated FLAG-TSC2 from 293T cells as a substrate (2 μM MK2206, 1 hr). (F) Quantification of the phosphorylated site identified using liquid chromatography-MS/MS in the absence or presence of recombinant SGK1. Schematic view and amino acid sequence of the predicted SGK1 phosphorylation sites in TSC2 are shown at the top. (G) In vitro kinase assay using recombinant His-SGK1 and immunoprecipitated and dephosphorylated FLAG-TSC2 WT or 6A as a substrate. (H) Western blot of phosphorylated TSC2 (S939) in HCC1954 and JIMT1 cells treated with DMSO, BYL719 (1 μM), GSK2334470 (1 μM), SGK1-inh (10 μM), or the combination of both agents for 4 hr. p Values were calculated using Student's t test. Error bars denote ±SEM. See also Figure S6.
Figure 6
Figure 6
Proposed Model of PI3Kα Resistance in SGK1-Expressing Cells PIK3CA-mutant breast tumors depend on the PI3K pathway, which mainly signals through AKT. AKT phosphorylates and inhibits FOXO3 and TSC2, promoting mTORC1 activity and tumor progression (left panel). In the presence of PI3Kα inhibitors, PIP3 levels in the plasma membrane are negligible and AKT cannot be activated. High SGK1 cells become resistant to PI3Kα inhibitors, as SGK1 is not fully inhibited in the presence of these therapies, supporting FOXO3 and TSC2 phosphorylation, which promotes mTORC1 activity and tumor progression (middle panel). When SGK1 expressing cells are treated with PI3Kα and PDK1 inhibitors, both AKT and SGK1 are inhibited, inducing tumor regression as a result of FOXO3 activation and mTORC1 inhibition (right panel).

References

    1. Alessi D.R., James S.R., Downes C.P., Holmes A.B., Gaffney P.R., Reese C.B., Cohen P. Characterization of a 3-phosphoinositide-dependent protein kinase which phosphorylates and activates protein kinase Balpha. Curr. Biol. 1997;7:261–269. - PubMed
    1. Alessi D.R., Pearce L.R., Garcia-Martinez J.M. New insights into mTOR signaling: mTORC2 and beyond. Sci. Signal. 2009;2:pe27. - PubMed
    1. Arencibia J.M., Pastor-Flores D., Bauer A.F., Schulze J.O., Biondi R.M. AGC protein kinases: from structural mechanism of regulation to allosteric drug development for the treatment of human diseases. Biochim. Biophys. Acta. 2013;1834:1302–1321. - PubMed
    1. Biondi R.M., Kieloch A., Currie R.A., Deak M., Alessi D.R. The PIF-binding pocket in PDK1 is essential for activation of S6K and SGK, but not PKB. EMBO J. 2001;20:4380–4390. - PMC - PubMed
    1. Brunet A., Bonni A., Zigmond M.J., Lin M.Z., Juo P., Hu L.S., Anderson M.J., Arden K.C., Blenis J., Greenberg M.E. Akt promotes cell survival by phosphorylating and inhibiting a Forkhead transcription factor. Cell. 1999;96:857–868. - PubMed

MeSH terms

Substances