. 2016 Sep 13;24(3):389-401.
doi: 10.1016/j.cmet.2016.06.020. Epub 2016 Jul 21.

Beta Cell Hubs Dictate Pancreatic Islet Responses to Glucose

Affiliations

Beta Cell Hubs Dictate Pancreatic Islet Responses to Glucose

Natalie R Johnston et al. Cell Metab. .

Abstract

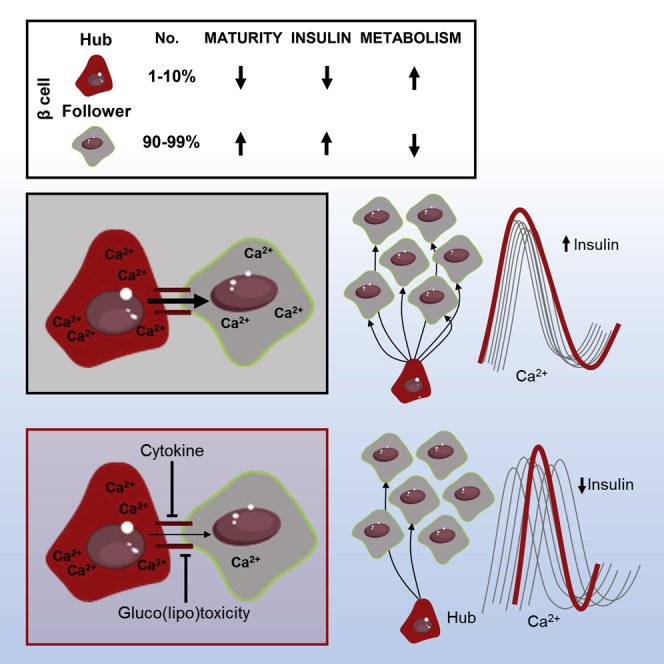
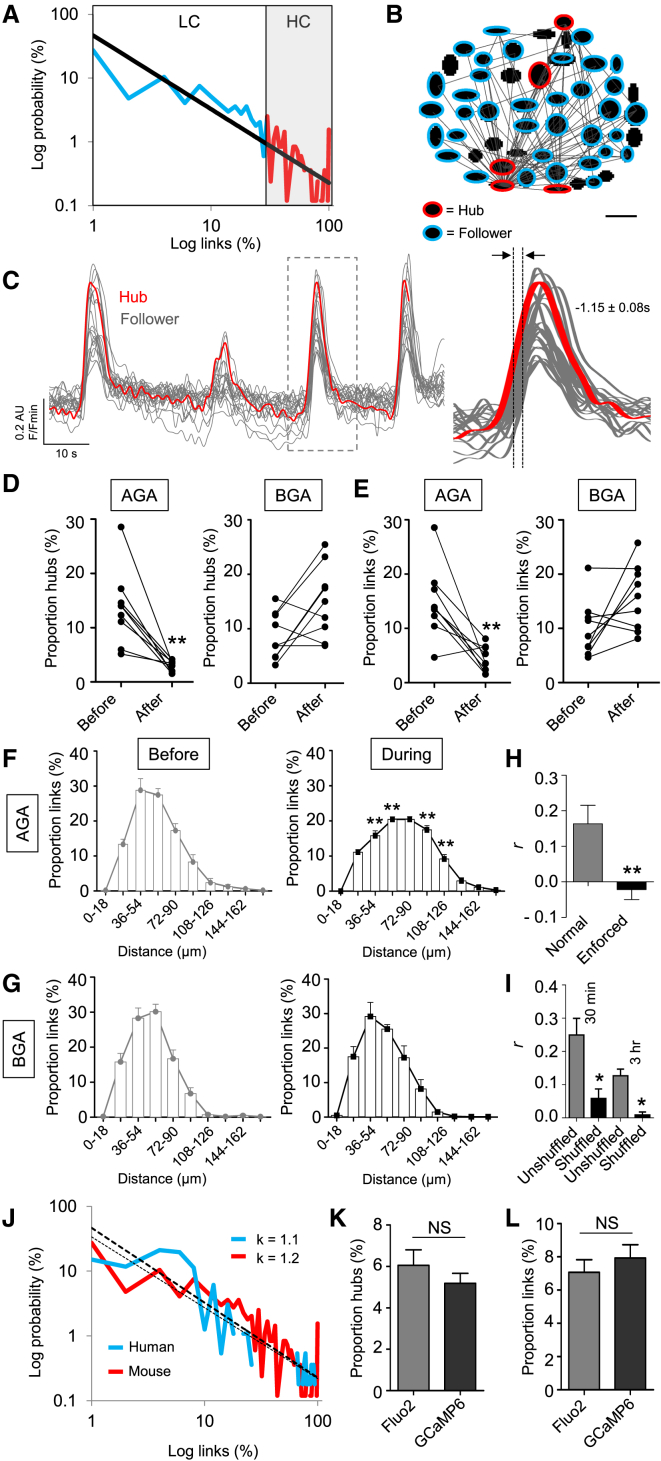
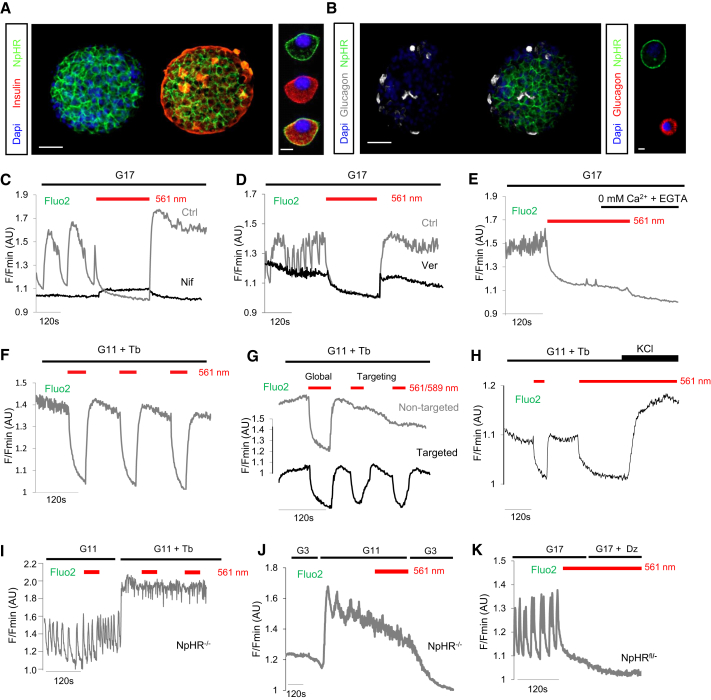
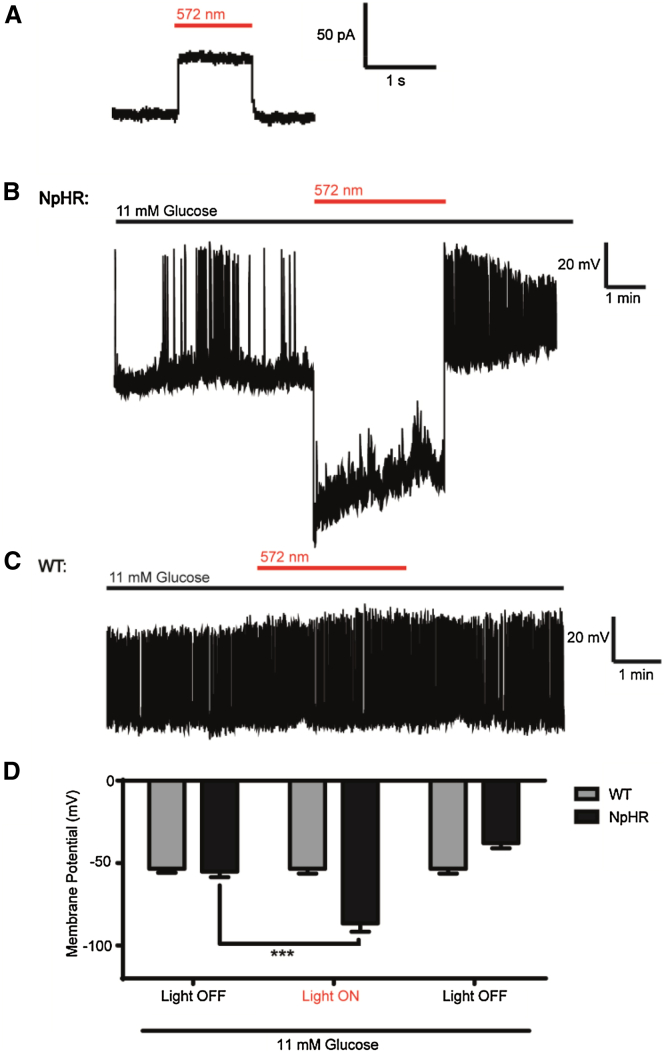
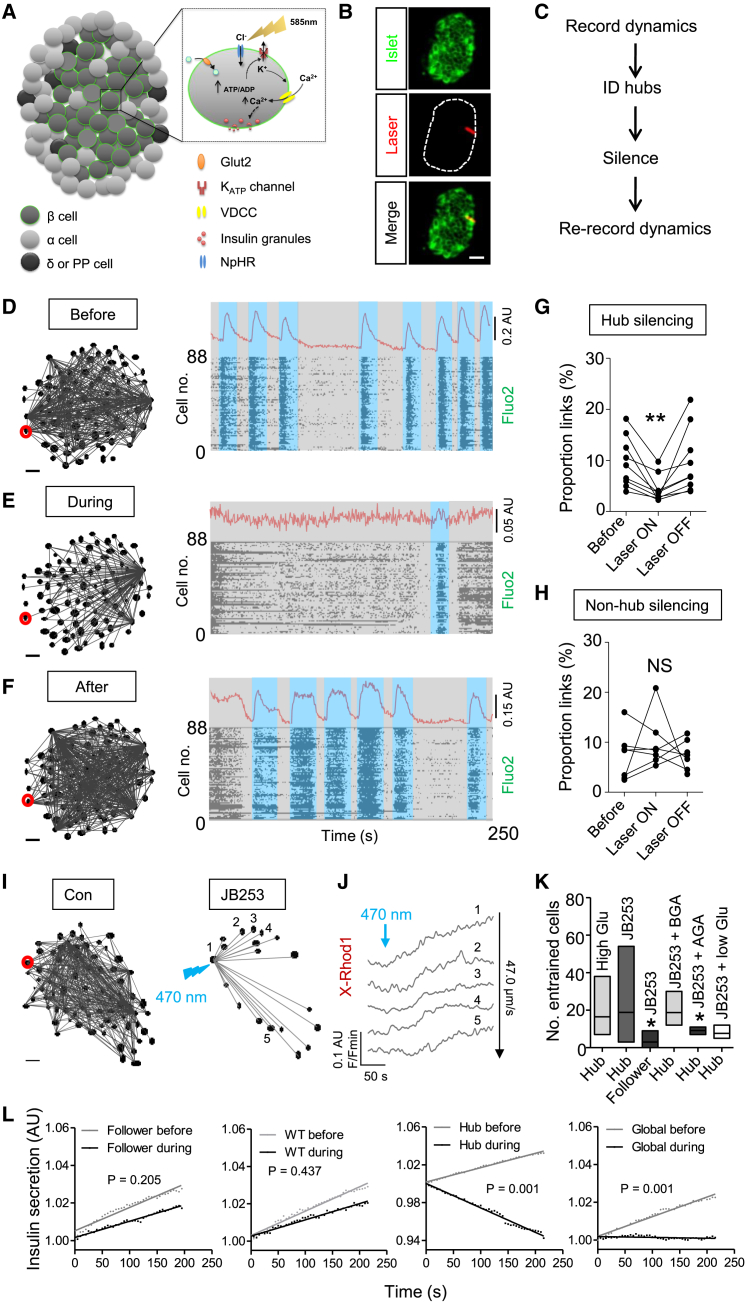
The arrangement of β cells within islets of Langerhans is critical for insulin release through the generation of rhythmic activity. A privileged role for individual β cells in orchestrating these responses has long been suspected, but not directly demonstrated. We show here that the β cell population in situ is operationally heterogeneous. Mapping of islet functional architecture revealed the presence of hub cells with pacemaker properties, which remain stable over recording periods of 2 to 3 hr. Using a dual optogenetic/photopharmacological strategy, silencing of hubs abolished coordinated islet responses to glucose, whereas specific stimulation restored communication patterns. Hubs were metabolically adapted and targeted by both pro-inflammatory and glucolipotoxic insults to induce widespread β cell dysfunction. Thus, the islet is wired by hubs, whose failure may contribute to type 2 diabetes mellitus.

Keywords: diabetes; imaging; insulin; islets; optogenetics; β cells.


Figures

None
Graphical abstract
Figure 1
Figure 1
Functional Mapping of β Cell Population Dynamics (A) At elevated glucose (11 mM), islets house a scale-free network where a few (<10%) β cells host the majority of correlated links (p < 0.01), as shown by the power law-fitted probability distribution (LC, low connectivity range; HC, high connectivity range) (R2 = 0.72) (n = 12 recordings from five animals). A log-log scale is used to convert the power law into a linear relationship. (B) Representative functional connectivity map displaying the x-y position of analyzed cells and their links (followers, blue; hubs, red; scale bar, 20 μm). (C) Representative trace showing that hub (red) activity tends to precede and outlast that of follower cells (gray) (mean lag value calculated from n = 5 recordings from three animals). (D) Treatment of islets with the gap junction blocker 18α-glycyrrhetinic acid (AGA; 20 μM) (left), but not its inactive analog glycyrrhizic acid (BGA; 20 μM) (right) reduces the proportion of hubs (n = 9 recordings from five animals) (before, islet in control buffer; after, same islet in the presence of either AGA or BGA). (E) As for (D), but the proportion (%) of correlated links. (F and G) Gap junction blockade increases the length between correlated links (n = 9 recordings from five animals). (H) Wiring patterns are statistically stable upon re-recording after 30 min, as determined against the same islet but with enforced dissimilarity (n = 8 recordings from five animals). (I) Wiring patterns are statistically stable upon re-recording after 30 min (Fluo2) and 3 hr (GCaMP6), as compared to the randomly shuffled correlation matrix for each islet (n = 4–6 recordings from two to three animals). (J) As for (A) but showing almost identical link-probability distributions in mouse and human islets, as shown by the exponent values (κ) for the fitted power laws (n = 8 recordings from three donors). (K and L) Imaging using GCaMP6 and Fluo2 return similar hub and link proportions (n = 12 recordings from four to six animals). Data are means ± SEM.p < 0.05 and ∗∗p < 0.01. NS, non-significant. See also Figure S1 and Movie S1.
Figure 2
Figure 2
Reversible and Repeated Silencing of β Cell Ca2+-Spiking Activity (A) Immunostaining for insulin showing membrane-localized expression of eNpHR3.0-EYFP in β cells (Dapi, nuclei) (n = 3 preparations). (B) As for (A), but immunostaining for glucagon showing absence of eNpHR3.0-EYFP in α cells (n = 3 preparations). Scale bar, 50 μm (or 10 μm for dissociated cells). (C) Reversible silencing of β cell Ca2+ oscillations in eNpHR3.0-expressing islets in response to illumination with λ = 561 nm (n = 5 recordings). Treatment of islets with nifedipine 50 μM (Nif; black trace) abolishes the rebound in Ca2+ upon inactivation of eNpHR3.0 (n = 5 recordings) (traces are from different islets). (D) As for (C), but in the presence of verapamil 10 μM (Ver; black trace) (n = 5 recordings) (traces are from different islets). (E) Perifusion of islets with zero Ca2+ supplemented with EGTA was able to prevent recovery of [Ca2+]i in islets following silencing (n = 5 recordings). (F) β cell population Ca2+-spiking activity can be repeatedly silenced following exposure to λ = 561 nm (n = 3 recordings). (G) Global silencing (λ = 561 nm) induced a decrease in intracellular Ca2+ concentrations ([Ca2+]i) throughout the islet, whereas a diffraction-limited laser (λ = 589 nm) only silenced [Ca2+]i in the targeted area (n = 3 recordings). (H) Silencing can be overcome using the depolarizing agent KCl 30 mM to re-activate VDCC (n = 6 recordings). (I and J) Wild-type islets (NpHR−/−) do not respond to illumination with decreases in [Ca2+]i (n = 5 recordings). (K) Diazoxide (Dz) 100 μM is unable to further suppress [Ca2+]i in eNpHR3.0-silenced islets (n = 5 recordings). Where indicated, tolbutamide (Tb) 100 μM was added to maintain a stable plateau from which to better detect silencing. G17, glucose 17 mM; G11, glucose 11 mM; G3, glucose 3 mM. See also Movies S2, S3, and S4.
Figure 3
Figure 3
Yellow Light Hyperpolarizes eNpHR3.0-Expressing Pancreatic β Cells (A) Voltage clamp (whole cell) recording of an eNpHR3.0-expressing β cell showing induction of photocurrents with yellow light (λ = 572 nm). (B–D) Representative current clamp (perforated patch) recordings showing reversible membrane hyperpolarization with yellow light (λ = 572 nm) in an eNpHR3.0-expressing (NpHR), but not wild-type (WT), β cell. In all cases, n = 6–11 cells. Data are means ± SEM. ∗∗∗p < 0.001.
Figure 4
Figure 4
Glucose Homeostasis in eNpHR3.0 Mice (A and B) Glucose tolerance is improved in male 8 week Ins1Cre+/−;eNpHR3.0-EYFPfl/−(NpHR) animals (n = 7) compared to Ins1Cre−/−;eNpHR3.0-EYFPfl/− (wild-type, WT) littermates (n = 7) (i.e., activation of Ins1Cre on an eNpHR3.0-EYFP background), as assessed using IPGTT. (C) Insulin sensitivity is similar in male NpHR mice animals and WT littermates (n = 6–11), as determined using ITT. (D and E) As for (A) and (B), but female 8 week mice (n = 7–9). (F) As for (C), but female 8 week (n = 4). (G and H) Fasting body weight and growth curves (non-fasted) are similar in WT and NpHR animals (n = 9–13). (I) In vivo insulin release tended to be increased in NpHR compared to WT animals at 15 min post-IP glucose injection (n = 4). (J) β cell mass, α cell mass, and α:β cell ratio are similar in WT and NpHR animals (n = 3). (K and L) As for (A) and (B), but glucose tolerance in 6 and 8 week Ins1Cre+/−;eNpHR3.0-EYFPfl/−(NpHR) (n = 3–4) compared to Ins1Cre+/−;eNpHR3.0-EYFP−/− (wild-type, WT) animals (n = 8) (i.e., activation of eNpHR3.0-EYFP on an Ins1Cre-background). Data are means ± SEM. ∗∗p < 0.01. NS, non-significant. See also Figure S2.
Figure 5
Figure 5
Real-Time Analysis and Targeting of β Cell Hubs (A and B) Schematic showing the effects of eNpHR3.0 activation upon β cell Ca2+ signaling (A), and snapshot showing placement of a diffraction-limited laser spot over a discrete islet region (B) (scale bar, 25 μm; image cropped to display a single islet). (C) Experimental flowchart for real-time manipulation of hub function. (D–F) Representative functional connectivity map and activity plots at high glucose (11 mM), before (D), during (E) and after (F) optogenetic silencing (identified hub cell; red). A representative Ca2+ trace is displayed above. (G and H) Summary data showing a reversible collapse in the proportion of correlated cell links following hub (G), but not follower (or non-hub) (H) silencing (n = 7–9 recordings from four animals). (I–K) Representative cell-cell entrainment patterns (I) and representative Ca2+ rises in linked cells (J) following photopharmacological stimulation of an identified hub (red) at 3 mM glucose using JB253 (50 μM). Box and whiskers plot shows the range and mean number of hub- or follower-entrained cells under high (11 mM) glucose (High Glu) conditions, and following targeted stimulation using JB253 in the presence of control (3 mM glucose), BGA, AGA, and low (1 mM) glucose (low Glu) (K) (n = 4–7 recordings from three to four animals). (L) Insulin secretion measured using JP-107 is unaffected following illumination of follower (or non-hub) cells or wild-type (WT) islets, but suppressed in response to hub or islet (global) shutdown (mean traces shown) (n = 8 islets from 4 animals). Scale bars, 20 μm. Data are means ± SEM. p < 0.05. NS, non-significant. See also Figures S2 and S3 and Movies S5 and S6.
Figure 6
Figure 6
Phenotypic Profiling of Hub Cell Function (A and B) Hubs display elevated mitochondrial potential (Ψm) compared to the rest of the population, as measured using TMRE to label active mitochondria (n = 9 recordings from three animals) (G3, glucose 3 mM; G11, glucose 11 mM) (fold-change is normalized to all cells). (C–F) Duty cycle (i.e., fraction spent “ON”) (C) and Ca2+ oscillation amplitude (D) and frequency ([E], [F]) are similar in hubs and followers (n = 8 recordings from four animals). (G and H) Polar coordinates showing that hub distribution is not spatially biased versus followers (angle θ and distance r from the islet center 0,0 are shown in the bar graphs). (I and J) PA-TagRFP-identified hubs (red; RFP) express less insulin (Ins), less Pdx1, less Nkx6.1, more Gck, and normal Tomm20 compared to the rest of the population (n = 5–9 hubs from three to four animals). (K) Hubs were not immunopositive for glucagon (Glu), and Ngn3 expression was largely undetectable in the adult islet. (L–N) High resolution Z projections of Tomm20- and MitoTracker-stained islets (L) reveal normal mitochondrial sphericity (M) and length (N) (white-dashed line, hub; blue-dashed line, non-hub) (3D render shown for Tomm20 and Z projection for MitoTracker) (n = 6 hubs from three animals). (O and P) As for (L)–(N), but staining for Pdi and SERCA2 showing normal endoplasmic reticulum abundance and lowered Ca2+-ATPase content in hubs (Z projection, left; 3D render, right) (n = 4 to 5 hubs from three animals). (Q and R) High-resolution snapshot of insulin staining (Q) showing a reduction in granule content in hubs (red) (R) (n = 6 hubs from three animals). Scale bars, 12.5 μm. Data are means ± SEM. p < 0.05 and ∗∗p < 0.01. NS, non-significant. See also Figures S4 and S5.
Figure 7
Figure 7
Disruption of Hubs by Pro-Inflammatory and Glucolipotoxic Insults (A and B) IL-1β/IL-6 and IL-1β/TNF-α reduce hub number after 2 hr (n = 6 islets from three animals). (C and D) Cytokine (Cyto; IL-1β/IL-6) decreases hub number in real-time (n = 8 from four animals). (E and F) Cytokine alters the distribution of correlated links and power law scaling exponent (k) value, indicating a decreased number of cells in the high connectivity (i.e., hub) range (n = 8 from four animals) (R2 = 0.38–0.74). The power law was log-log transformed to a linear relationship to better demonstrate the distribution. (G) Cytokine (IL-1β/IL-6) exposure dramatically reduces the proportion of correlated links. (H to I) Application of IL-1β/IL-6 or IL-1β/TNF-α for 2 hr (H) or 4 hr (I) is not cytotoxic (n = 21 islets per condition from 6 animals) (scale bar, 25 μm). (J) 2 hr application of IL-1β/IL-6 or IL-1β/TNF-α does not induce apoptosis (n = 18–20 islets from five animals). (K and L) IL-1β/IL-6 and IL-1β/TNF-α decrease connexin-36 (Gjd2) mRNA levels (n = 10 animals). (M) IL-1β/IL-6 and IL-1β/TNF-α reduce the number of immunostained gap junction (connexin-36; Cx36) plaques (n = 9–12 islets from six animals) (scale bar, 12.5 μm). (N) Glucotoxicity (Glucotox) and glucolipotoxicity (Glucolipotox) reduce the proportion of hubs and correlated links in mouse islets (n = 6 animals). (O) As for (N), but showing effects of glucolipotoxicity-alone on human islets (n = 5 donors). Control, Con (buffer-alone). Data are means ± SEM. p < 0.05; ∗∗p < 0.01. NS, non-significant. See also Figure S6.

Comment in

References

    1. Ammälä C., Larsson O., Berggren P.-O., Bokvist K., Juntti-Berggren L., Kindmark H., Rorsman P. Inositol trisphosphate-dependent periodic activation of a Ca(2+)-activated K+ conductance in glucose-stimulated pancreatic β-cells. Nature. 1991;353:849–852. - PubMed
    1. Andresen V., Alexander S., Heupel W.M., Hirschberg M., Hoffman R.M., Friedl P. Infrared multiphoton microscopy: subcellular-resolved deep tissue imaging. Curr. Opin. Biotechnol. 2009;20:54–62. - PubMed
    1. Benninger R.K., Piston D.W. Cellular communication and heterogeneity in pancreatic islet insulin secretion dynamics. Trends Endocrinol. Metab. 2014;25:399–406. - PMC - PubMed
    1. Benninger R.K., Zhang M., Head W.S., Satin L.S., Piston D.W. Gap junction coupling and calcium waves in the pancreatic islet. Biophys. J. 2008;95:5048–5061. - PMC - PubMed
    1. Benninger R.K., Hutchens T., Head W.S., McCaughey M.J., Zhang M., Le Marchand S.J., Satin L.S., Piston D.W. Intrinsic islet heterogeneity and gap junction coupling determine spatiotemporal Ca²+ wave dynamics. Biophys. J. 2014;107:2723–2733. - PMC - PubMed

MeSH terms