. 2016 Aug 2;16(5):1456-1469.
doi: 10.1016/j.celrep.2016.06.084. Epub 2016 Jul 21.

The Cardiomyocyte RNA-Binding Proteome: Links to Intermediary Metabolism and Heart Disease

Affiliations

The Cardiomyocyte RNA-Binding Proteome: Links to Intermediary Metabolism and Heart Disease

Yalin Liao et al. Cell Rep. .

Abstract

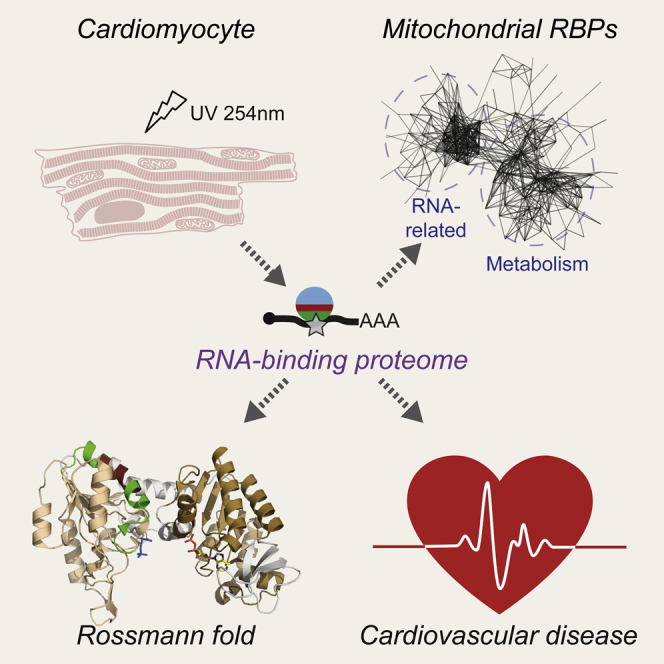
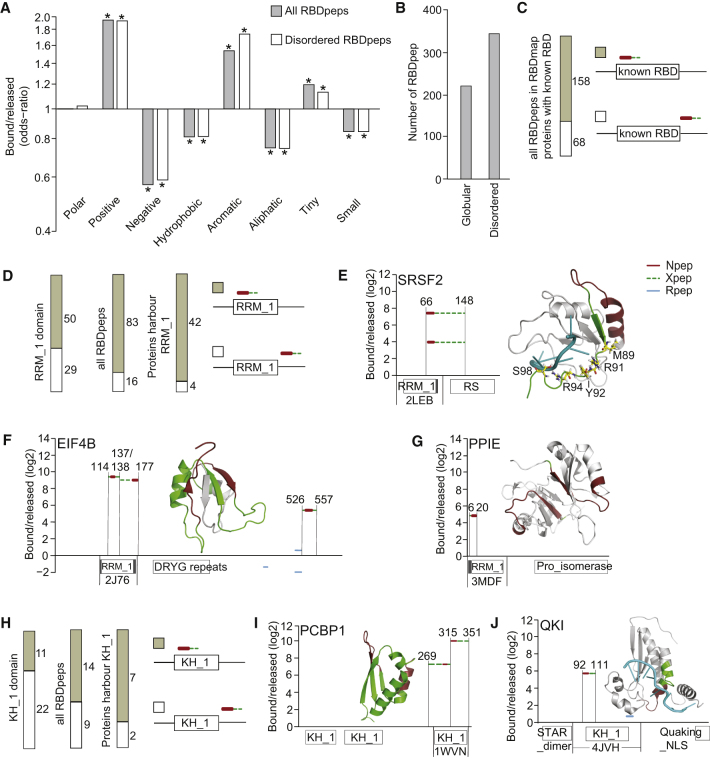
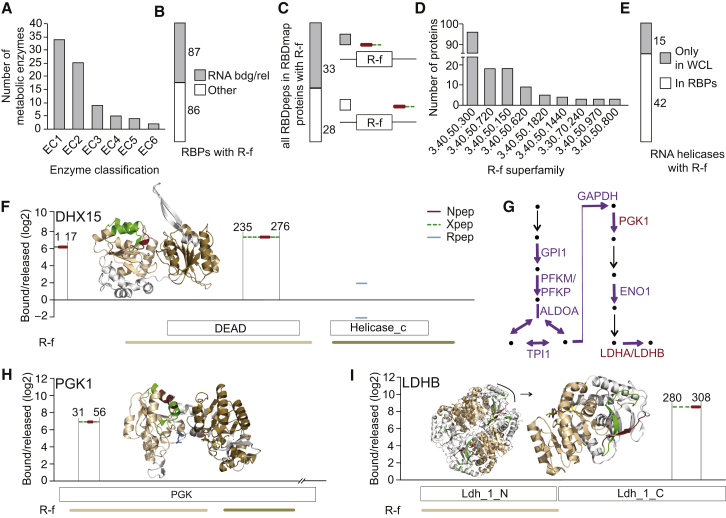
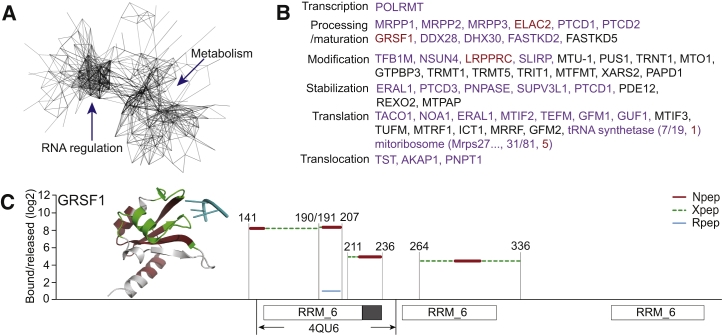
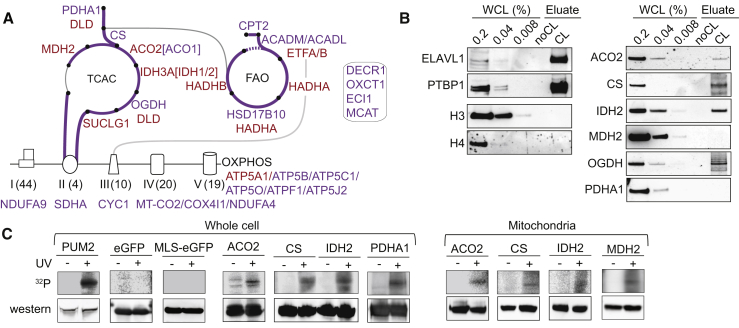
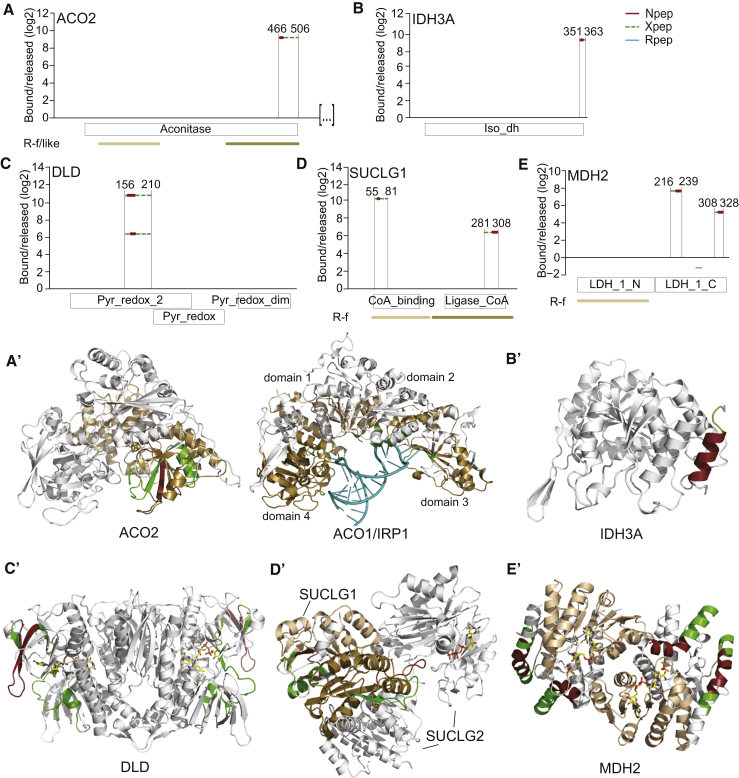
RNA functions through the dynamic formation of complexes with RNA-binding proteins (RBPs) in all clades of life. We determined the RBP repertoire of beating cardiomyocytic HL-1 cells by jointly employing two in vivo proteomic methods, mRNA interactome capture and RBDmap. Together, these yielded 1,148 RBPs, 391 of which are shared with all other available mammalian RBP repertoires, while 393 are thus far unique to cardiomyocytes. RBDmap further identified 568 regions of RNA contact within 368 RBPs. The cardiomyocyte mRNA interactome composition reflects their unique biology. Proteins with roles in cardiovascular physiology or disease, mitochondrial function, and intermediary metabolism are all highly represented. Notably, we identified 73 metabolic enzymes as RBPs. RNA-enzyme contacts frequently involve Rossmann fold domains with examples in evidence of both, mutual exclusivity of, or compatibility between RNA binding and enzymatic function. Our findings raise the prospect of previously hidden RNA-mediated regulatory interactions among cardiomyocyte gene expression, physiology, and metabolism.


Figures

None
Graphical abstract
Figure 1
Figure 1
Identification of Cardiomyocyte RBPs (A) Schematic of mRNA interactome capture and RBDmap approaches. Proteins identified by one or both approaches constituted a superset of cardiomyocyte RBPs. (B) RNA-protein complexes captured on oligo(dT) beads were digested with proteinase K and RNA recovery levels monitored by quantitative PCR. Shown are averages of six biological replicates. Error bars, SD. (C and D) Complexes captured on oligo(dT) beads were eluted by RNase-digestion, resolved by SDS-PAGE alongside input WCL (percentage equivalent to loaded eluate amount as indicated), and analyzed by western blot (C; see Experimental Procedures for antibody details) or silver stain (D). Results are representative of three independent interactome capture experiments. (See Figures S1A and S1B for equivalent RBDmap controls.) (E) Proportion of cardiomyocyte RBPs or WCL proteins with GO annotation “RNA binding” or RNA-related annotations (see Supplemental Experimental Procedures for details on annotation sources). Left, cardiomyocyte RBPs; right, WCL. (F) Analyses as in (E) for RBDs. (G) Matrix plot of enriched/depleted KEGG pathways among RBP groups as defined in (E), compared to WCL. See also Figures S1 and S2 and Table S1.
Figure 2
Figure 2
Performance of the RBDmap Approach (A) Analysis of amino acid bias in RBDpeps (cf. Figure 1A) and disordered RBDpeps versus corresponding released fragments. p < 0.01. (B) RBDpep distribution between globular and disordered protein domains. (C) Proportion of RBDpeps that overlap with a known RBD. (D) In RBDmap proteins containing RRM_1, proportion of RRM_1 motifs with RBDpep coverage (left), of RBDpeps that overlap with an RRM_1 (middle) and of RRM_1-containing RBPs with at least one such overlap (right). (E) Graphic representation of RBDmap data for SRSF2. Here, as in subsequent panels/figures displaying RBDmap data, Npeps (red) and Xpeps (green dashes; the crosslinked amino acid could reside anywhere within the Xpep), jointly termed RBDpep (positions of N- and C- termini are indicated), are mapped onto the linear protein sequence. y axis indicates enrichment (log2) in RNA bound over released fraction. Boxes underneath the x axis indicate Pfam-annotated domains with extensions (shaded gray) based on crystal structures, unless otherwise specified. See Supplemental Experimental Procedures for RS domain annotation. RBDpeps were also highlighted in the co-crystal structure (PDB: 2LEB) of the SRSF2 RRM_1 domain (ribbon diagram) with 5′-UCCAGU-3′ RNA (teal). Amino acids contacting RNA in structure are rendered as stick models. (F) RBDmap data for EIF4B and crystal structure of the EIF4B RRM_1 (PDB: 2J76). Rpeps are shown in blue. DRYG repeats position was obtained from Méthot et al. (1996). (G) RBDmap data for PPIE and crystal structure of PPIE RRM_1 dimer (PDB: 3MDF). (H) Analyses as in (D) but for KH_1 motifs. (I) RBDmap data for PCBP1 and crystal structure of the third KH_1 motif of PCBP1 (PDB: 1WVN). (J) RBDmap data for QKI and crystal structure of QKI KH_1 in complex with 5′-ACUAACAA-3′ RNA (teal) (PDB: 4JVH). See also Figure S3 and Table S2.
Figure 3
Figure 3
Association of Cardiomyocyte RBPs with Cardiovascular Disease/Development and Human Mendelian Diseases (A) Analyses as in Figure 1E but for RBP association with cardiovascular disease/development (left) and genetic disease (based on OMIM; right). (B) Spectrum of OMIM-listed genetic diseases caused by mutations in cardiomyocyte RBPs. (C) RBDmap data for SERCA2 (amino acids 612–758; EC:3.6.3.8) and mapping onto Phyre2-modeled structure. Arrow indicates position of disease-associated missense mutation variants. A R-f domain is also highlighted (wheat). (D) RBDmap data for PPIF (EC:5.2.1.8) and mapping onto co-crystal structure (PDB: 4TOT) of PPIF with inhibitor NIM258 (orange, PDB: 4TOT). (E) RBDmap data for ETFA/ETFB and mapping onto crystal structure in complex with FAD and AMP (multicolor; 1EFV). A second R-f domain in ETFA is highlighted with a sand color. See also Tables S3 and S4.
Figure 4
Figure 4
Rossmann Fold Topology and RNA Binding (A) Classification of metabolic enzymes among cardiomyocyte RBPs. (B) Analysis as in Figure 1E for R-f cardiomyocyte RBPs. (C) Proportion of RBDpeps that overlap with a R-f domain. (D) Distribution of cardiomyocyte RBPs across R-f superfamilies (by CATH id; only families with more than three members are shown). (E) Proportion of WCL RNA helicases with R-f identified as RBPs. (F) RBDmap data for DHX15 and mapping onto Phyre2-modeled structure. Here, and in the following panels, R-f domains are highlighted as applicable (N-terminal, wheat; C-terminal, sand). (G) Schematic of glycolysis. Purple and red color indicate enzyme(s) present in cardiomyocyte RBPs and the RBDmap dataset, respectively. (H) RBDmap data for PGK1 (EC:2.7.2.3) and mapping to tetrameric crystal structure in complex with 3-phosphoglyceric acid (orange) and ADP (multicolor) (PDB: 2XE7). (I) RBDmap data for LDHB (EC:1.1.1.27) and mapping to tetramer crystal structure in complex with NAD+ (multicolor) (PDB: 1I0Z). Enlarged view shows monomer. See also Figures S4, S6, and S7 and Tables S3 and S5.
Figure 5
Figure 5
Analysis of Cardiomyocyte mtRBPs (A) Functional protein association networks of mtRBPs based on STRING analysis (see Supplemental Experimental Procedures). (B) Spectrum of known proteins involved in the mitochondrial RNA life cycle. Color scheme is as in Figure 4F. (C) RBDmap data for GRSF1 isoform 1 and mapping to the co-crystal structure of N-terminal RRM_6 in complex with 5′-GGG-3′ RNA (teal) (PDB: 4QU6). See also Figure S5 and Tables S1, S2, S3, and S5.
Figure 6
Figure 6
Validation of RNA Binding by Mitochondrial Enzymes (A) Schematic of mitochondrial TCA cycle, FAO, and OXPHOS. Color scheme is as in Figure 4F. Number of known subunit variants for each OXPHOS complex is shown in brackets. NDUFA4 is considered as complex IV subunit (Balsa et al., 2012). Box to the right indicates FAO-associated enzymes. (B) Small-scale mRNA interactome capture from HL-1 cells and western blots with antibodies against positive and negative controls (left; as in Figure 1C) as well as six endogenous TCA cycle-related enzymes (right; n = 1). (C) Immunoprecipitation of eGFP-tagged proteins from UV-treated and control HeLa cells and 32P 5′ end labeling of crosslinked RNA fragments. Samples were processed for storage phosphor imaging (top) and western blot with anti-GFP antibody (bottom). PUM2-eGFP (at lower dose) is shown as a positive control, while eGFP alone, with or without a mitochondrial localization signal, and mock purifications from non-crosslinked cells served as negative controls (n = 1–3). Immunoprecipitation was done from WCL (left) or from purified mitochondria (right). Controls for intracellular localization of fusion proteins and mitochondrial isolation are shown in Figure S5. See also Figure S5.
Figure 7
Figure 7
RNA-Binding Modalities among TCA Cycle Enzymes (A–E) RBDmap data for ACO2 (amino acids 1–523; EC:4.2.1.3), IDH3A (EC:1.1.1.41), DLD (EC:1.8.1.4), SUCLG1 (EC:6.2.1.4, EC:6.2.1.5), and MDH2 (EC:1.1.1.37). (A′–E′) RBDpeps were mapped to enzyme crystal or Phyre2-modeled structures. (A′) ACO2 crystal structure with 4Fe-4S cluster (multicolor) (PDB: 6ACN) shown on left. IRP1/ACO1 co-crystal structure with IRE-RNA (teal) (PDB: 3SNP) shown for comparison on right; IRE contacts in IRP1 are depicted in green. (B′) Phyre2-modeled structure of IDH3A. (C′) Crystal structure of DLD dimer in complex with FAD (multicolor) (PDB: 1ZMC). (D′) Crystal structure of SUCLG1-SUCLG2 heterodimer in complex with GTP (multicolor) (PDB: 2FP4). (E′) Crystal structure of MDH2 dimer in complex with D-malate (orange) and NAD+ (multicolor) (PDB: 2DFD). See also Figures S6 and S7 and Tables S2 and S5.

References

    1. Antonicka H., Shoubridge E.A. Mitochondrial RNA granules are centers for posttranscriptional RNA processing and ribosome biogenesis. Cell Rep. 2015;10:920–932. - PubMed
    1. Balsa E., Marco R., Perales-Clemente E., Szklarczyk R., Calvo E., Landázuri M.O., Enríquez J.A. NDUFA4 is a subunit of complex IV of the mammalian electron transport chain. Cell Metab. 2012;16:378–386. - PubMed
    1. Baltz A.G., Munschauer M., Schwanhäusser B., Vasile A., Murakawa Y., Schueler M., Youngs N., Penfold-Brown D., Drew K., Milek M. The mRNA-bound proteome and its global occupancy profile on protein-coding transcripts. Mol. Cell. 2012;46:674–690. - PubMed
    1. Beckmann B.M., Horos R., Fischer B., Castello A., Eichelbaum K., Alleaume A.M., Schwarzl T., Curk T., Foehr S., Huber W. The RNA-binding proteomes from yeast to man harbour conserved enigmRBPs. Nat. Commun. 2015;6:10127. - PMC - PubMed
    1. Bond C.S., Fox A.H. Paraspeckles: nuclear bodies built on long noncoding RNA. J. Cell Biol. 2009;186:637–644. - PMC - PubMed

LinkOut - more resources