. 2016 Aug 9;16(6):1604-1613.
doi: 10.1016/j.celrep.2016.06.097. Epub 2016 Jul 21.

Inhibition of the Polyamine Synthesis Pathway Is Synthetically Lethal with Loss of Argininosuccinate Synthase 1

Affiliations

Inhibition of the Polyamine Synthesis Pathway Is Synthetically Lethal with Loss of Argininosuccinate Synthase 1

Matthew Locke et al. Cell Rep. .

Abstract

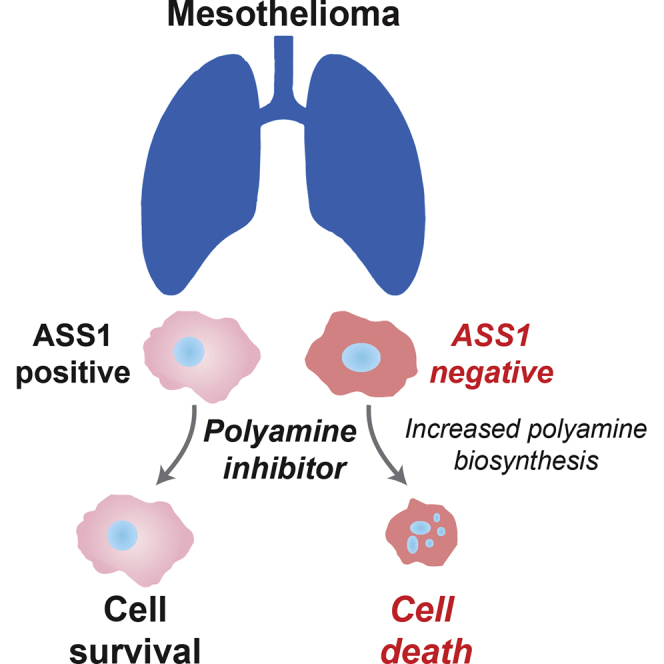
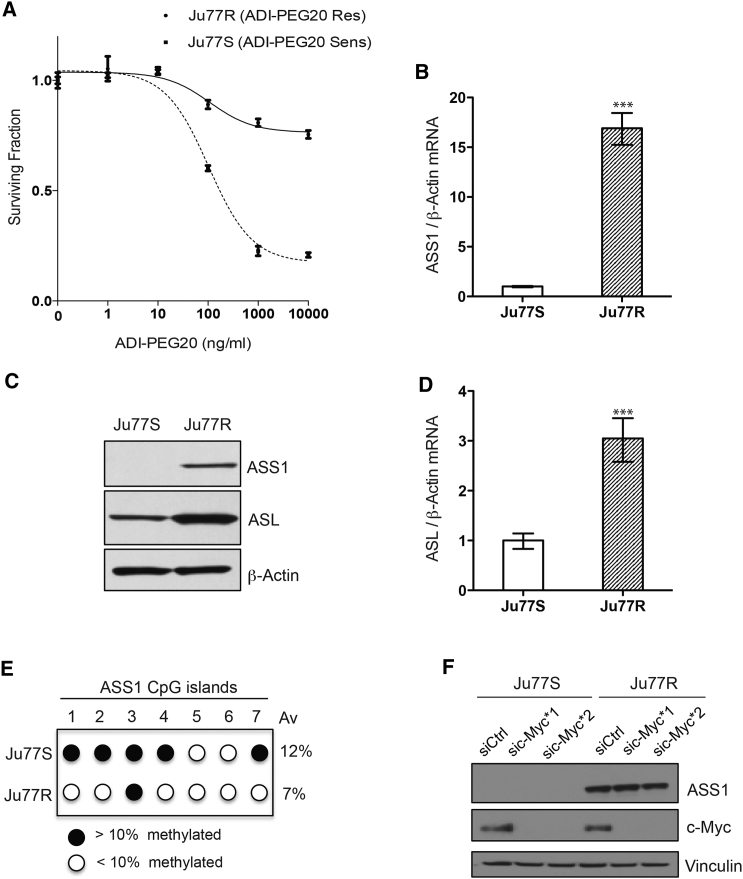
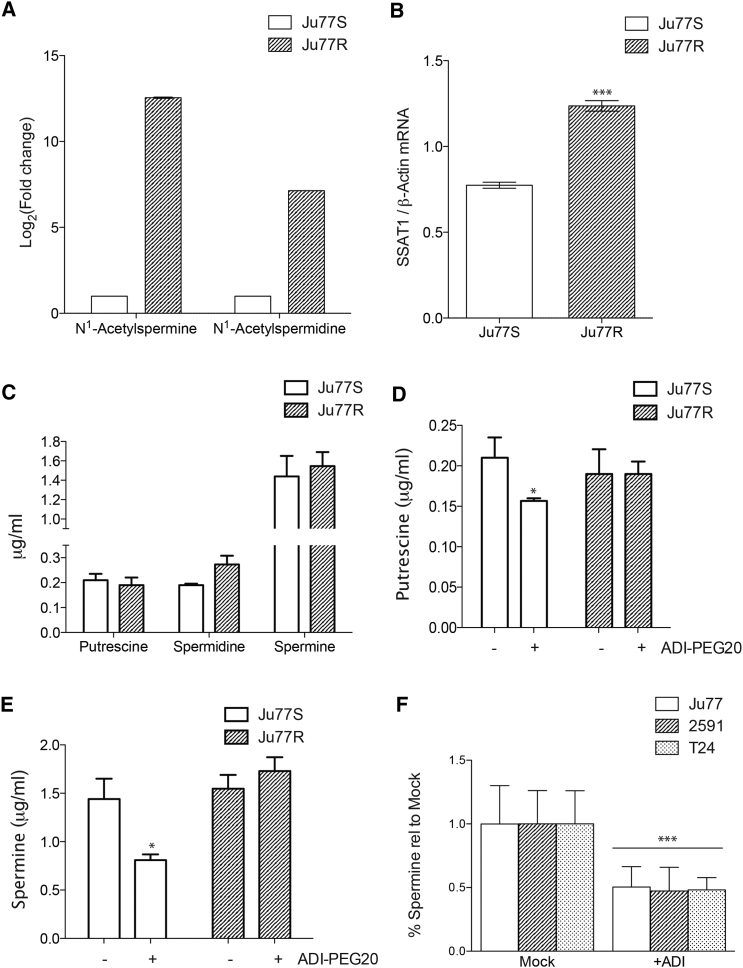
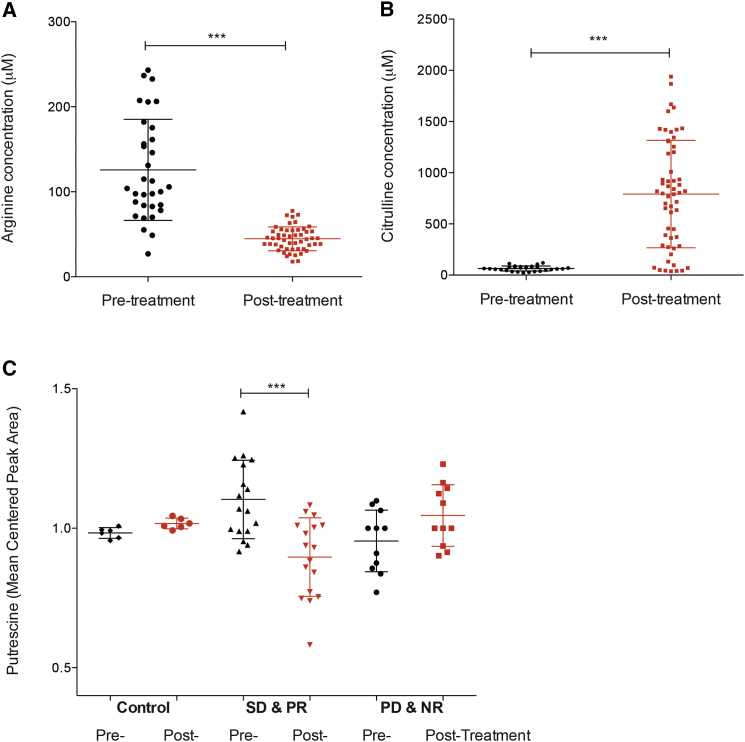
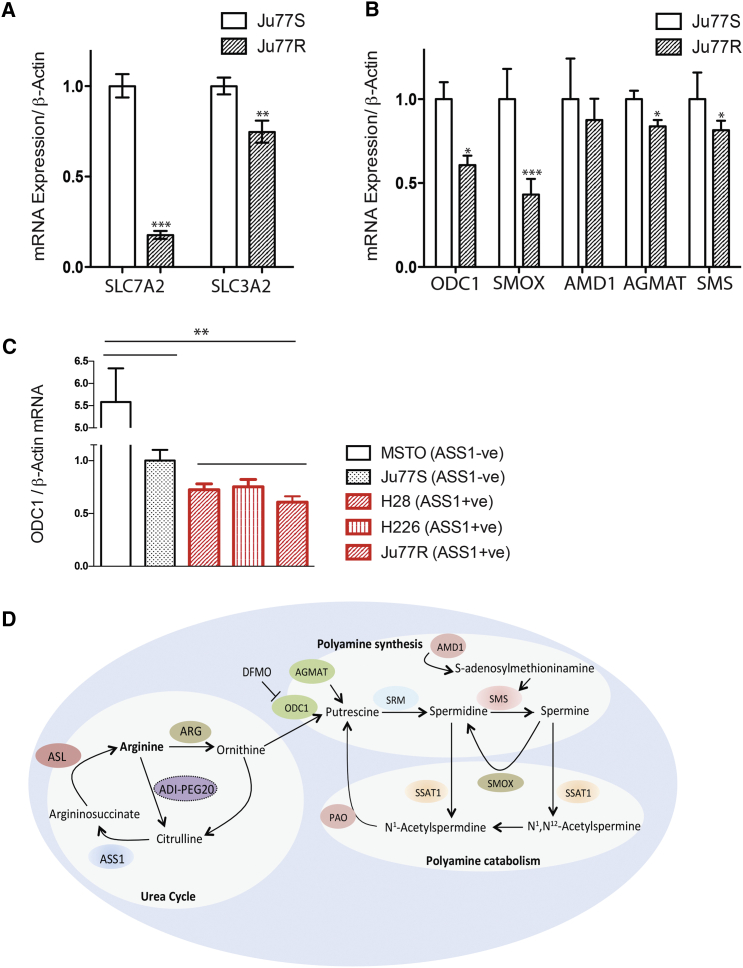
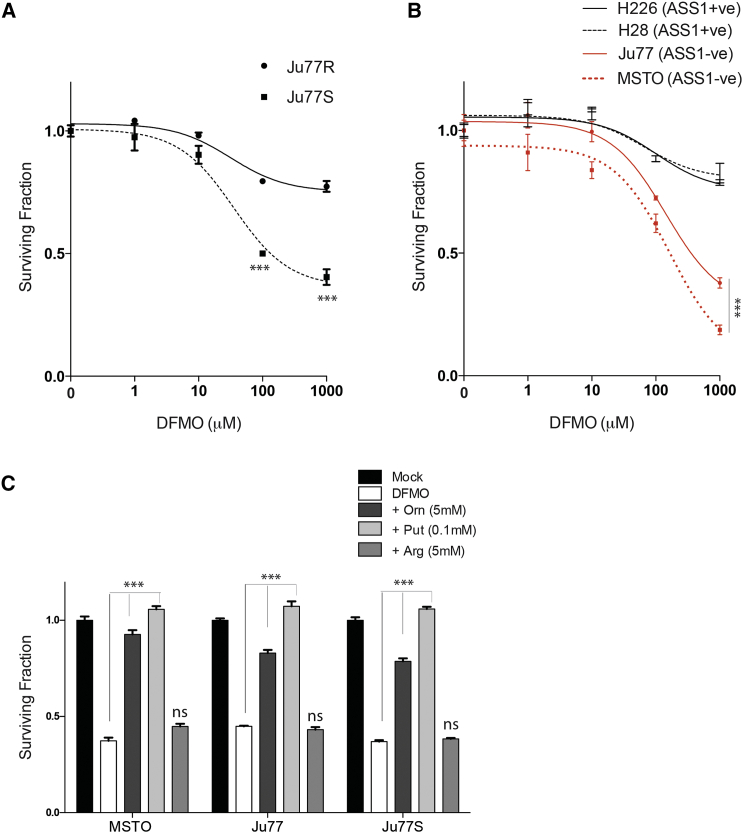
Argininosuccinate synthase 1 (ASS1) is the rate-limiting enzyme for arginine biosynthesis. ASS1 expression is lost in a range of tumor types, including 50% of malignant pleural mesotheliomas. Starving ASS1-deficient cells of arginine with arginine blockers such as ADI-PEG20 can induce selective lethality and has shown great promise in the clinical setting. We have generated a model of ADI-PEG20 resistance in mesothelioma cells. This resistance is mediated through re-expression of ASS1 via demethylation of the ASS1 promoter. Through coordinated transcriptomic and metabolomic profiling, we have shown that ASS1-deficient cells have decreased levels of acetylated polyamine metabolites, together with a compensatory increase in the expression of polyamine biosynthetic enzymes. Upon arginine deprivation, polyamine metabolites are decreased in the ASS1-deficient cells and in plasma isolated from ASS1-deficient mesothelioma patients. We identify a synthetic lethal dependence between ASS1 deficiency and polyamine metabolism, which could potentially be exploited for the treatment of ASS1-negative cancers.


Figures

None
Graphical abstract
Figure 1
Figure 1
The Arginine Biosynthetic Pathway Is Upregulated in Ju77R Cells (A) Ju77S and Ju77R MPM cells were treated with increasing concentrations of ADI-PEG20 (0, 1, 10, 100, 1,000, and 10,000 ng/ml). After 4 days of treatment, cell viability was measured using an ATP-based luminescence assay. (B) Real-time qPCR analysis of RNA extracted from Ju77S and Ju77R cells. mRNA expression was measured using ASS1 and β-actin TaqMan probes. β-actin was used as a control. ∗∗∗p < 0.0005. (C) Western blot analysis of protein extracted from Ju77S and Ju77R cells. Protein expression was analyzed using anti-ASS1, anti-ASL, and β-actin antibodies. β-actin is used as a loading control. (D) Real-time qPCR analysis of RNA extracted from Ju77S and Ju77R cells. mRNA expression was measured using ASL and β-actin TaqMan probes. β-actin was used as a control. ∗∗∗p < 0.0005. (E) Methylation analysis across seven CpG islands in the ASS1 promoter. Genomic DNA was extracted from Ju77S and Ju77R cells, and bisulfite was converted. DNA was pyrosequenced across the seven CpG islands in the ASS1 promoter. (F) Western blot analysis of Ju77S and Ju77R cells transfected with a non-targeting control siRNA (siCtrl) or two siRNA oligos targeting c-Myc. Protein was extracted after 72 hr, and expression was analyzed using anti-ASS1, anti-c-Myc, and vinculin antibodies. Vinculin is used as a loading control. All experiments were carried out in triplicate. For (A), (B), and (D), error bars represent SEM. See also Figure S1.
Figure 2
Figure 2
Polyamine Metabolic Reprogramming in ASS1-Deficient Cells (A) Untargeted metabolic analysis was performed on the Ju77S and Ju77R cells. The acetylated polyamines N1-acetylspermine and N1-acetylspermidine were identified as significantly decreased in the Ju77S cells. The graph represents the log2-fold change in comparison to levels in the Ju77S cells. (B) Real-time qPCR analysis of RNA extracted from Ju77S and Ju77R cells. mRNA expression was measured using SSAT1 and β-actin TaqMan probes. β-actin was used as a control. ∗∗∗p < 0.0005. (C) Targeted metabolic analysis was performed on the Ju77S and Ju77R cells upon comparison to the commercially available polyamine metabolites putrescine, spermidine, and spermine. The graph represents the absolute level of each metabolite (in micrograms per milliliter). (D and E) Targeted metabolic analysis was performed on the Ju77S and Ju77R cells before and after 24 hr of treatment with ADI-PEG20 (750 ng/ml) upon comparison to the commercially available polyamine metabolites putrescine (D) and spermine (E). The graph represents the absolute level of each metabolite (in micrograms per milliliter). p < 0.05. (F) Targeted metabolic analysis was performed on the ASS1-deficient Ju77, 2591, and T24 cells before and after 24 hr of treatment with ADI-PEG20 (750 ng/ml) upon comparison to the commercially available polyamine metabolite spermine. The graph represents the level in comparison to mock (PBS) treated cells. ∗∗∗p < 0.0005. See also Figure S2A.
Figure 3
Figure 3
Reduced Putrescine Levels in Plasma from ASS1-Deficient Mesothelioma Patients with SD/PR after ADI-PEG20 Treatment (A and B) Untargeted metabolic analysis was performed on plasma isolated from ASS1-deficient mesothelioma patients before and after ADI-PEG20 treatment and best supportive care. Arginine metabolites (A) and citrulline metabolites (B) were identified in plasma from all patients and were significantly decreased and increased after ADI-PEG20 treatment, respectively. The graphs represent the detected concentration (in micromolars) of arginine (A) and citrulline (B). ∗∗∗p < 0.0001. (C) Untargeted metabolic analysis was performed on plasma isolated from control ASS1-deficient mesothelioma patients before and after best supportive care alone (n = 6) and ASS1-deficient mesothelioma patients with either SD/PR (n = 17) or MR/PD (n = 11) after ADI-PEG20 treatment and best supportive care. The polyamine putrescine was identified in plasma from all patients and was only significantly decreased in the ASS1-deficient patients with SD/PR after ADI-PEG20 treatment and best supportive care. The graph represents the mean centered putrescine peak area. ∗∗∗p < 0.0002. See also Figure S2B.
Figure 4
Figure 4
Expression of Polyamine Metabolic Enzymes Are Increased in ASS1-Deficient Cells (A and B) Real-time qPCR analysis of RNA extracted from Ju77S and Ju77R cells. (A) mRNA expression was measured for the arginine transporter genes using SLC7A2, SLC3A2, and β-actin-specific TaqMan probes. (B) mRNA expression was measured for the polyamine metabolic enzymes using ODC1, SMOX, AMD1, AGMAT, SMS, and β-actin-specific TaqMan probes. β-actin was used as a control. p < 0.05, ∗∗p < 0.005, ∗∗∗p < 0.0005. (C) Real-time qPCR analysis of RNA extracted from a panel of ASS1-deficient (MSTO and Ju77S) and ASS1-proficient (H28, H226, and Ju77R) MPM cell lines. mRNA expression was measured for the polyamine metabolic enzyme, ODC1, and β-actin using gene-specific TaqMan probes. β-actin was used as a control. ∗∗p < 0.005 upon comparison of the ASS1−ve cell lines (MSTO and Ju77S) versus the ASS1+ve cell lines (H28, H226, and Ju77R). (D) Schematic representation of key enzymes and their roles in the urea cycle, polyamine synthesis, and polyamine catabolism. These enzymes are ASS1, ASL, arginine (ARG), ODC1, AGMAT, spermidine synthase (SRM), SMS, AMD1, SSAT1, SMOX, and polyamine oxidase (PAO). For (A)–(C), experiments were carried out in triplicate and error bars represent SEM. See also Figure S3.
Figure 5
Figure 5
Inhibition of Polyamine Synthesis Is Synthetically Lethal in ASS1-Deficient MPM Cells (A and B) Ju77S and Ju77R MPM cells (A) and a panel of ASS1-deficient (MSTO and Ju77) and ASS1-proficient (H28 and H226) MPM cell lines (B) were treated with increasing concentrations of the polyamine inhibitor DFMO (0, 1, 10, 100, and 1,000 μM). After 4 days of treatment, cell viability was measured using an ATP-based luminescence assay. (C) The Ju77, Ju77S, and MSTO cells were treated with mock (DMSO; 0.01%), DFMO (1,000 μM), DFMO and ornithine (Orn; 5 mM), DFMO and arginine (Arg; 5 mM), or DFMO and putrescine (Put; 0.1 mM). After 4 days of treatment, cell viability was measured using an ATP-based luminescence assay. ∗∗∗p < 0.0005. Experiments were carried out in triplicate, and error bars represent SEM.

References

    1. Allen M.D., Luong P., Hudson C., Leyton J., Delage B., Ghazaly E., Cutts R., Yuan M., Syed N., Lo Nigro C. Prognostic and therapeutic impact of argininosuccinate synthetase 1 control in bladder cancer as monitored longitudinally by PET imaging. Cancer Res. 2014;74:896–907. - PubMed
    1. Amelio I., Cutruzzolá F., Antonov A., Agostini M., Melino G. Serine and glycine metabolism in cancer. Trends Biochem. Sci. 2014;39:191–198. - PMC - PubMed
    1. Bachrach U., Wang Y.C., Tabib A. Polyamines: new cues in cellular signal transduction. News Physiol. Sci. 2001;16:106–109. - PubMed
    1. Benjamini Y., Hochberg Y. Controlling the false discovery rate: a practical and powerful approach to multiple testing. J. R. Stat. Soc., B. 1995;57:289–300.
    1. Brabender J., Lord R.V., Danenberg K.D., Metzger R., Schneider P.M., Uetake H., Kawakami K., Park J.M., Salonga D., Peters J.H. Upregulation of ornithine decarboxylase mRNA expression in Barrett’s esophagus and Barrett’s-associated adenocarcinoma. J. Gastrointest. Surg. 2001;5:174–181, discussion 182. - PubMed