. 2016 Aug 2;16(5):1243-1252.
doi: 10.1016/j.celrep.2016.06.078. Epub 2016 Jul 21.

Distinct Metabolic Requirements of Exhausted and Functional Virus-Specific CD8 T Cells in the Same Host

Affiliations

Distinct Metabolic Requirements of Exhausted and Functional Virus-Specific CD8 T Cells in the Same Host

Anna Schurich et al. Cell Rep. .

Abstract

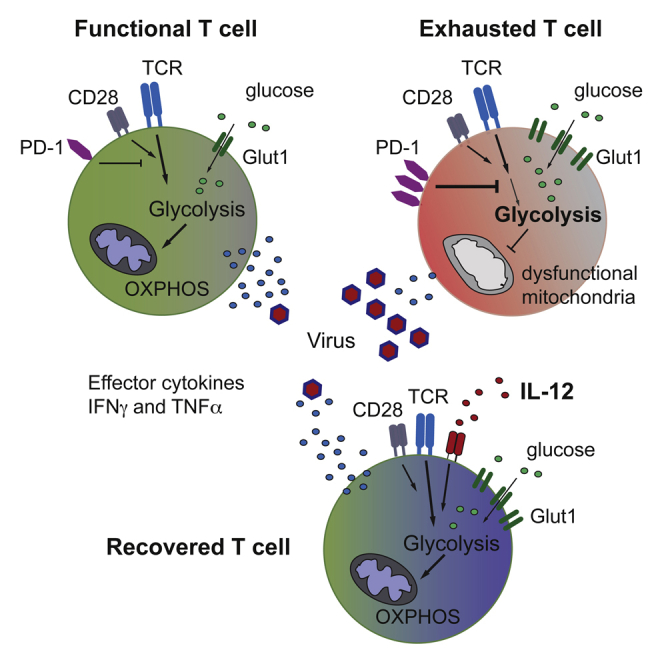
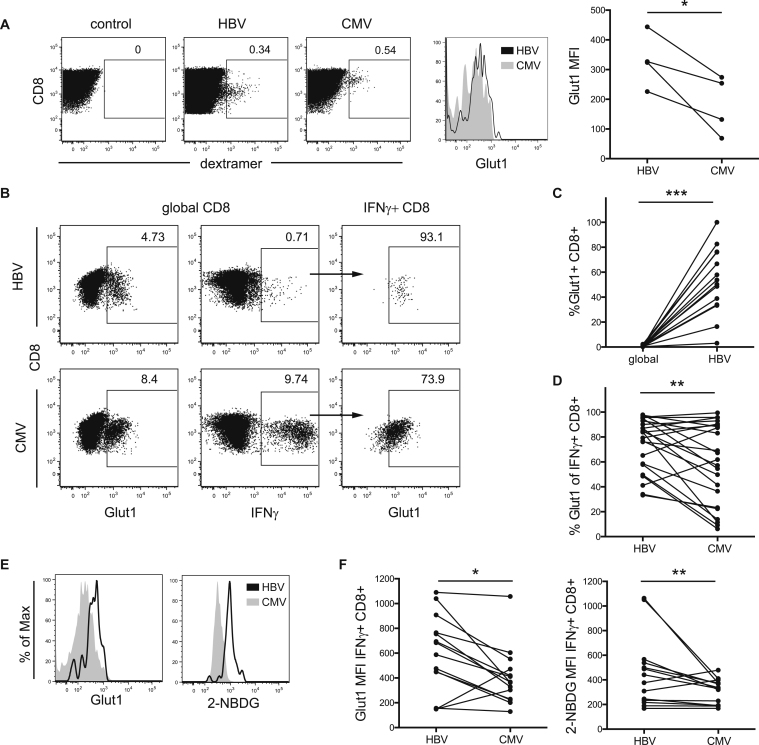
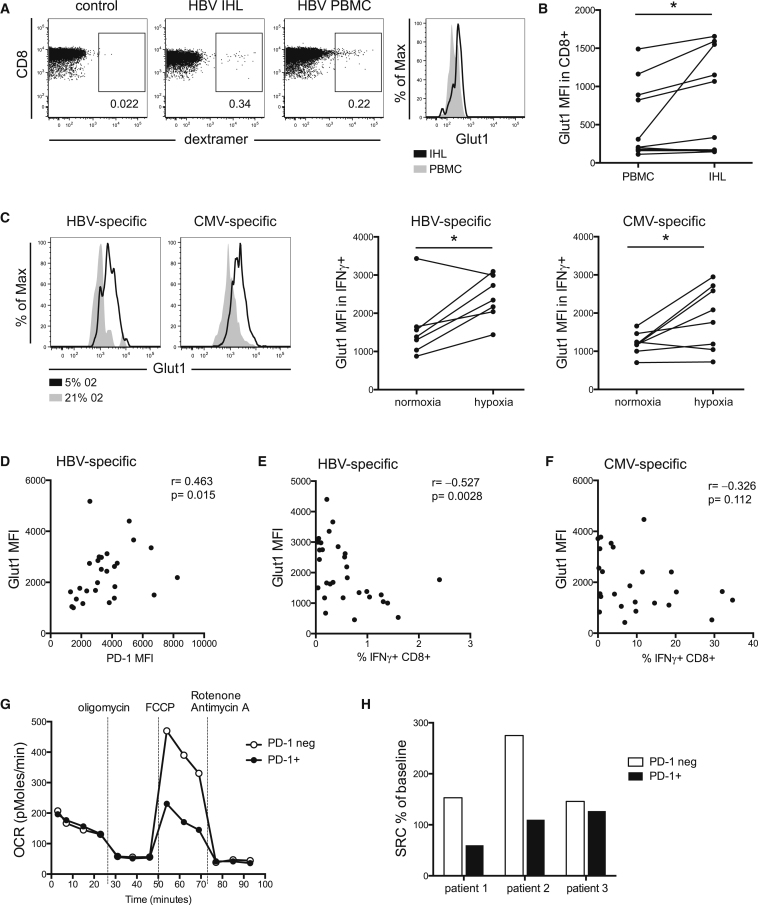
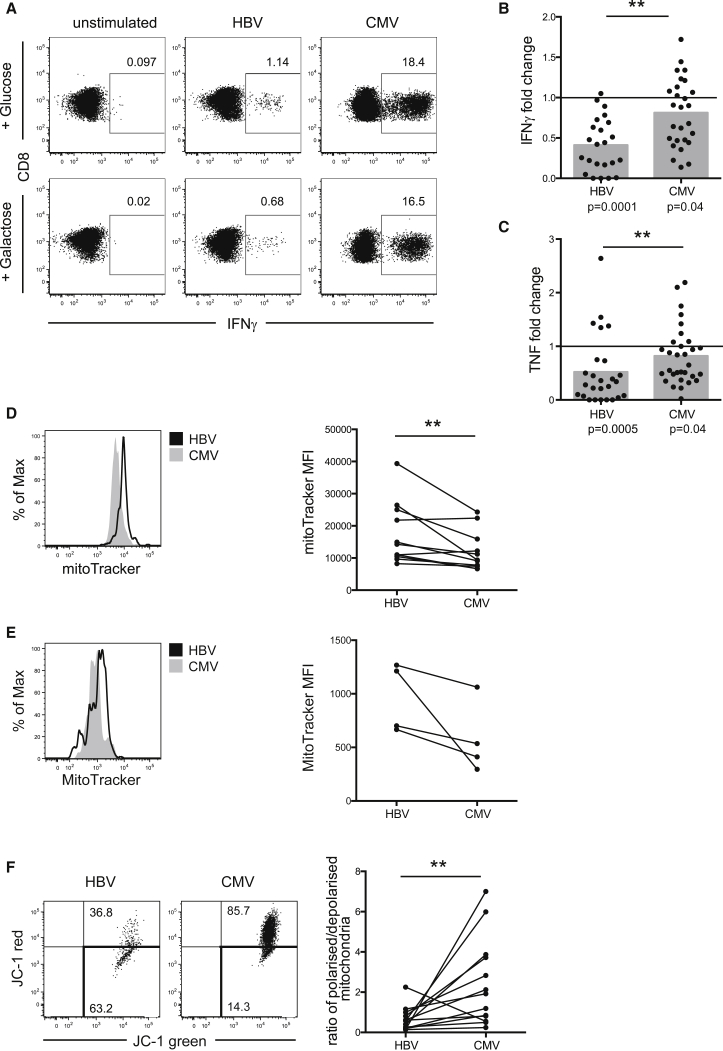
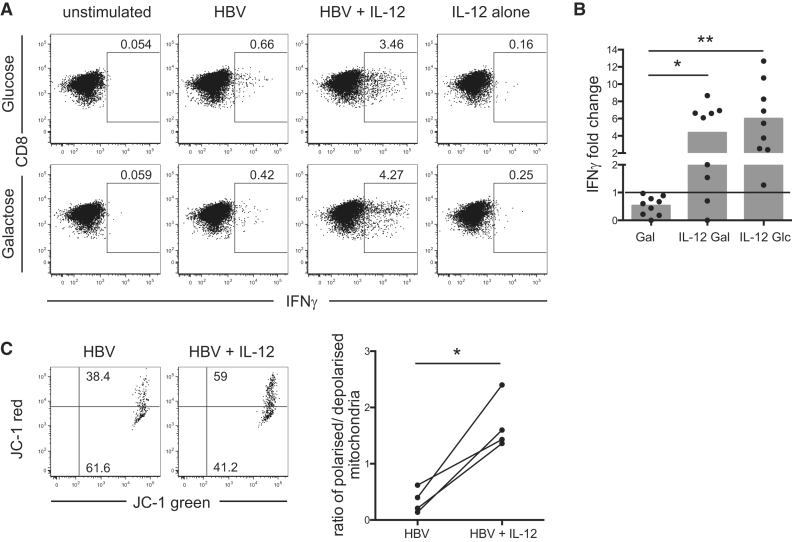
T cells undergo profound metabolic changes to meet the increased energy demands of maintaining an antiviral response. We postulated that differences in metabolic reprogramming would shape the efficacy of CD8 T cells mounted against persistent viral infections. We found that the poorly functional PD-1(hi) T cell response against hepatitis B virus (HBV) had upregulated the glucose transporter, Glut1, an effect recapitulated by oxygen deprivation to mimic the intrahepatic environment. Glut1(hi) HBV-specific T cells were dependent on glucose supplies, unlike the more functional cytomegalovirus (CMV)-specific T cells that could utilize oxidative phosphorylation in the absence of glucose. The inability of HBV-specific T cells to switch to oxidative phosphorylation was accompanied by increased mitochondrial size and lower mitochondrial potential, indicative of mitochondrial dysfunction. Interleukin (IL)-12, which recovers HBV-specific T cell effector function, increased their mitochondrial potential and reduced their dependence on glycolysis. Our findings suggest that mitochondrial defects limit the metabolic plasticity of exhausted HBV-specific T cells.


Figures

None
Graphical abstract
Figure 1
Figure 1
Increased Expression of Glut-1 on HBV-Specific Compared to CMV-Specific CD8 T Cells (A) Glut1 expression in HBV- and CMV-specific T cells after 4-hr stimulation with cognate peptide directly ex vivo. Example of virus-specific cells detected by staining with HLA-A2+ dextramers loaded with virus-specific or irrelevant control peptides (left), overlay of Glut1 MFI in HBV- and CMV-specific cells (middle), and summary data (right). (B) Glut1 expression in global CD8 T cells (left), IFNγ response upon culture with HBV- or CMV-specific peptides (middle), and Glut1 expression on virus-specific IFNγ CD8 T cells (right). (C and D) Summary data comparing percentage of Glut1+ T cells in global and HBV-specific CD8 T cells (C) and HBV- and CMV-specific T cells (D) in paired samples. (E and F) Comparison of Glut1 expression and 2-NBDG uptake in IFNγ+ HBV- and CMV-specific CD8 T cells, example (E) and summary data (F). p < 0.05; ∗∗p < 0.005; ∗∗∗p < 0.0005.
Figure 2
Figure 2
CD8 T Cell Glut1 Expression Can Be Induced by Hypoxia and Correlates with an Exhausted Phenotype (A) Glut1 expression in HBV-specific CD8 T cells, detected by HLA-A2 dextramer staining in paired PBMC and intrahepatic lymphocytes (IHL) directly ex vivo, gated for CD3+CD8+CD4- T cells. (B) Summary data of Glut1 expression on global CD8 T cells from PBMCs and IHL. (C) PBMCs were cultured and restimulated with specific peptides on day 10 for 16 hr in hypoxic (5% O2) or normoxic (21% O2) conditions to analyze Glut1 mean fluorescence intensity (MFI) in HBV- and CMV-specific T cells. (D–F) Glut1 MFI was plotted against expression of (D) co-inhibitory PD-1, (E) percent IFNγ+ HBV-specific T cells, and (F) percent IFNγ+ CMV-specific T cells. (G) Oxygen consumption rates (OCRs) of purified patient-derived PD-1+ and PD-1− CD8 T cells were measured in real-time ex vivo. Cells were stimulated with anti-CD3 and IL-2 at the time of analysis, and mitochondrial inhibitors were added as indicated (oligomycin is used to block mitochondrial complex V, indicating the amount of oxygen utilized for ATP synthesis; FCCP uncouples ATP synthesis from the electron transport chain by transporting electrons across the inner mitochondrial membrane, allowing the calculation of the spare respiratory capacity; and rotenone/antimycin A finally shut down mitochondrial respiration by blocking complexes I and III). neg, negative. (H) The spare respiratory capacity (SRC) was calculated as percent change in mean baseline OCR to mean maximal OCR after the addition of FCCP in the three patients tested in two independent experiments. p < 0.05.
Figure 3
Figure 3
CMV-Specific, but Not HBV-Specific, CD8 T Cells Can Maintain Effector Cytokine Production when Glucose Is Withdrawn (A–C) We cultured PBMCs in complete T cell media before transferring them into media containing either 10 mM glucose or 10 mM galactose for 24 hr before restimulation. Representative example (A) and summary data showing the magnitude of the virus-specific (B) IFNγ and (C) TNF response in galactose, plotted as fold reduction compared to response in glucose (set to 1, indicated as a line in the graphs). Mean response is indicated with gray bars, and individual responses are indicated with dots. (D and E) Comparison of MM in cultured HBV- and CMV-specific T cells by MitoTracker Green staining, representative histograms, and summary data (D) and in dextramer+ virus-specific T cells ex vivo after 4-hr stimulation with cognate peptide; representative histograms and summary data (E). (F) Determination of mitochondrial polarization state by staining with the ratiometric dye JC-1. Red JC-1 staining indicates polarized mitochondria, while loss of red fluorescence shows depolarization. Example fluorescence-activated cell sorting (FACS) plot and comparison of the ratio of polarized/depolarized mitochondria in HBV- and CMV-specific T cells from the same patients. ∗∗p < 0.005.
Figure 4
Figure 4
Stimulation with the Pro-inflammatory Cytokine IL-12 Recovers HBV-Specific Responses even when Glycolysis Is Suppressed (A) PBMCs were stimulated with HBV-derived peptides in the presence or absence of IL-12, cultured for 9 days, and transferred into media containing either 10 mM glucose or 10 mM galactose for 24 hr before peptide restimulation for functional analysis. Representative FACS plots of the percentage of IFNγ+ CD8 cells when cultured in glucose or galactose and stimulated with HBV peptides, with or without IL-12, or IL-12 alone. (B) Summary data showing the IFNγ response to HBV peptides in galactose alone, galactose with IL-12, or glucose with IL-12, plotted as the fold change compared to the response of cells stimulated in glucose alone (set to 1, indicated as line in the graph). The mean response is indicated with gray bars, and individual responses are indicated with dots. (C) Change in mitochondrial polarization upon stimulation of HBV-specific T cells with IL-12, representative staining with JC-1 (left), and summary data comparing the ratio of polarized to depolarized mitochondria (right). p < 0.05; ∗∗p < 0.005.

References

    1. Barber D.L., Wherry E.J., Masopust D., Zhu B., Allison J.P., Sharpe A.H., Freeman G.J., Ahmed R. Restoring function in exhausted CD8 T cells during chronic viral infection. Nature. 2005;439:682–687. - PubMed
    1. Boni C., Fisicaro P., Valdatta C., Amadei B., Di Vincenzo P., Giuberti T., Laccabue D., Zerbini A., Cavalli A., Missale G. Characterization of Hepatitis B virus (HBV)-specific T-cell dysfunction in chronic HBV infection. J. Virol. 2007;81:4215–4225. - PMC - PubMed
    1. Chang C.-H., Curtis J.D., Maggi L.B., Jr., Faubert B., Villarino A.V., O’Sullivan D., Huang S.C.-C., van der Windt G.J.W., Blagih J., Qiu J. Posttranscriptional control of T cell effector function by aerobic glycolysis. Cell. 2013;153:1239–1251. - PMC - PubMed
    1. Ferrari C. HBV and the immune response. Liver Int. 2015;35(Suppl. 1):121–128. - PubMed
    1. Finlay D.K., Rosenzweig E., Sinclair L.V., Feijoo-Carnero C., Hukelmann J.L., Rolf J., Panteleyev A.A., Okkenhaug K., Cantrell D.A. PDK1 regulation of mTOR and hypoxia-inducible factor 1 integrate metabolism and migration of CD8+ T cells. J. Exp. Med. 2012;209:2441–2453. - PMC - PubMed

MeSH terms