. 2016 Jul 25:6:29752.
doi: 10.1038/srep29752.

A high-content image-based method for quantitatively studying context-dependent cell population dynamics

Affiliations

A high-content image-based method for quantitatively studying context-dependent cell population dynamics

Colleen M Garvey et al. Sci Rep. .

Abstract

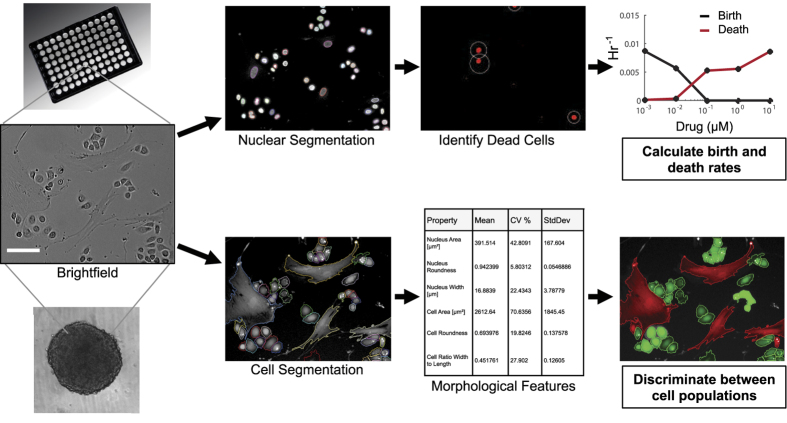
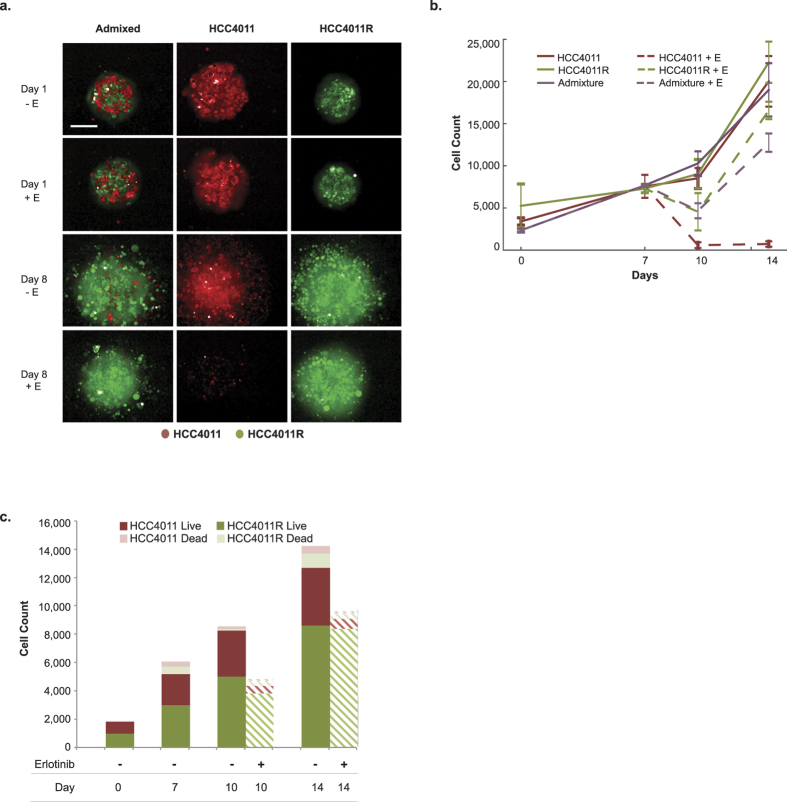
Tumor progression results from a complex interplay between cellular heterogeneity, treatment response, microenvironment and heterocellular interactions. Existing approaches to characterize this interplay suffer from an inability to distinguish between multiple cell types, often lack environmental context, and are unable to perform multiplex phenotypic profiling of cell populations. Here we present a high-throughput platform for characterizing, with single-cell resolution, the dynamic phenotypic responses (i.e. morphology changes, proliferation, apoptosis) of heterogeneous cell populations both during standard growth and in response to multiple, co-occurring selective pressures. The speed of this platform enables a thorough investigation of the impacts of diverse selective pressures including genetic alterations, therapeutic interventions, heterocellular components and microenvironmental factors. The platform has been applied to both 2D and 3D culture systems and readily distinguishes between (1) cytotoxic versus cytostatic cellular responses; and (2) changes in morphological features over time and in response to perturbation. These important features can directly influence tumor evolution and clinical outcome. Our image-based approach provides a deeper insight into the cellular dynamics and heterogeneity of tumors (or other complex systems), with reduced reagents and time, offering advantages over traditional biological assays.


Figures

Figure 1
Figure 1. Schematic overview of experimental workflow.
Images of cells in monolayer or dissociated from 3D spheroids are subjected to nuclear or cellular segmentation. Downstream analyses can include generating live and dead cell counts to calculate birth and death rates or quantification of morphology characteristics which can be used to discriminate between different cell populations. This assay design generates quantitative outputs characterizing multiple cellular phenotypes in a high-throughput manner.
Figure 2
Figure 2. Quantitating the birth-death processes of multiple cell populations under selective pressures.
(a) Representative images showing Hoechst (white) and propidium iodide (orange) staining of H3255 and HCC4011 cells treated with erlotinib (0.1 μM). Live and dead cell counts were obtained by segmenting nuclei and identifying dead cells based on propidium iodide intensity levels. Birth and death rates were then calculated for each cell type in response to erlotinib (0–10 μM) and oxygen perturbation (21%- normoxia and 0.1% O2– severe hypoxia). (b) Net growth rates (units = 1/hour), represented by heatmap color, of H3255 cell line exposed to 40 different microenvironmental contexts. Drug (x-axis), oxygen (O2), glucose (gluc), and fibroblasts (F) were the micreonvironmetal conditions perturbed. (c) HCC4011 (red) and HCC4011R (green) cells were admixed at a starting ratio of 1:1 and treated with 2 μM erlotinib (E) or control as indicated. Representative images of cell populations on day 0 and 3 in the presence or absence of drug are shown. Cell counts were generated based off of Hoechst nuclei segmentation and dead cells were identified by DRAQ7 staining. HCC4011 and HCC4011R cells were differentiated based upon their fluorescent intensity of RFP and GFP, respectively. Scale bars, 100 μm (a,b).
Figure 3
Figure 3. Morphological changes can be tracked over time to distinguish between populations.
(a) Density plot displaying population distributions of cell area versus cell roundness in H3255 cells in the absence (left; n = 1,014 cells) and presence (right; n = 499 cells) of 1 μM erlotinib (E). Cells were segmented based on CellTracker orange intensity thresholds. (b) Nuclear area distribution was tracked over time in H3255 cells with and without 1 μM erlotinib. (c) Top – Representative images of H3255 (red) and CCD-19Lu (blue) classification as compared with labeled fibroblasts (pseudo-stained blue). Bottom Left – Venn diagram illustrates concordance between fluorescent (assumed truth) and morphologic classification of H3255 and CCD-19Lu, which was determined to be 92.6%. Bottom Right - Classification based off of morphological characteristics was evaluated against fluorescence intensity over time and in the presence of erlotinib (1 μM). (d) Cell morphology heterogeneity was evaluated for primary colorectal cancer associated fibroblasts isolated from an individual patient, CAF12347. Parameter values, including cell area, nuclear area, cell roundness and cell width-to-length ratio, were quantitated (n = 41) and cell segmentation mask colors correspond to parameter values for each cell displayed in boxplots. (e) Heterogeneity of cell area across primary colorectal cancer associated fibroblasts isolated from different patients (CAF12347, CAF12380, CAF12415, and CAF12436) was calculated. Scale bars, 200 μm (c) 100 μm (d).
Figure 4
Figure 4. Comparison of HCS platform to standard cell biology assays, MTS and flow cytometry.
(a) Illustrates schematic of experimental design. Cells were admixed at a starting ratio of 1:1 H3255 to H3255R-RFP cells and treated with erlotinib. Following a 72-hour incubation, cell populations were analyzed via MTS, flow cytometry, or our HCS approach. The table summarizes important features of each experimental design including processing time and data outputs. (b) Viability curve displaying the data generated from each assay. The flow cytometry curve remains constant across drug concentrations (at approximately 100% viability) due to loss of dead cells during sample processing and the acquisition of relative counts (not absolute counts) of live cells. (c) Top – Population percentages of H3255 live, H3255 dead, H3255R live, and H3255R dead as determined by flow cytometry and HCS analyses. Bottom – Absolute cell counts generated by HCS over time and in response to erlotinib treatment. (d) Box plot showing the distribution of H3255 and H3255R nuclear area in response to increasing concentrations of erlotinib.
Figure 5
Figure 5. Evaluation of tumor composition in 3D.
(a) Representative maximum projection images of HCC4011 (red), HCC4011R (green), and admixed (1:1 ratio, HCC4011:HCC4011R) spheroids on days 1 and 8 with and without erlotinib (1 μM) treatment. Spheroids were dissociated on days 0,7,10, and 14 and monolayer cultures were stained with Hoechst and DRAQ7 and imaged to generated live and dead cell counts. (b) Average cell count from dissociated tumors was plotted over time for HCC4011, HCC4011R, and admixed tumors. Spheroids were treated with erlotinib on day 7. (c) Bar graph depicting average quantitative changes in HCC4011 and HCC4011R subpopulations (live and dead cell counts) in admixed spheroids over time in response to erlotinib treatment (1 μM).

References

    1. Junttila M. R. & de Sauvage F. J. Influence of tumour micro-environment heterogeneity on therapeutic response. Nature 501, 346–354 (2013). - PubMed
    1. Straussman R. et al.. Tumour micro-environment elicits innate resistance to RAF inhibitors through HGF secretion. Nature 487, 500–504 (2012). - PMC - PubMed
    1. Joyce J. A. & Pollard J. W. Microenvironmental regulation of metastasis. Nature reviews. Cancer 9, 239–252 (2009). - PMC - PubMed
    1. Frick P. L., Paudel B. B., Tyson D. R. & Quaranta V. Quantifying heterogeneity and dynamics of clonal fitness in response to perturbation. Journal of cellular physiology 230, 1403–1412 (2015). - PMC - PubMed
    1. Tyson D. R., Garbett S. P., Frick P. L. & Quaranta V. Fractional proliferation: a method to deconvolve cell population dynamics from single-cell data. Nature methods 9, 923–928 (2012). - PMC - PubMed

Publication types