. 2016 Jul 25:7:12290.
doi: 10.1038/ncomms12290.

Super-resolution spectroscopic microscopy via photon localization

Affiliations

Super-resolution spectroscopic microscopy via photon localization

Biqin Dong et al. Nat Commun. .

Abstract

Traditional photon localization microscopy analyses only the spatial distributions of photons emitted by individual molecules to reconstruct super-resolution optical images. Unfortunately, however, the highly valuable spectroscopic information from these photons have been overlooked. Here we report a spectroscopic photon localization microscopy that is capable of capturing the inherent spectroscopic signatures of photons from individual stochastic radiation events. Spectroscopic photon localization microscopy achieved higher spatial resolution than traditional photon localization microscopy through spectral discrimination to identify the photons emitted from individual molecules. As a result, we resolved two fluorescent molecules, which were 15 nm apart, with the corresponding spatial resolution of 10 nm-a four-fold improvement over photon localization microscopy. Using spectroscopic photon localization microscopy, we further demonstrated simultaneous multi-colour super-resolution imaging of microtubules and mitochondria in COS-7 cells and showed that background autofluorescence can be identified through its distinct emission spectra.


Conflict of interest statement

H.F.Z. and C.S. have financial interests in Opticent Health. V.B. has financial interests in NanoCytomics. Neither of these companies funded this work. All remaining authors declare no competing financial interests.

Figures

Figure 1
Figure 1. The working principle of SPLM.
(a) Schematic of the SPLM system. Upon laser excitation, the fluorescent image was collected by a high-numerical aperture objective lens and subsequently coupled into a Czerny–Turner monochromator by a match tube lens. (b) Both the zero-order and the first-order diffractions from the grating were recorded simultaneously using the same EMCCD camera. (c) Wide-field optical image of the sample consisting of actin monomers labelled by Alexa Fluor 532 and Alexa Fluor 568 with diffraction-limited resolution. (d) The conventional PLM method offers sub-diffraction-limited imaging resolution, but is unable to capture the spectroscopic signature of the individual emitter. Scale bars: 1 μm (c,d). (e) The localization algorithm was used to determine the spatial locations of each blinking, illustrated by numbered crosses. These locations can be further used as the inherent reference points for spectral calibration of the emission spectra in the first-order image, shown as denoted crosses in b. (f) Representative spectra from two individual blinking events (highlighted by the coloured arrows in e). (g) Magnified view of the square region in the PLM image (d). (h) Corresponding colour-coded image by separating the spectra of individual stochastic localizations according to the emission characterization of the two dyes. The spectral regression of nearby localizations indicates the cluster consisted of two single-dye molecules. (i) By averaging the nearby localizations, the SPLM image with spectral regression shows the localization precision of two molecules. Scale bars, 50 nm (gi). (j) Line profiles were used to compare the localization precision of PLM (black dashed line), colour-PLM (coloured dashed lines) and SPLM (coloured solid lines). (k) The super-resolution spectroscopic image was obtained by combining the spatial and spectroscopic information from all localizations. Scale bar, 1 μm.
Figure 2
Figure 2. Differentiating individual molecules by exploiting their heterogeneous fluorescence.
(a) Wide-field optical image and (b) PLM image of actin monomers labelled by Alexa Fluor 568. PLM image was reconstructed from localization coordinates using localization precision as the full-width at half-maximum of a Gaussian kernel. (c) Two nearby clusters are highlighted and localization coordinates are marked by crosses. Scale bars, 200 nm (a,b); 100 nm (c). (d) Emission spectra denoted by coloured circles in c. (e) The corresponding averaged spectra of these two clusters showing distinct emission peaks.
Figure 3
Figure 3. Imaging ex vivo microtubules using SPLM.
(a) Conventional PLM image of two closely spaced microtubules of the square region in the wide-field fluorescence image, as shown in the inset. Scale bar, 200 nm. (b) SPLM image with spectral regression. (c,d) are the line profiles from positions highlighted by the dashed and solid lines in a,b, respectively. (e) Emission spectra along a single microtubule, highlighted by the arrows in b. (f) Magnified view of the spectral variation. The circles indicate the peak positions of each spectrum.
Figure 4
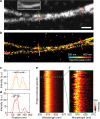
Figure 4. Multi-labelled SPLM imaging.
(a) Wide-field fluorescence image of a dual-stained COS-7 cell. (b) The corresponding SPLM image. Scale bars, 1 μm (a,b). (c) Fluorescence emission spectra of Alexa Fluor 568, Mito-EOS 4b and the distinct emission spectrum from the background. The three colours represent the spectral peak wavelengths of different molecules. Magnified views of the regions inside the coloured squares show (d) a single microtubule, (e) the edge of mitochondria and (f) a spot with autofluorescence emission. Scale bars, 100 nm (df).

References

    1. Nie S. & Emory S. R. Probing single molecules and single nanoparticles by surface-enhanced raman scattering. Science 275, 1102–1106 (1997). - PubMed
    1. Zumbusch A., Holtom G. R. & Xie X. S. Three-dimensional vibrational imaging by coherent anti-Stokes Raman scattering. Phys. Rev. Lett. 82, 4142–4145 (1999).
    1. Weiss S. Measuring conformational dynamics of biomolecules by single molecule fluorescence spectroscopy. Nat. Struct. Biol. 7, 724–729 (2000). - PubMed
    1. van Oijen A. M. et al. Unraveling the electronic structure of individual photosynthetic pigment-protein complexes. Biophys. J. 80, 151a–151a (2001). - PubMed
    1. Moerner W. E. A dozen years of single-molecule spectroscopy in physics, chemistry, and biophysics. J. Phys. Chem. B 106, 910–927 (2002).

Publication types