. 2016 Aug 4;63(3):526-38.
doi: 10.1016/j.molcel.2016.06.017. Epub 2016 Jul 21.

CRISPR-Barcoding for Intratumor Genetic Heterogeneity Modeling and Functional Analysis of Oncogenic Driver Mutations

Affiliations

CRISPR-Barcoding for Intratumor Genetic Heterogeneity Modeling and Functional Analysis of Oncogenic Driver Mutations

Alexis Guernet et al. Mol Cell. .

Abstract

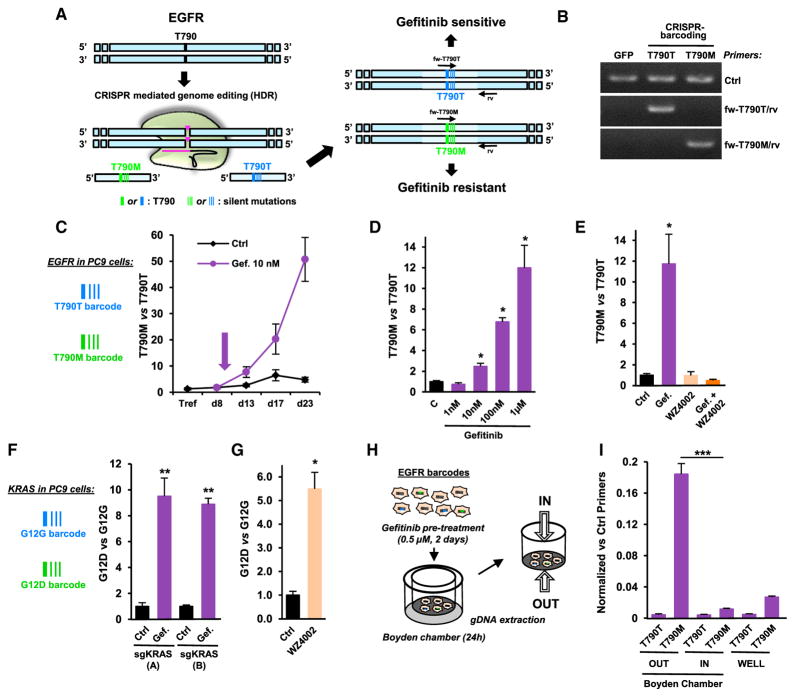
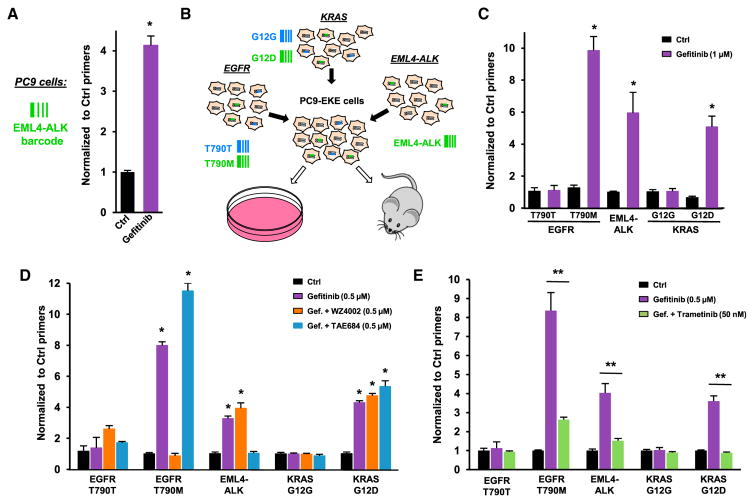
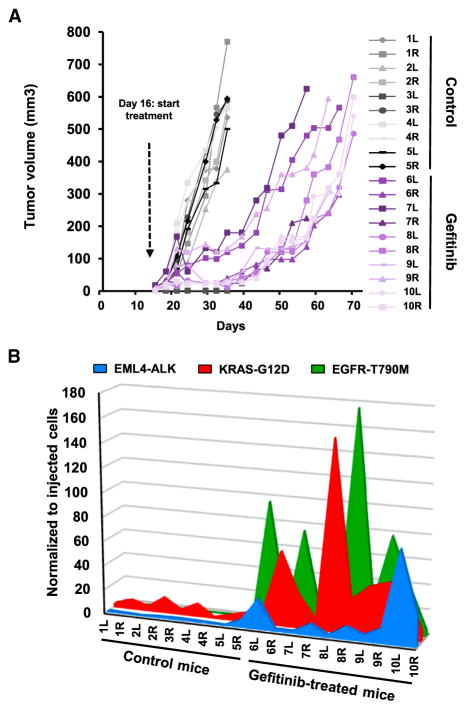
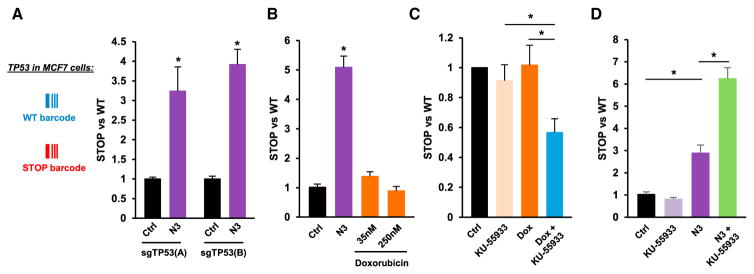
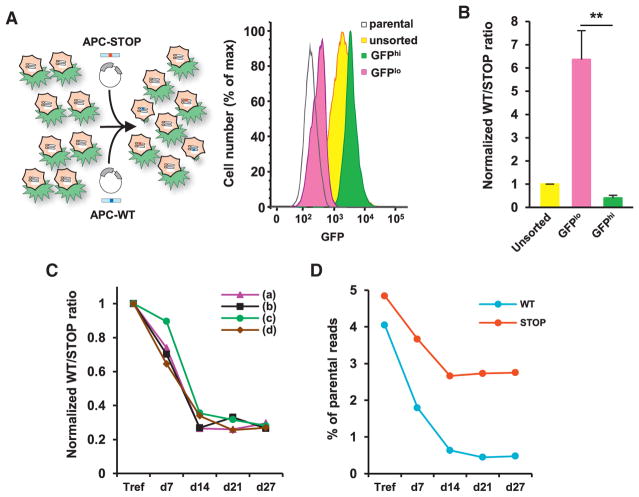
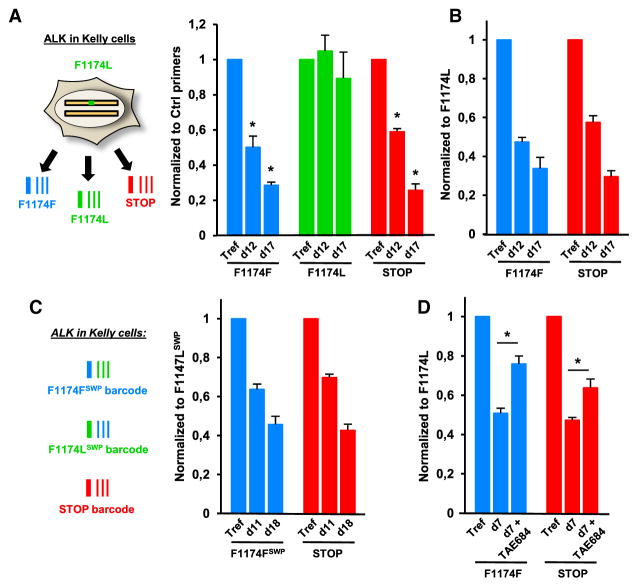
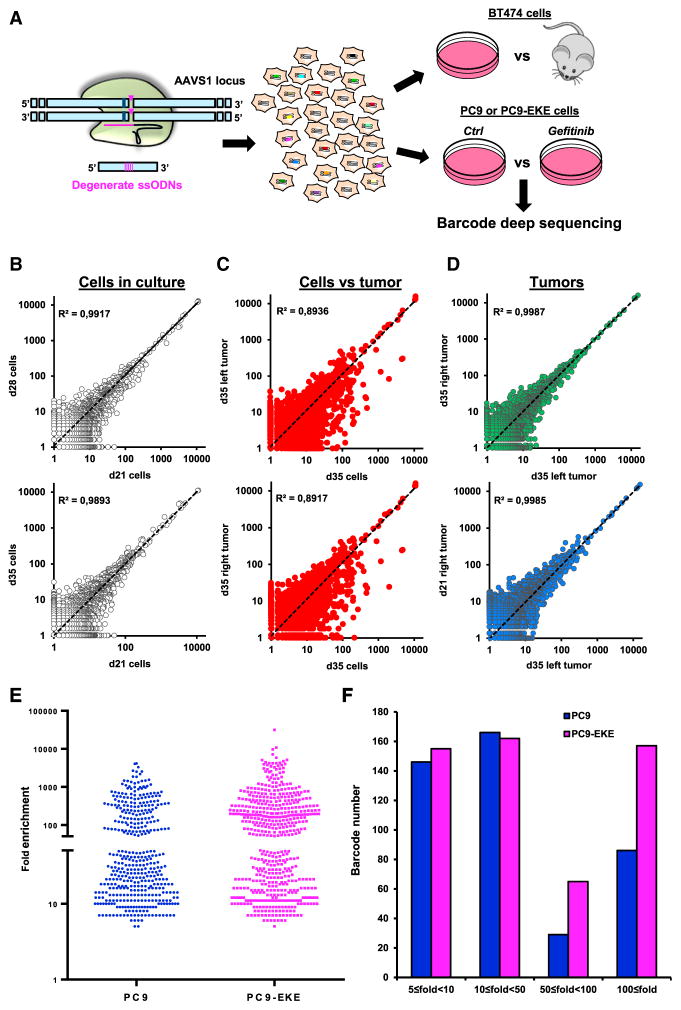
Intratumor genetic heterogeneity underlies the ability of tumors to evolve and adapt to different environmental conditions. Using CRISPR/Cas9 technology and specific DNA barcodes, we devised a strategy to recapitulate and trace the emergence of subpopulations of cancer cells containing a mutation of interest. We used this approach to model different mechanisms of lung cancer cell resistance to EGFR inhibitors and to assess effects of combined drug therapies. By overcoming intrinsic limitations of current approaches, CRISPR-barcoding also enables investigation of most types of genetic modifications, including repair of oncogenic driver mutations. Finally, we used highly complex barcodes inserted at a specific genome location as a means of simultaneously tracing the fates of many thousands of genetically labeled cancer cells. CRISPR-barcoding is a straightforward and highly flexible method that should greatly facilitate the functional investigation of specific mutations, in a context that closely mimics the complexity of cancer.


Figures

Figure 1
Figure 1. CRISPR-Barcoding to Recapitulate NSCLC Resistance to EGFR Inhibitors
(A) Schematic representation of the incorporation of EGFR-T790M and EGFR-T790T (control) barcodes in NSCLC cells. (B) The specificity of the qPCR primers for EGFR barcodes was assessed using gDNA from 293T cells transfected with a control GFP plasmid or the CRISPR/Cas9 vector with either the EGFR-T790T or the EGFR-T790M ssODN. The control (Ctrl) primers allowed amplification of a different, unmodified region of the EGFR gene. (C) Nine days after transfection for EGFR CRISPR-barcoding, PC9 cells were treated in the presence or the absence of gefitinib (10 nM, arrow). qPCR was performed from gDNA extracted at the indicated time points. The results correspond to the mean values of the EGFR-T790M to EGFR-T790T barcode ratio (±SEM; n = 3) of one representative of three independent experiments. (D) PC9 cells containing the EGFR-T790M and EGFR-T790T barcodes were treated for 4 days with the indicated concentrations of gefitinib. Mean ± SEM; n = 4 of one representative of three independent experiments. (E) Effects of 4 days of gefitinib (0.1 μM) and/or WZ4002 (0.5 μM) on the EGFR-T790M to EGFR-T790T ratio. Mean ± SEM; n = 4 of one representative of three independent experiments. (F) Effects of gefitinib (1 μM, 5 days) on the KRAS-G12D to KRAS-G12G ratio in PC9 cells using two distinct sgRNAs (A or B). Mean ± SEM; n = 5 of one representative of four independent experiments. *p < 0.05 and **p < 0.01 compared with control (Mann-Whitney test). (G) Effects of WZ4002 (0.5 μM, 4 days) on the KRAS-G12D to KRAS-G12G ratio. Mean ± SEM; n = 4 of one representative of three independent experiments. (H) Strategy for PC9 cell invasion studies using CRISPR-barcoding. (I) qPCR analysis of EGFR-T790T and EGFR-T790M barcodes from PC9 cells outside (OUT) or inside (IN) the Boyden chamber, or seeded in parallel in a regular well (WELL), as illustrated in (H). The mean values (±SEM; n = 3) of one representative of three independent experiments were normalized to the total amount of gDNA using EGFR_Ctrl primers (B). ***p < 0.001 compared with the cells inside the Boyden chamber (Student’s t test). See also Figure S1.
Figure 2
Figure 2. Multiplex Model for NSCLC Resistance to EGFR Inhibition
(A) EML4-ALK chromosomal inversion was induced in PC9 cells using CRISPR/Cas9, and the fraction of cells containing the EML4-ALK barcode was assessed in the presence or the absence of gefitinib (1 μM, 5 days). The mean values (±SEM; n = 4) of one representative of three independent experiments were normalized to the total amount of gDNA using EGFR_Ctrl primers. (B) Multiplexed CRISPR-barcoding in PC9 cells for in vitro or in vivo studies. (C) Effects of gefitinib (1 μM, 5 days) in PC9-EKE cells. The proportion of each barcode was normalized using EGFR_Ctrl primers. Mean (±SEM; n = 4) of one representative of three independent experiments. (D) Effects of combinations of gefitinib (0.5 μM, 5 days) with WZ4002 (0.5 μM) and TAE684 (0.5 μM) in PC9-EKE cells. Mean (±SEM; n = 4) of one representative of three independent experiments. (E) Effects of gefitinib (0.5 μM, 5 days) with or without trametinib (50 nM) in EKE cells. Mean (±SEM; n = 5) of one representative of three independent experiments. *p < 0.05 and **p < 0.01 compared with Ctrl or gefitinib-treated cells (Mann-Whitney test). See also Figure S2.
Figure 3
Figure 3. NSCLC In Vivo Resistance to Gefitinib
(A) Multiplex CRISPR-barcoded PC9 cells were subcutaneously injected in the left (L) and right (R) flanks of SCID mice, and the volume of the tumors was measured by caliper. At day 16, mice 6–10 were treated with gefitinib (25 mg/kg/day). The mice were sacrificed when at least one of the tumors reached 550 mm3. (B) The fraction of the EML4-ALK, KRAS-G12D, and EGFR-T790M barcodes in each tumor was assessed by qPCR and normalized to the total amount of gDNA. The proportions of the three barcodes in the cells prior to mouse injection were analyzed in parallel and arbitrarily set to 1. See also Figure S2.
Figure 4
Figure 4. Inactivation of the Tumor Suppressor TP53 through CRISPR-Barcoding
(A) Effects of Nutlin-3 (N3; 10 μM, 7 days) on the TP53-STOP to TP53-WT ratio in MCF7 cells using two distinct sgRNAs (A or B). Mean ± SEM; n = 4 of one representative of three independent experiments. *p < 0.05 (Mann-Whitney test). (B) Effects of N3 (10 μM; 7 days) or doxorubicin (Dox) on the TP53-STOP to TP53-WT ratio in HCT-116 cells. Mean ± SEM; n = 4 of one representative of three independent experiments. (C) The cells in (B) were treated for 7 days with KU-55933 (10 μM) and/or Dox (50 nM), and the TP53-STOP to TP53-WT ratio was assessed by qPCR. Mean ± SEM of seven independent experiments. (D) Effects of KU-55933 (10 μM) and/or N3 (10 μM, 7 days) on the TP53-STOP to TP53-WT ratio in HCT-116 cells. Mean ± SEM; n = 4 of one representative of three independent experiments. See also Figure S3.
Figure 5
Figure 5. Repair of the Mutated APC Gene in Colon Cancer Cells
(A) FACS sorting of DLD-1 cells containing the Wnt-responsive GFP reporter and transfected for APC CRISPR-barcoding. (B) APC-WT to APC-STOP ratio in the cells FACS sorted in (A). Mean ± SEM; n = 3 of one representative of three independent experiments. **p < 0.01 (Student’s t test). (C) APC-WT to APC-STOP ratio at different time points after transfection of DLD-1 cells. Mean of one representative of three independent experiments. (D) Deep sequencing analysis of representative gDNA samples used in (C). The percentage of reads containing the APC-WT (WT) and APC-STOP (STOP) barcodes compared with the endogenous sequence is shown. See also Figures S4 and S5.
Figure 6
Figure 6. Repair of the Oncogenic ALK-F1174L Mutation in Neuroblastoma Cells
(A) Relative proportions of the three ALK barcodes in Kelly cells at 3 (Tref) 12 or 17 days after transfection, normalized using ALK_Ctrl primers. Mean ± SEM; n = 4 of one representative of three independent experiments. *p < 0.05 compared with the F1174L control barcode (Mann-Whitney test). (B) The data in (A) were normalized to the ALK-F1174L barcode. (C) The silent mutations on the F1174F and F1174L barcodes were swapped (SWP), and an experiment was performed as in (A) and (B). Mean ± SEM; n = 4 of one representative of three independent experiments. (D) Effects of TAE684 (0.2 μM, 7 days) on normalized ALK-F1174F and ALK-STOP barcodes in Kelly cells. gDNA derived from the same cells at time zero was used as the reference (Tref). Mean ± SEM; n = 4 of one representative of three independent experiments. *p < 0.05 compared with untreated cells (Mann-Whitney test). See also Figure S6.
Figure 7
Figure 7. Probing Intratumor Heterogeneity Using Complex CRISPR-Barcodes
(A) Insertion of a degenerate sequence in the AAVS1 locus of BT474 or PC9 cells. (B) Barcode distribution in BT474 cells maintained in culture for 21, 28, or 35 days. Linear regression was calculated and the coefficient of determination (r2) is shown. (C) Barcode profile in tumors versus the corresponding cell cultures (35 days after inoculation). (D) Barcode distribution in different tumors from the same (up) or different (low) mice. (E) Distribution of enriched AAVS1 barcodes in PC9 and PC9-EKE cells treated with or without gefitinib (1 μM, 14 days). Each dot represents a unique barcode upregulated at least 5-fold compared with the control cells in each of the four gefitinib replicates. (F) The barcodes in (E) are represented according to their mean fold enrichment in the presence of gefitinib. See also Figure S7.

Comment in

References

    1. Avraham R, Yarden Y. Feedback regulation of EGFR signalling: decision making by early and delayed loops. Nat Rev Mol Cell Biol. 2011;12:104–117. - PubMed
    1. Bhang HE, Ruddy DA, Krishnamurthy Radhakrishna V, Caushi JX, Zhao R, Hims MM, Singh AP, Kao I, Rakiec D, Shaw P, et al. Studying clonal dynamics in response to cancer therapy using high-complexity barcoding. Nat Med. 2015;21:440–448. - PubMed
    1. Boettcher M, McManus MT. Choosing the right tool for the job: RNAi, TALEN, or CRISPR. Mol Cell. 2015;58:575–585. - PMC - PubMed
    1. Cheung NK, Dyer MA. Neuroblastoma: developmental biology, cancer genomics and immunotherapy. Nat Rev Cancer. 2013;13:397–411. - PMC - PubMed
    1. Choi PS, Meyerson M. Targeted genomic rearrangements using CRISPR/Cas technology. Nat Commun. 2014;5:3728. - PMC - PubMed

MeSH terms