. 2016 Aug 4;63(3):457-69.
doi: 10.1016/j.molcel.2016.06.021. Epub 2016 Jul 21.

Identification of PGAM5 as a Mammalian Protein Histidine Phosphatase that Plays a Central Role to Negatively Regulate CD4(+) T Cells

Affiliations

Identification of PGAM5 as a Mammalian Protein Histidine Phosphatase that Plays a Central Role to Negatively Regulate CD4(+) T Cells

Saswati Panda et al. Mol Cell. .

Abstract

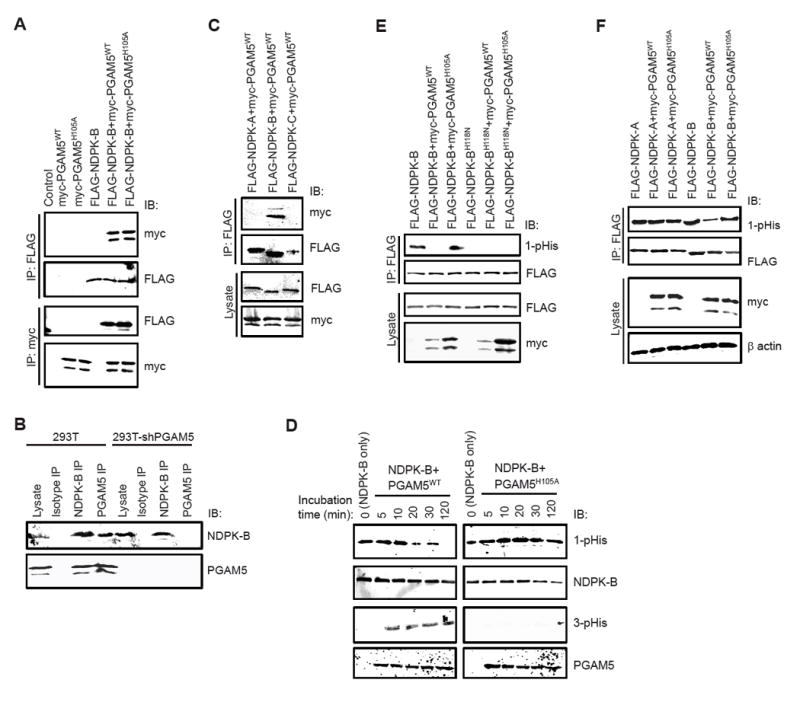
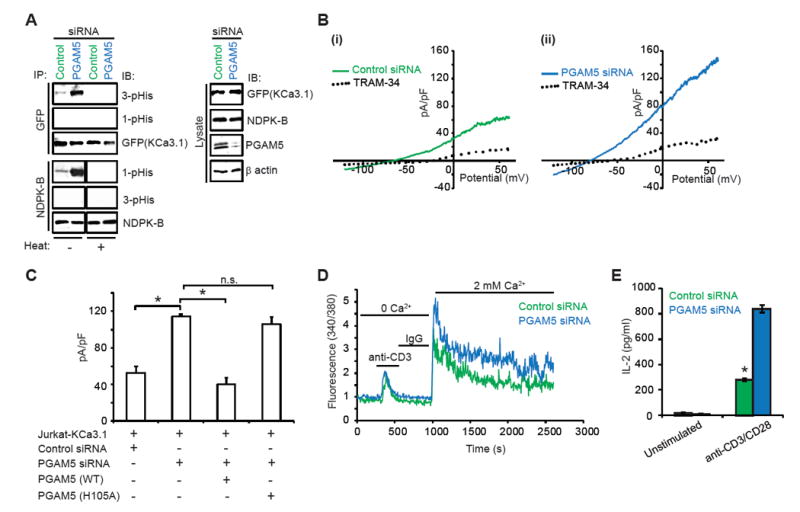
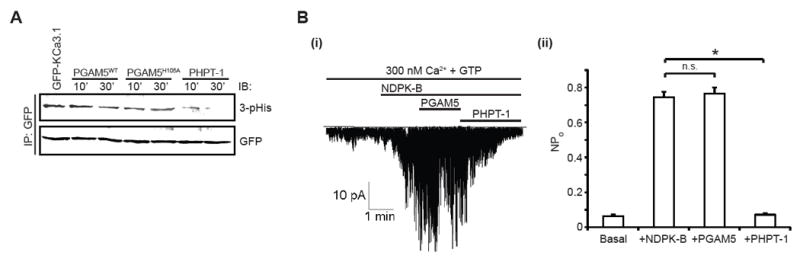
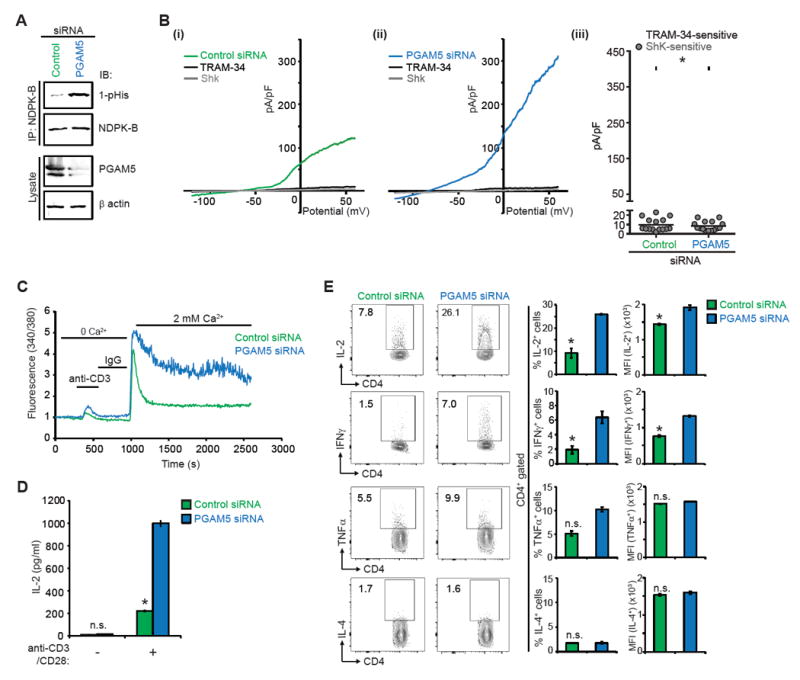
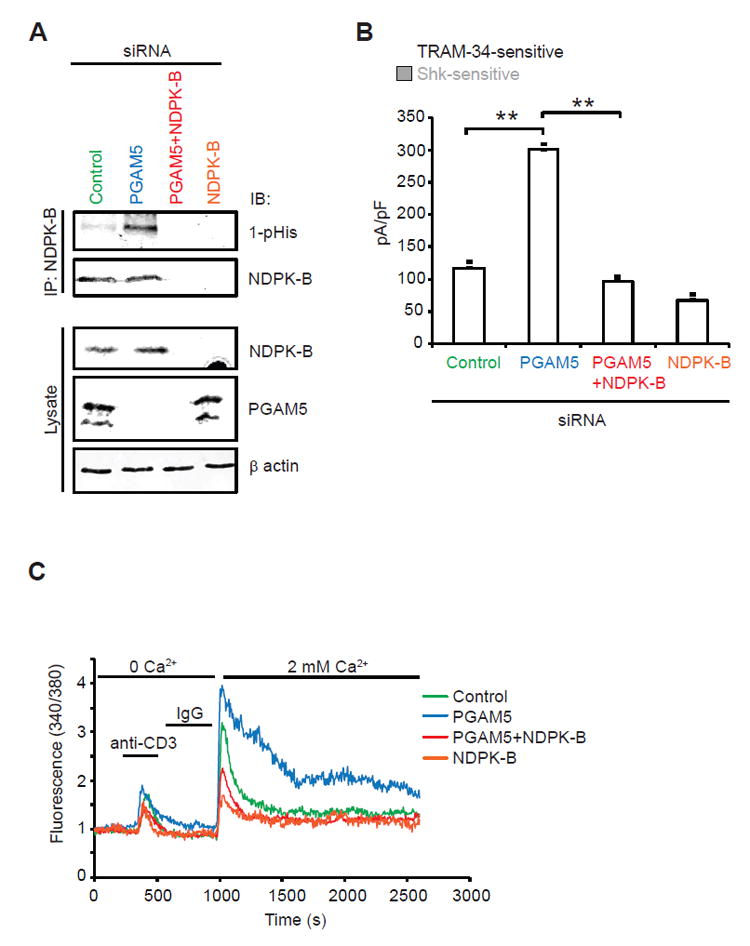
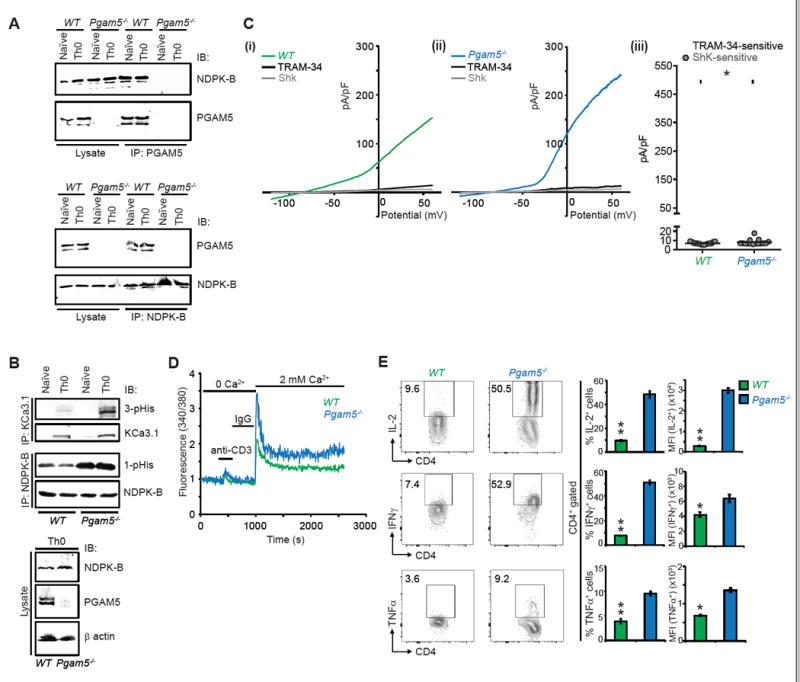
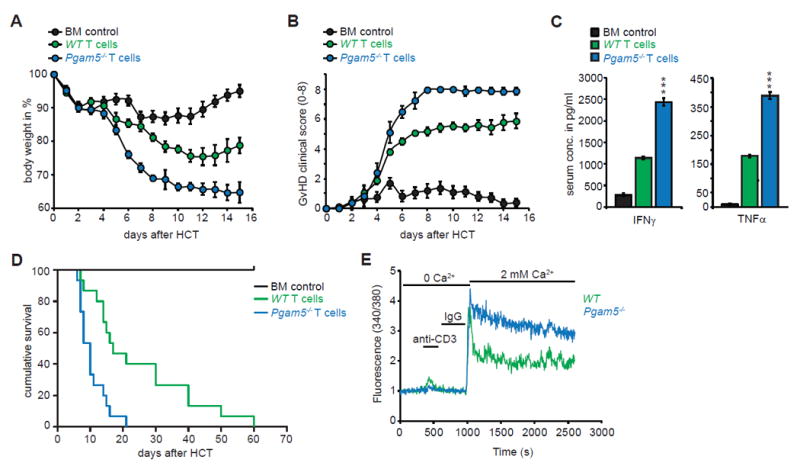
Whereas phosphorylation of serine, threonine, and tyrosine is exceedingly well characterized, the role of histidine phosphorylation in mammalian signaling is largely unexplored. Here we show that phosphoglycerate mutase family 5 (PGAM5) functions as a phosphohistidine phosphatase that specifically associates with and dephosphorylates the catalytic histidine on nucleoside diphosphate kinase B (NDPK-B). By dephosphorylating NDPK-B, PGAM5 negatively regulates CD4(+) T cells by inhibiting NDPK-B-mediated histidine phosphorylation and activation of the K(+) channel KCa3.1, which is required for TCR-stimulated Ca(2+) influx and cytokine production. Using recently developed monoclonal antibodies that specifically recognize phosphorylation of nitrogens at the N1 (1-pHis) or N3 (3-pHis) positions of the imidazole ring, we detect for the first time phosphoisoform-specific regulation of histidine-phosphorylated proteins in vivo, and we link these modifications to TCR signaling. These results represent an important step forward in studying the role of histidine phosphorylation in mammalian biology and disease.

Keywords: PGAM5; T cell activation; histidine phosphorylation; protein histidine phosphatases.


Figures

Figure 1
Figure 1. PGAM5 specifically interacts with NDPK-B and functions as a histidine phosphatase to dephosphorylate H118 on NDPK-B
(A) Whole cell lysates from HEK 293T cells over-expressing FLAG-NDPK-B and myc-PGAM5 (WT or H105A mutant) were immuno-precipitated (IP) with anti-FLAG or anti-myc antibodies followed by immunoblotting (IB) with anti-myc or anti-FLAG antibodies as indicated. (B) Co-IP of endogenous NDPK-B and PGAM5 in HEK 293T cells. Lysates from control or PGAM5 shRNA transfected cells were subjected to IP with isotype control antibody or NDPK-B or PGAM5 antibodies and blots were probed as indicated. The association was specific as demonstrated by the failure of either NDPK-B or PGAM5 to be immunoprecipitated with isotype control antibodies and the failure of anti-PGAM5 antibodies to co-IP NDPK-B in PGAM5 siRNA transfected cells. (C) FLAG-NDPK-A, NDPK-B, or NDPK-C were transfected into HEK 293T cells together with myc-PGAM5WT and lysates were subjected to anti-FLAG IP followed by IB with anti-myc or anti-FLAG antibodies as shown. (D) Purified GST-tagged NDPK-BWT was auto-phosphorylated with GTP and then incubated with His-tagged PGAM5WT or PGAM5 mutant (PGAM5H105A) for various times as indicated. Purity of His-tagged PGAM5 proteins was assessed by coomassie blue staining (Figure S2A). Samples were resolved by SDS/PAGE under basic conditions and immunoblotted with anti-1-pHis, 3-pHis, NDPK-B and PGAM5 antibodies as indicated. (E) FLAG-NDPK-B (WT or H118N) was transfected into 293T cells along with myc-PGAM5WT or PGAM5H105A. Lysates were IP with anti-FLAG antibodies and IB with anti-1-pHis and anti-NDPK-B antibodies. Relative levels of over-expressed PGAM5 and NDPK-B were 3-5 fold higher compared to the endogenous protein levels (Figure S2B). (F) 293T cells were transfected with FLAG-NDPK-A or NDPK-B along with myc-PGAM5 (WT or H105A mutant). Lysates were probed with anti-myc and anti-β actin antibodies as indicated. Lysates were subjected to anti-FLAG IP and IB with anti-FLAG and anti-1-pHis antibodies (to detect NDPK phosphorylation). Data are representative of three independent experiments. See also Figures S1, S2 and S7.
Figure 2
Figure 2. PGAM5 negatively regulates KCa3.1 activity in Jurkat T cells
(A) Jurkat T cells over-expressing GFP-KCa3.1 (Jurkat-KCa3.1 cells) were transfected with PGAM5 or control siRNA. Lysates were IP with anti-NDPK-B or anti-GFP (KCa3.1) antibodies and IB with antibodies to 1-pHis, 3-pHis, NDPK-B and GFP antibodies as indicated. Half of the IPs were also heated at 80°C for 2 min prior to loading to ensure specificity of detection of histidine phosphorylation (histidine phosphorylation is heat-sensitive). Lysates were probed with antibodies to GFP (KCa3.1), NDPK-B, PGAM5 (to demonstrate knockdown of PGAM5), and β actin (as a loading control). (B) KCa3.1 channel activity (TRAM-34 sensitive) was determined by whole-cell patch clamp on Jurkat-KCa3.1 T cells transfected with (i) control or (ii) PGAM5 siRNA. Shown are I/V plots of the cells, as previously described (Srivastava et al., 2006a). TRAM-34 is a specific inhibitor of KCa3.1 channel activity. (C) Bar graph summary of TRAM-34-sensitive current in cells transfected with control or PGAM5 siRNA and PGAM5-knockdown cells rescued with siRNA-resistant PGAM5 (WT or H105A mutant), plotted at +60 mV (n = 15 to 20 cells each). (D) Calcium flux was performed in cells re-stimulated with anti-CD3, loaded with Fura-2 AM (5 μM) and attached to a poly-L-lysine-coated coverslip for 20 min. Ca2+ imaging was done with an IX81 epifluorescence microscope (Olympus) and data were analyzed using OpenLab imaging software (Improvision) (n= 80–100 cells for each series), as previously described (Srivastava et al., 2009). (E) ELISA to quantify IL-2 in the supernatants of control or PGAM5 siRNA transfected cells at 48h post transfection. Data are representative of three independent experiments. Data are shown as mean±SEM. Statistical significance was calculated using Student’s t test; *(p<0.05); **(p<0.01); n.s. (p>0.05). See also Figure S3.
Figure 3
Figure 3. PGAM5 does not directly dephosphorylate or inactivate KCa3.1
(A) GFP-tagged KCa3.1 was immuno-precipitated by GFP antibody from 293-KCa3.1 GFP cells and incubated with purified His-tagged PGAM5 (WT or H105A mutant) or His-tagged PHPT-1 for various time points as indicated. Samples were resolved by SDS/PAGE under basic conditions and immunoblotted with 3-pHis and GFP antibodies as indicated. (B) (i) Inside-out (I/O) patches were isolated from 293-KCa3.1 cells. Single channel activity was then recorded in I/O patches that were first incubated with GST-NDPK-B in the presence of 300 nM Ca2+ and GTP. This was followed by addition of His-tagged PGAM5 and His-tagged PHPT-1 to the same patch as indicated in the trace. (ii) Effect of NDPK-B, PGAM5 and PHPT-1 on the open channel probability, NPo. Bar graph represents KCa3.1 NPo as described in (Bi). All recordings in (B) were at +100 mV. Data are representative of three independent experiments. Data are shown as mean±SEM. Statistical significance was calculated using Student’s t test; *(p<0.05); not significant (n.s.) (p>0.05).
Figure 4
Figure 4. PGAM5 controls activation of primary human CD4+ T cells
(A-E) Primary human naïve CD4+ T cells were transfected with PGAM5 or control siRNA, rested overnight, and then activated with anti-CD3 and anti-CD28 antibodies for 48h to generate Th0 CD4+ T cells, unless otherwise stated. (A) Lysates were IP with anti-NDPK-B and NDPK-B phosphorylation was assessed by IB with anti-1-pHis antibodies. Lysates were also probed with anti-PGAM5 and anti-β actin antibodies to check for PGAM5 knockdown. (B) Whole cell patch clamp was performed on cells to determine KCa3.1 and Kv1.3 activity. Shown are I/V plots of the cells transfected with: (i) control or (ii) PGAM5 siRNA. (iii) Scatter plot of TRAM-34-sensitive current plotted at +60 mV (n = 15 to 20 cells each). TRAM-34 and ShK are specific inhibitors of KCa3.1 and Kv1.3 channel activity, respectively(Srivastava et al., 2006a). (C) Th0 cells were rested overnight, re-stimulated with anti-CD3, loaded with Fura-2 AM (5 μM) and attached to a poly-L-lysine-coated coverslip for 20 min. Ca2+ imaging was done with an IX81 epifluorescence microscope (Olympus) and data were analyzed using OpenLab imaging software (Improvision) (n= 80–100 cells for each series), as previously described (Srivastava et al., 2009). (D) Quantification of soluble IL-2 secreted by Th0 cells rested overnight and re-stimulated with anti-CD3/CD28 antibodies for 6h. (E) Representative intracellular flow cytometry detecting cytokine expression in cells that were rested overnight and re-stimulated with PMA/ionomycin for 4h (left panel). Shown are %positive (middle panel) and mean fluorescence intensity (MFI) (right panel) of cytokine producing cells. Data are representative of three independent experiments. Data are shown as mean±SEM. Statistical significance was calculated using Student’s t test; *(p<0.05); **(p<0.01); not significant (n.s.) (p>0.05). See also Figure S4.
Figure 5
Figure 5. PGAM5 counteracts human CD4+ T cell activation through NDPK-B de-phosphorylation
(A-C) Primary human naïve CD4+ T cells were transfected with a control siRNA, siRNA pool to PGAM5, NDPK-B or both, rested overnight, and then activated with anti-CD3 and anti-CD28 antibodies for 48h (to generate Th0 CD4+ T cells). (A) NDPK-B was IP from cell lysates and IB with antibodies to 1-pHis and NDPK-B to assess NDPK-B 1-pHis phosphorylation. Lysates were IB with anti-NDPK-B and anti-PGAM5 to demonstrate knockdown of each protein and anti-β actin as a loading control. (B) Whole cell patch clamp of cells as described in Figure 4B. Shown is a bar graph summary of TRAM-34-sensitive and Shk-sensitive currents plotted at +60 mV (n = 15 to 20 cells each). (C) Ca2+ flux was determined as shown in Figure 4C (n= 80–100 cells for each series). Data are representative of three independent experiments. Data are shown as mean±SEM. Statistical significance was calculated using Student’s t test; *(p<0.05); **(p<0.01); n.s. (p>0.05).
Figure 6
Figure 6. PGAM5 negatively regulates activation of mouse CD4+ T cells
(A-E) Naïve CD4+ T cells were isolated from spleens of wild type (WT) or Pgam5-/- mice and activated with anti-CD3 and anti-CD28 antibodies for 48h to generate Th0 cells. (A) Naïve or Th0 WT or Pgam5-/- cell lysates were subjected to IP with anti-NDPK-B and anti-PGAM5 antibodies and IB as indicated. The failure of anti-PGAM5 antibodies to co-IP NDPK-B from Pgam5-/- naïve and Th0 cells demonstrates the interaction is specific as PGAM5 needs to be present for anti-PGAM5 antibodies to co-IP NDPK-B. (B) NDPK-B and KCa3.1 were IP from WT and Pgam5-/- naïve or Th0 cell lysates and probed with antibodies to 1-pHis and NDPK-B for the NDPK-B IP, and 3-pHis and KCa3.1 for the KCa3.1 IP. KCa3.1 is lowly expressed in naïve cells and is induced following activation with anti-CD3/CD28 antibodies (Th0 cells). Th0 cell lysates were blotted with NDPK-B, PGAM5 and β actin as a loading control. (C) Whole cell patch clamp of Th0 cells to determine KCa3.1 activity as described in Figure 2B. Shown are I/V plots of (i) WT and (ii) Pgam5-/- cells and (iii) Scatter plot of TRAM-34 and Shk sensitive currents (n = 15-20 cells each). (D) Th0 cells were rested overnight and then re-stimulated with anti-CD3 for measuring calcium flux as described in Figure 2C (n=80–100 cells for each series). (E) Representative intracellular flow cytometry detecting cytokine expression of WT or Pgam5-/- CD4+ T cells. Th0 cells were rested overnight and re-stimulated with PMA/ionomycin for 4h (left panel). Shown are %positive (middle panel) and mean fluorescence intensity (MFI) (right panel) of cytokine producing cells. Data are representative of three independent experiments. Data are shown as mean±SEM (n=3 mice per group per experiment). Statistical significance was calculated using Student’s t test; *(p<0.05); **(p<0.01); n.s. (p>0.05). See also Figure S5.
Figure 7
Figure 7. Pgam5-/- T cells cause augmented pathogenicity after allogeneic transplantation
(A-E) Host BALB/c mice (H-2d) were lethally irradiated and transplanted with either 1.5 × 10⁶ allogeneic WT or Pgam5-/- T cells isolated from spleens of donor C57BL/6 (H-2b), along with 5 × 10⁶ bone marrow (BM) cells. BM control group received only BM cells. (A) Body weight changes of host mice groups post allogeneic-hematopoietic cell transfer (HCT) (n=15 mice per group). (B) Clinical GvHD scoring (score 0-8) of mice groups post HCT (n=15 mice per group). (C) Serum IFNγ and TNFα analysis at day 6 post HCT using ELISA. Data are compiled from two independent experiments (n=5 mice per group per experiment). (D) Survival of mice groups post HCT (n=15 mice per group). (E) CD4+ T cells were purified from spleens of host mice at day 6 post HCT and calcium flux was performed as described in Figure 2C (n= 80–100 cells for each series). Data shown is representative of two independent experiments. Statistical significance was calculated using Student’s t test (Figure 4C); ***(p<0.001) and log-rank (Mantel-Cox) test (Figure 4D); ****(p<0.0001). See also Figure S6.

Similar articles

Cited by

References

    1. Attwood PV. Histidine kinases from bacteria to humans. Biochem Soc Trans. 2013;41:1023–1028. - PubMed
    1. Attwood PV, Piggott MJ, Zu XL, Besant PG. Focus on phosphohistidine. Amino Acids. 2007;32:145–156. - PubMed
    1. Attwood PV, Wieland T. Nucleoside diphosphate kinase as protein histidine kinase. Naunyn Schmiedebergs Arch Pharmacol. 2015;388:153–160. - PubMed
    1. Besant PG, Attwood PV. Mammalian histidine kinases. Biochim Biophys Acta. 2005;1754:281–290. - PubMed
    1. Boissan M, Dabernat S, Peuchant E, Schlattner U, Lascu I, Lacombe ML. The mammalian Nm23/NDPK family: from metastasis control to cilia movement. Mol Cell Biochem. 2009;329:51–62. - PubMed

Publication types

MeSH terms

LinkOut - more resources