

Effects of d-Methylphenidate, Guanfacine, and Their Combination on Electroencephalogram Resting State Spectral Power in Attention-Deficit/Hyperactivity Disorder
- PMID: 27453081
- PMCID: PMC5003618
- DOI: 10.1016/j.jaac.2016.04.020
Effects of d-Methylphenidate, Guanfacine, and Their Combination on Electroencephalogram Resting State Spectral Power in Attention-Deficit/Hyperactivity Disorder
Abstract
Objective: Psychostimulant medications are the gold standard of treatment for attention-deficit/hyperactivity disorder (ADHD); however, a significant minority (∼30%) of individuals with ADHD fail to respond favorably. Noradrenergic agents are increasingly used as ADHD monotherapies or adjuncts for suboptimal stimulant response, yet knowledge of their cortical effects is limited. This study is the first to examine comparative effects of guanfacine (an α adrenergic 2A agonist), psychostimulant, and their combination on resting state cortical activity in ADHD.
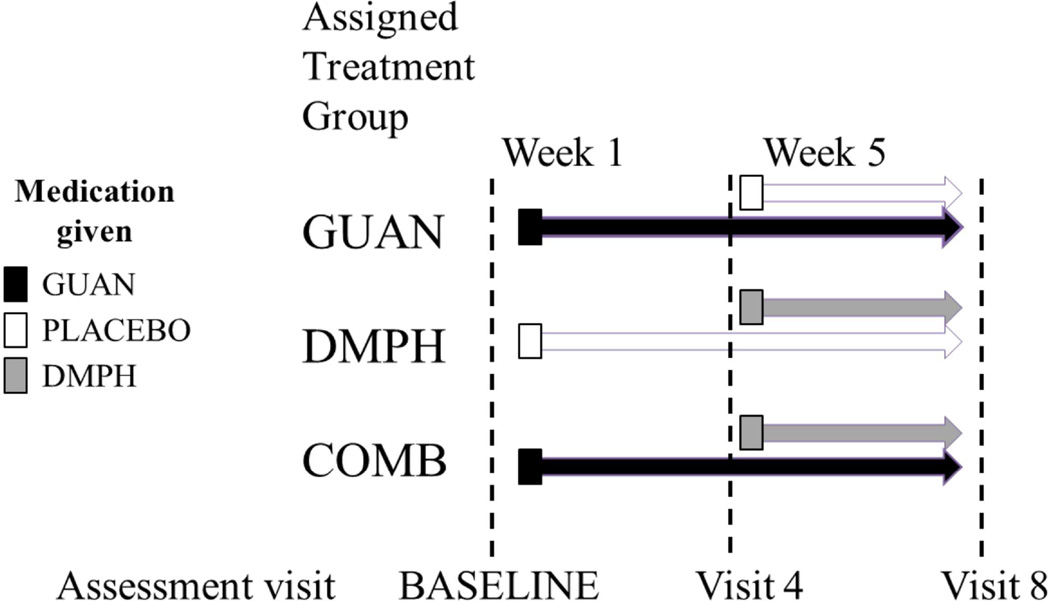
Method: The sample comprised 179 participants aged 7 to 14 years old with ADHD (113 boys, 55 girls). Participants were randomized to 1 of 3 blinded conditions: guanfacine (GUAN), d-methylphenidate (DMPH), or the combination (COMB). Electroencephalography (EEG) was performed pre-, mid-, and post-medication titration, with concomitant assessment of behavioral and cognitive functioning.
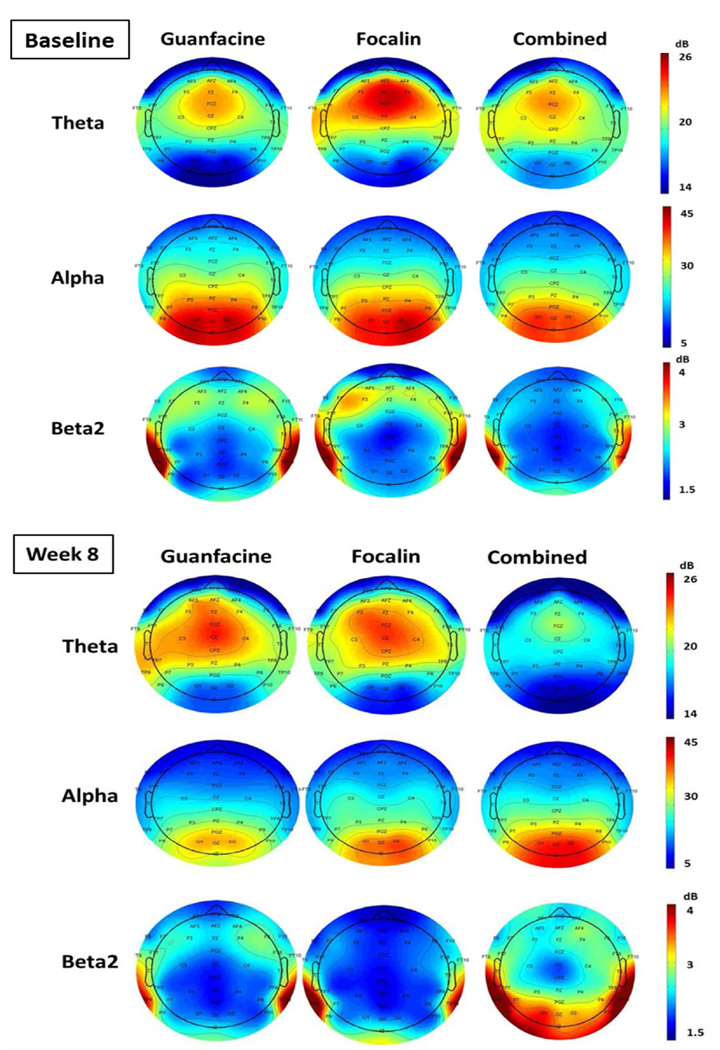
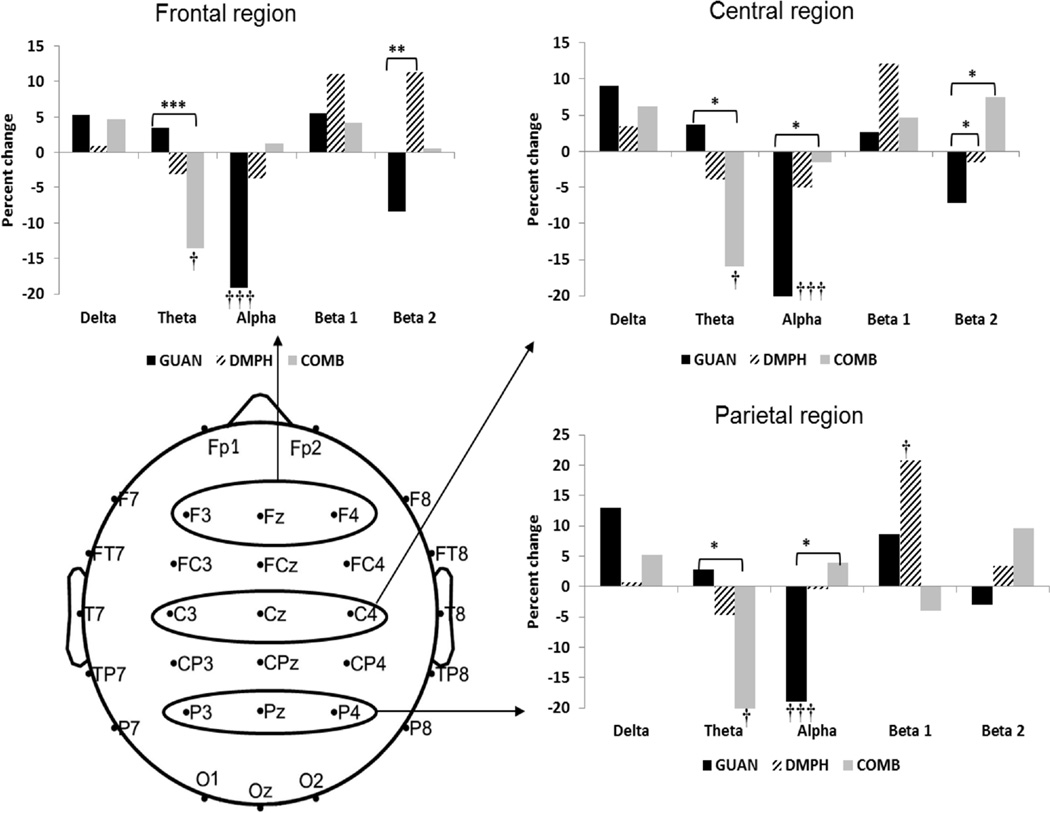
Results: Analyses of spectral power measures during resting EEG suggested that each medication condition displayed a distinct profile of effects on cortical activity. Significant time effects suggested that GUAN decreased global alpha band (8-12 hertz [Hz]) power, DMPH and COMB increased centro-parietal beta band (13-21 Hz) power, and COMB resulted in decreased theta band (4-7 Hz) power. Relative to other medication groups, COMB was associated with significantly lower theta band power and DMPH with higher beta band power compared with those in the GUAN group. Medication-related changes in theta power were correlated with improvements in behavioral and cognitive functioning.
Conclusion: These data reveal distinct underlying medication-related effects on neural mechanisms. The COMB condition uniquely exhibited an EEG profile that was associated with improved behavioral and cognitive functioning. Clinical trial registration information-Single Versus Combination Medication Treatment for Children With Attention Deficit Hyperactivity Disorder; http://clinicaltrials.gov/; NCT00429273.
Keywords: children; electroencephalography; medication; stimulants; treatment.
Copyright © 2016 American Academy of Child and Adolescent Psychiatry. Published by Elsevier Inc. All rights reserved.
Conflict of interest statement
Loo, Cowen, Walshaw Welker, Levitt, Del’Homme, Mr. Cho, and Ms. Sturm report no biomedical financial interests or potential conflicts of interest.
Figures
Comment in
-
Polypharmacy in Attention-Deficit/Hyperactivity Disorder: More Than the Sum of Its Parts?J Am Acad Child Adolesc Psychiatry. 2016 Aug;55(8):641-2. doi: 10.1016/j.jaac.2016.04.021. J Am Acad Child Adolesc Psychiatry. 2016. PMID: 27453075 No abstract available.
References
-
- Snyder SM, Hall JR. A meta-analysis of quantitative EEG power associated with attention-deficit hyperactivity disorder. J Clin Neurophysiol. 2006;23(5):440–455. - PubMed
-
- Arns M, Conners CK, Kraemer HC. A decade of EEG Theta/Beta Ratio Research in ADHD: a meta-analysis. Journal of attention disorders. 2013;17(5):374–383. - PubMed
Publication types
MeSH terms
Substances
Associated data
Grants and funding
LinkOut - more resources
Full Text Sources
Other Literature Sources
Medical
