. 2016 Aug:10:204-15.
doi: 10.1016/j.ebiom.2016.07.012. Epub 2016 Jul 14.

Lactoferrin Suppresses Neutrophil Extracellular Traps Release in Inflammation

Affiliations

Lactoferrin Suppresses Neutrophil Extracellular Traps Release in Inflammation

Koshu Okubo et al. EBioMedicine. 2016 Aug.

Abstract

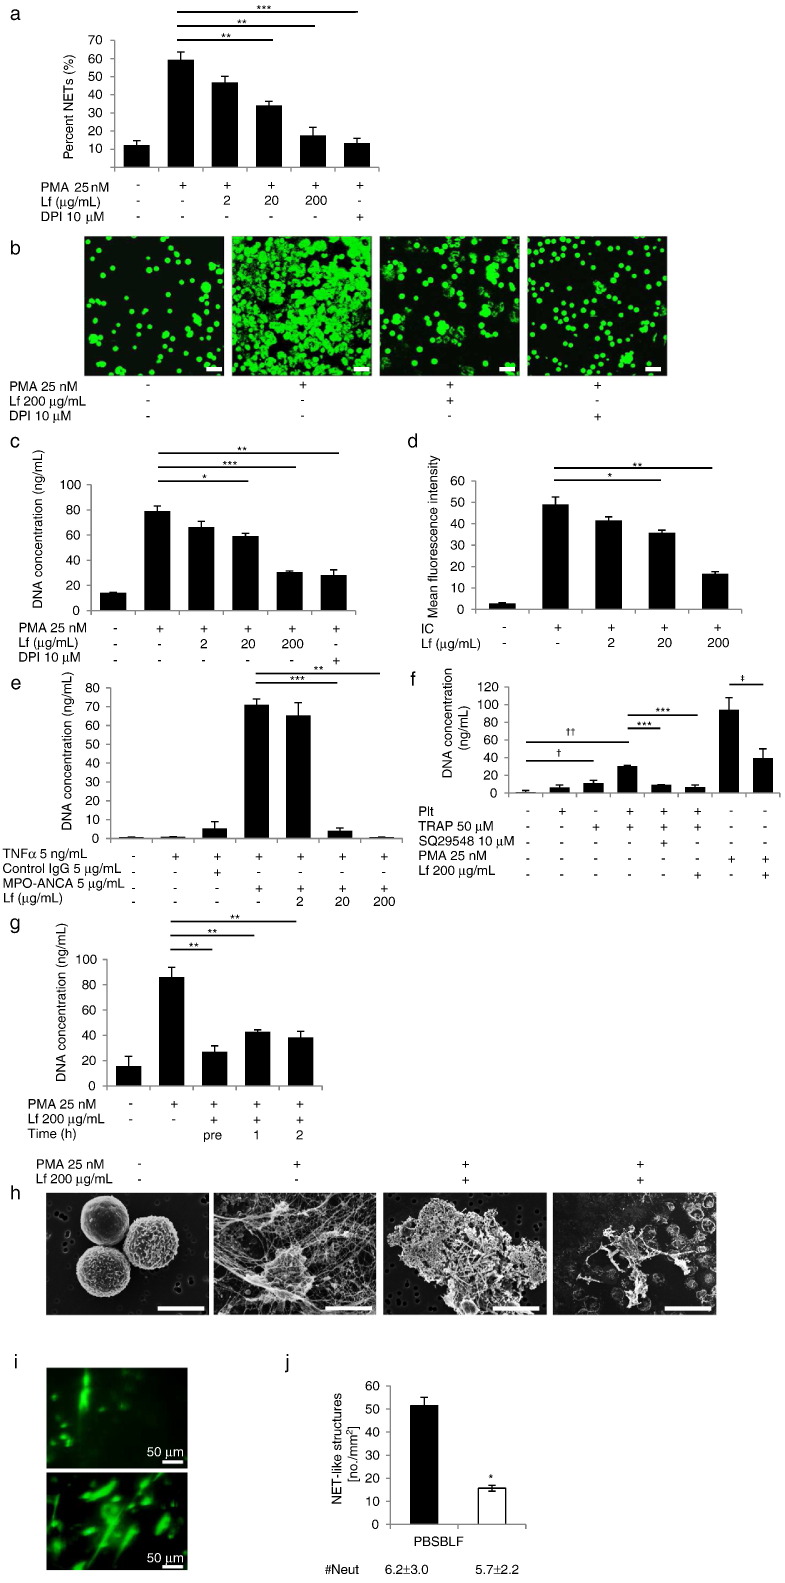
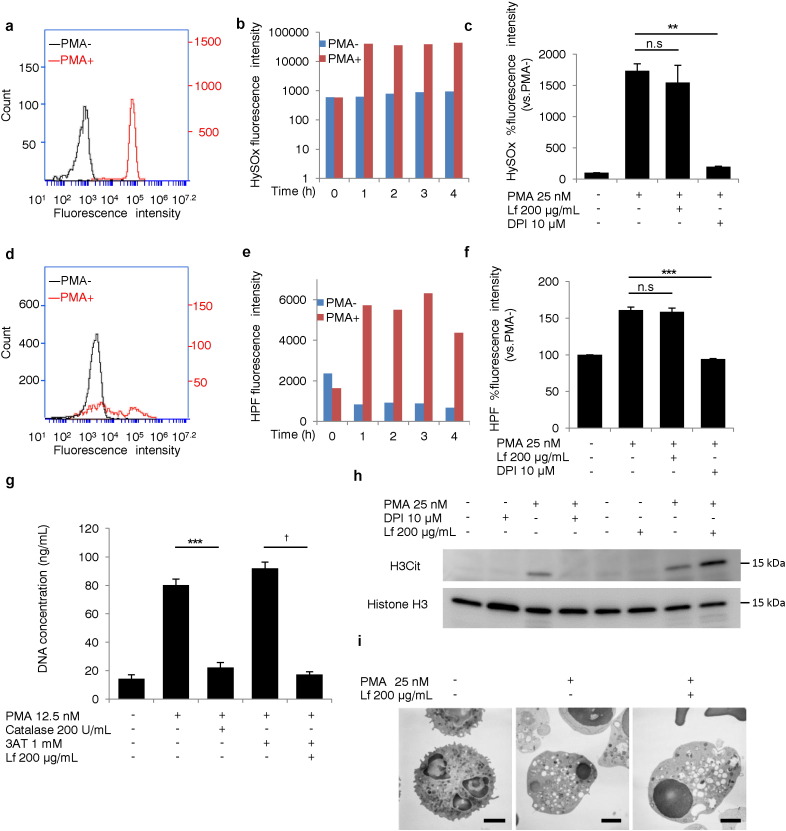
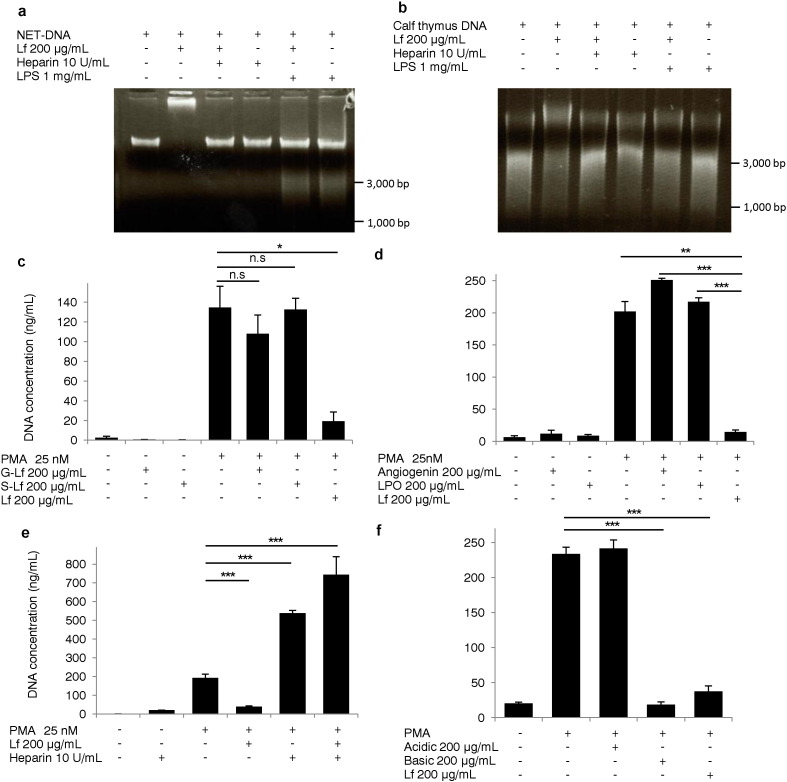
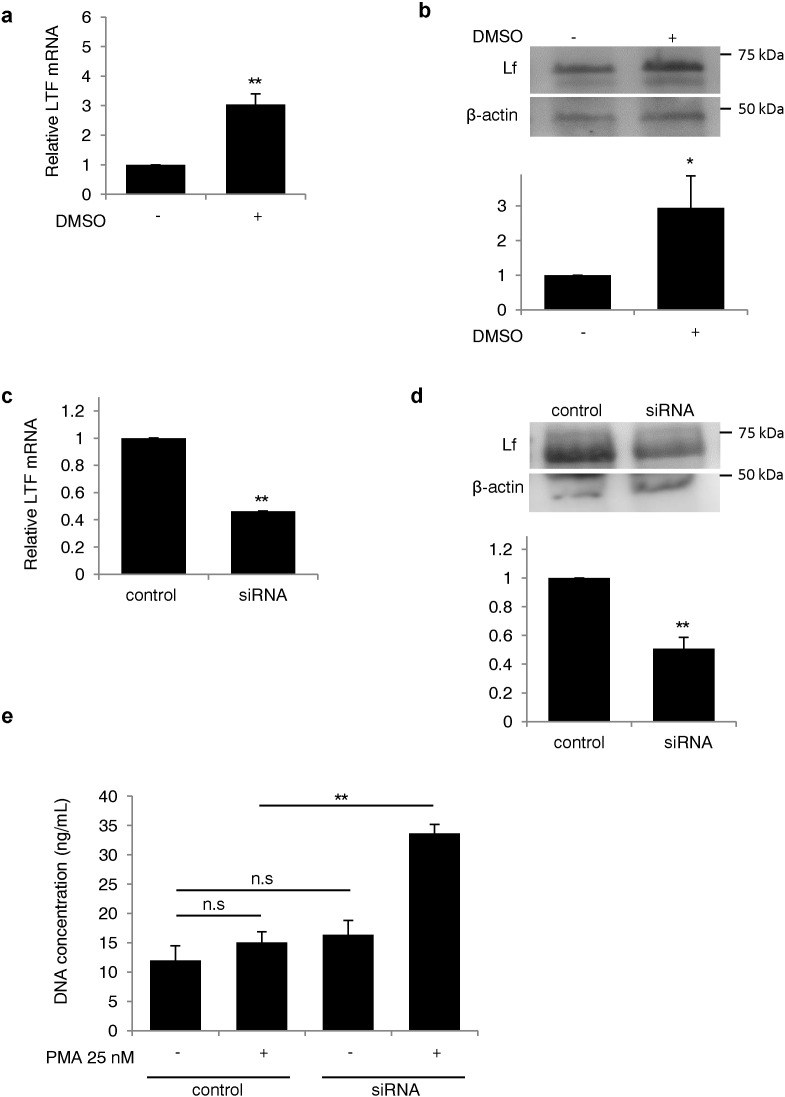
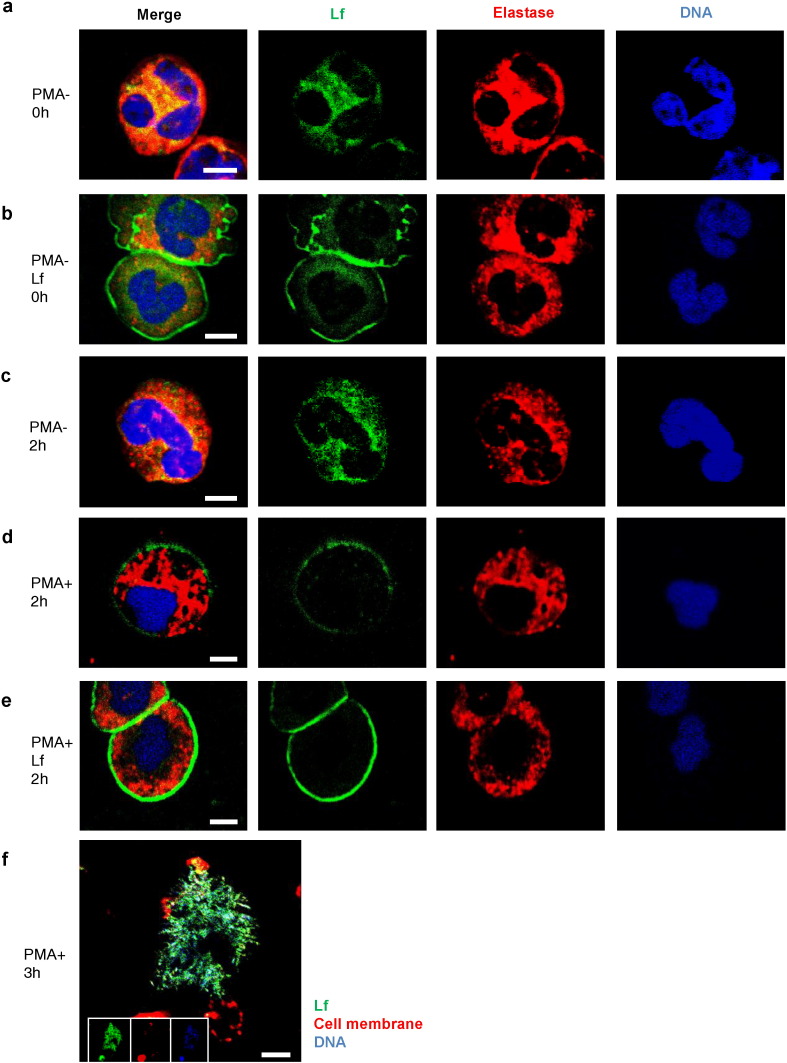
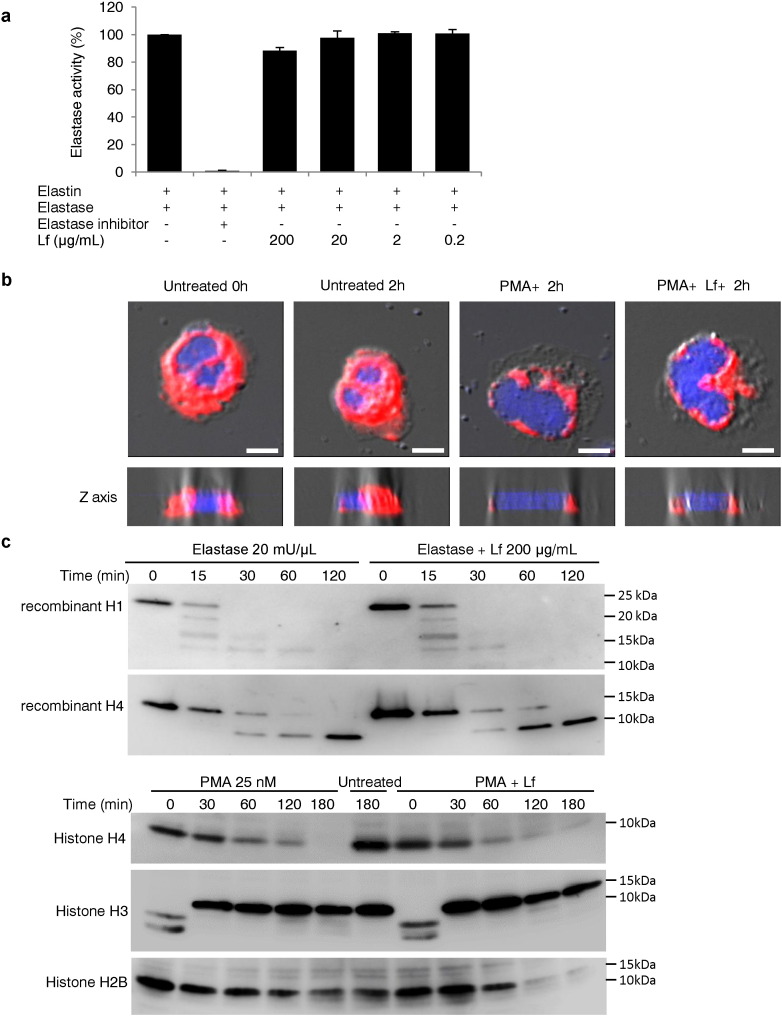
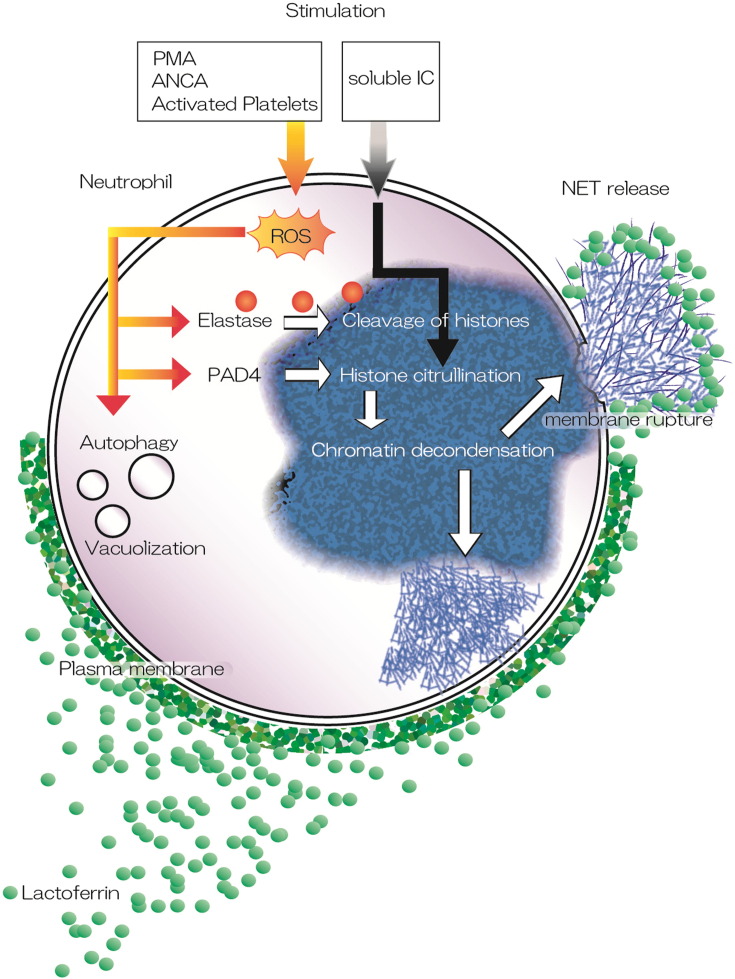
Neutrophils are central players in the innate immune system. They generate neutrophil extracellular traps (NETs), which protect against invading pathogens but are also associated with the development of autoimmune and/or inflammatory diseases and thrombosis. Here, we report that lactoferrin, one of the components of NETs, translocated from the cytoplasm to the plasma membrane and markedly suppressed NETs release. Furthermore, exogenous lactoferrin shrunk the chromatin fibers found in released NETs, without affecting the generation of oxygen radicals, but this failed after chemical removal of the positive charge of lactoferrin, suggesting that charge-charge interactions between lactoferrin and NETs were required for this function. In a model of immune complex-induced NET formation in vivo, intravenous lactoferrin injection markedly reduced the extent of NET formation. These observations suggest that lactoferrin serves as an intrinsic inhibitor of NETs release into the circulation. Thus, lactoferrin may represent a therapeutic lead for controlling NETs release in autoimmune and/or inflammatory diseases.

Keywords: Chromatin; Lactoferrin; Neutrophil extracellular traps (NETs); Oxygen radicals.


Figures

Fig. 1
Fig. 1
Lactoferrhgin inhibited NET formation both in vitro and in vivo. (a) Cells were pretreated with different concentrations of human lactoferrin, and NET formation was induced by 25 nM PMA. NET formation was measured by microscopy at 3 h after PMA stimulation. DPI (10 μM) was used as a positive control. Each group: n = 3, ⁎⁎P < 0.01, ⁎⁎⁎P < 0.001. (b) Images of neutrophils pretreated with 200 μg/mL lactoferrin at 3 h after stimulation. Cells were stained with 500 nM SYTOX Green to detect DNA. Scale bars: 40 μm. NET-DNA release into supernatants induced by PMA (c), soluble IC (d), MPO-ANCA (e), or activated platelets (f) in response to different concentrations of lactoferrin. Each group: n = 3,P < 0.05, ⁎⁎P < 0.01, ⁎⁎⁎P < 0.001, P < 0.05, ††P < 0.001, P < 0.05. (g) NET-DNA release was measured at various times in response to 200 μg/mL lactoferrin. Each group: n = 3, **P < 0.01. (h) Scanning electron microscopy revealed dramatic morphological changes induced by lactoferrin treatment. Individual NET fibers observed without lactoferrin treatment (second left); agglutinated NET fibers in the presence of exogenous lactoferrin (right panels). Scale bars: 5 μm (left panels), 40 μm (right panels). (i, j) NET-like structures were visualized using intravital microscopy. Representative images of animals treated with PBS (lower panel) or bovine lactoferrin (upper panel) are shown (i). The number of NET-like structures per mm2 in the cremaster 3 h after induction of the RPA reaction was quantified (j). P < 0.05. The number of neutrophils (#Neuts) was not significantly different between groups. Data are representative of the means ± SEMs of three experiments.
Fig. 2
Fig. 2
Lactoferrin did not decrease ROS generation or histone H3 citrullination during NETosis. (a–g) Effects of lactoferrin on ROS generation, (h) histone H3 citrullination, and (i) vacuolization during NETosis. The fluorescence intensities of HySOx (a–c) and HPF (d–f) added to the culture medium 30 min before PMA stimulation were measured at the indicated times (b, e) or at 1 h (a, c, d, f). Each group: n = 3, ⁎⁎P < 0.01, ⁎⁎⁎P < 0.001. (g) DNA release into the supernatant was induced with 12.5 nM PMA and was measured in the presence of catalase, lactoferrin, and/or, 3AT. Each group: n = 3, ⁎⁎⁎P < 0.001, P < 0.001. (h) Western blot analysis was used to investigate PMA-induced histone H3 citrullination in response to DPI and lactoferrin treatment. Figures are representative of two independent experiments. (i) Transmission electron microscopy analysis of vacuolization in PMA-stimulated neutrophils. Figures are representative of two independent experiments. Scale bars: 2 μm. Data represent the mean ± SEM.
Fig. 3
Fig. 3
Lactoferrin bound NET-DNA and inhibited NET formation via charge-charge interactions. NET-DNA extracted from human neutrophils (a) and calf thymus DNA (b) treated with or without lactoferrin was analyzed by electrophoresis using 1% agarose gels. NET-DNA release into the supernatants induced by PMA in response to 200 μg/mL of lactoferrin, G-Lf, and S-Lf (c), angiogenin and LPO (d), 10 U/mL heparin (e), or acidic or basic peptides of lactoferrin (f). Each group: n = 3, P < 0.05, ⁎⁎P < 0.01, ⁎⁎⁎P < 0.001. Data are representative of three independent experiments.
Fig. 4
Fig. 4
Silencing of lactoferrin expression enhanced NET formation in HL-60 cells. (a, b) Confirmation of lactoferrin knockdown by siRNA after differentiation of HL-60 cells. (a) Lactoferrin mRNA was measured by real-time PCR after differentiation with 1.25% DMSO. Each group: n = 6, ⁎⁎P < 0.01. (b) Lactoferrin protein levels were measured by Western blot analysis (membrane image: upper panel; quantification of lactoferrin protein normalized to β-actin expression: lower panel. Each group n = 3, P < 0.05). (c, d) Silencing of lactoferrin by siRNA transfection. (c) Lactoferrin mRNA and (d) protein expression were measured in cells transfected with lactoferrin siRNA (membrane image: upper panel; quantification of lactoferrin protein normalized to β-actin expression: lower panel). Each group: n = 5 (c), n = 3 (d), ⁎⁎P < 0.01. (e) The concentration of extracellular DNA in the supernatant was measured following transfection with lactoferrin siRNA. Each group: n = 3, ⁎⁎P < 0.01. Data are representative of the means ± SEMs of three experiments.
Fig. 5
Fig. 5
Lactoferrfebcain localized to the plasma cell membrane during NETosis. (a, c, d) Representative images acquired using immunofluorescence staining of endogenous lactoferrin (green), elastase (red), and DNA (blue) are shown. Both lactoferrin and elastase existed in the cytoplasm of unstimulated neutrophils at 0 h (a) and 2 h (c). (d) Following 2 h of PMA stimulation, lactoferrin localized to the plasma cell membrane. Exogenous lactoferrin added to the culture medium localized to the plasma cell membrane at 0 h (b) and 2 h (e). Scale bars: 5 μm. (f) Web-like DNA structures were positive for lactoferrin (green) and DNA (blue) at 3 h. Scale bar: 10 μm. Data are representative of two independent experiments.
Fig. 6
Fig. 6
Lactoferrin did not suppress the translocation of elastase into the nucleus or elastase-mediated degradation of histones. (a) The fluorescence intensity released from labeled-elastin degraded by elastase was evaluated as a measure of elastase activity. The figure is representative of three independent experiments. (b) Neutrophils pretreated with or without lactoferrin were observed by confocal microscopy stained for elastase (red) or DNA (blue), or observed as differential interference contrast (DIC) images with Z-axis imaging (lower panel) after 2 h of stimulation with PMA. Scale bars: 5 μm. Figures are representative of two independent experiments. (c) Recombinant human histone H1 and H4 pretreated with or without lactoferrin were treated with human elastase. Western blotting analysis was performed as described in the Methods (upper panels). Neutrophils were stimulated with PMA in the presence or absence of lactoferrin using anti-histone H2B, H3, and H4 antibodies (lower panels). Figures are representative of two independent experiments.
Fig. 7
Fig. 7
Proposed mechanism of action of lactoferrin during NET formation. We found that lactoferrin inhibited NET formation induced by various stimulants, such as PMA, MPO-ANCA, and activated platelets. Lactoferrin had no effect on intracellular pathways, such as elastase-mediated degradation of histones or histone citrullination catalyzed by PAD4 following ROS generation. Furthermore, lactoferrin also inhibited soluble IC-induced NET formation, which was independent of ROS generation. Our proposed mechanism showed that lactoferrin prevented the spread of NETs and their release by blocking membrane rupture and causing agglutination of the released chromatin fibers. This figure was produced using Illustrator CC (Adobe Systems Incorporated, USA).

References

    1. Andrews R.K., Arthur J.F., Gardiner E. Neutrophil extracellular traps (NETs) and the role of platelets in infection. Thromb. Haemost. 2014;112:659–665. - PubMed
    1. Apostolidou E., Skendros P., Kambas K., Mitroulis I., Konstantinidis T., Chrysanthopoulou A., Nakos K., Tsironidou V., Koffa M., Boumpas D.T., Ritis K. Ann. Rheum. Dis. 2016;75(1):269–277. (2016 Jan) - PubMed
    1. Bartneck M., Keul H.A., Zwadlo-Klarwasser G., Groll J. Phagocytosis independent extracellular nanoparticle clearance by human immune cells. Nano Lett. 2009;10:59–63. - PubMed
    1. Bellamy W., Takase M., Wakabayashi H., Kawase K., Tomita M. Antibacterial spectrum of lactoferricin B, a potent bactericidal peptide derived from the N-terminal region of bovine lactoferrin. J. Appl. Bacteriol. 1992;73:472–479. - PubMed
    1. Brinkmann V., Reichard U., Goosmann C., Fauler B., Uhlemann Y., Weiss D.S., Weinrauch Y., Zychlinsky A. Neutrophil extracellular traps kill bacteria. Science. 2004;303:1532–1535. - PubMed