. 2016 Aug 11;166(4):1004-1015.
doi: 10.1016/j.cell.2016.06.039. Epub 2016 Jul 21.

Multiple Origins of Virus Persistence during Natural Control of HIV Infection

Affiliations

Multiple Origins of Virus Persistence during Natural Control of HIV Infection

Eli A Boritz et al. Cell. .

Abstract

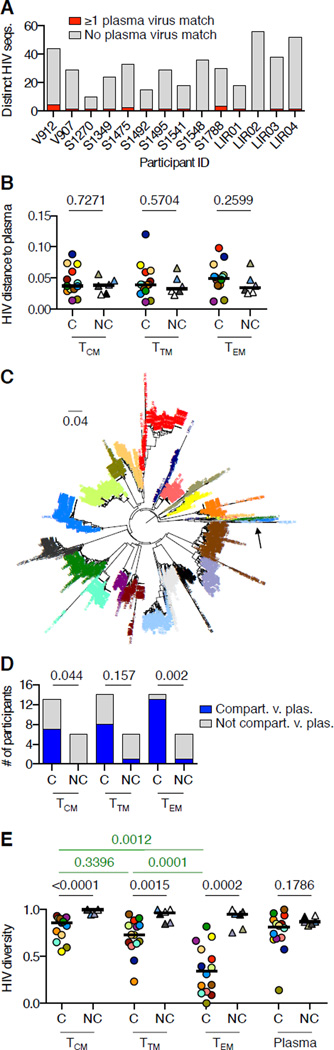
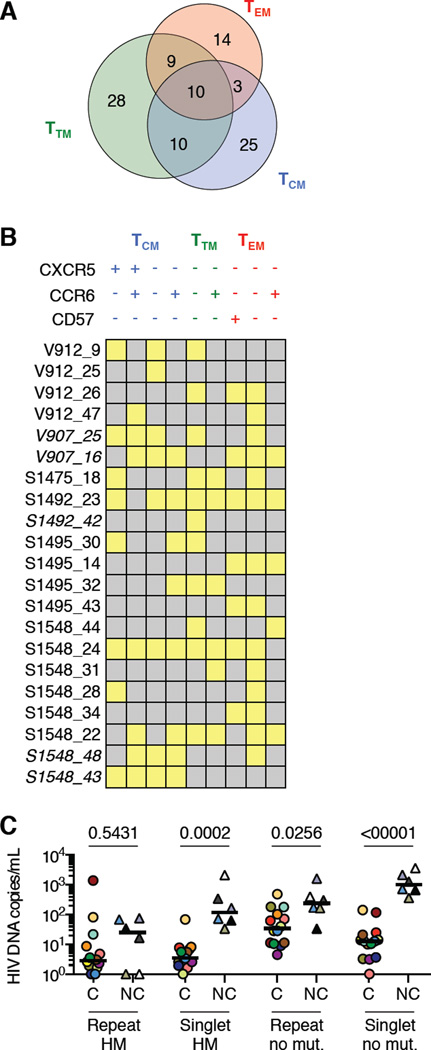
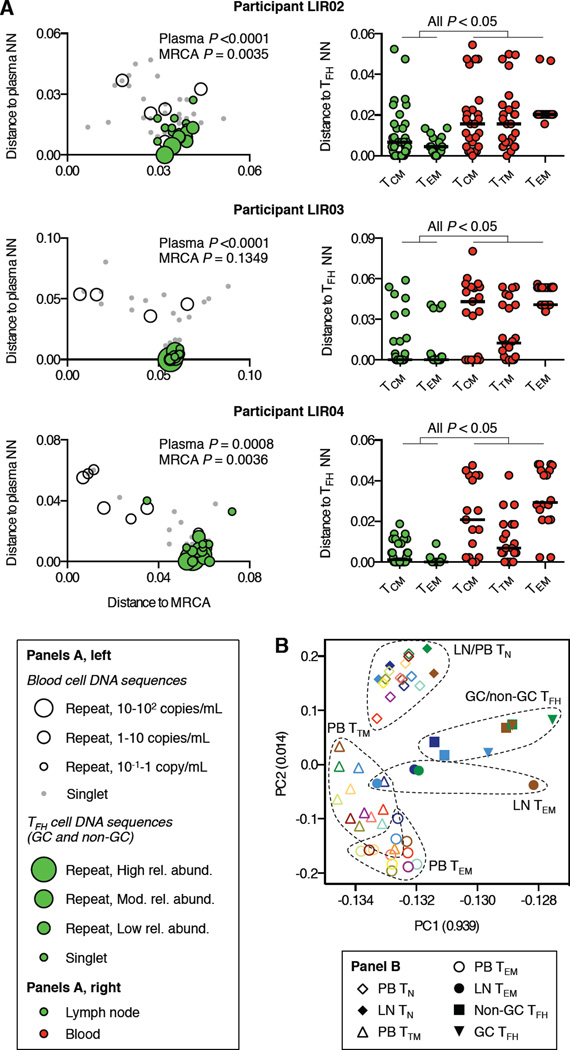
Targeted HIV cure strategies require definition of the mechanisms that maintain the virus. Here, we tracked HIV replication and the persistence of infected CD4 T cells in individuals with natural virologic control by sequencing viruses, T cell receptor genes, HIV integration sites, and cellular transcriptomes. Our results revealed three mechanisms of HIV persistence operating within distinct anatomic and functional compartments. In lymph node, we detected viruses with genetic and transcriptional attributes of active replication in both T follicular helper (TFH) cells and non-TFH memory cells. In blood, we detected inducible proviruses of archival origin among highly differentiated, clonally expanded cells. Linking the lymph node and blood was a small population of circulating cells harboring inducible proviruses of recent origin. Thus, HIV replication in lymphoid tissue, clonal expansion of infected cells, and recirculation of recently infected cells act together to maintain the virus in HIV controllers despite effective antiviral immunity.


Figures

Figure 1
Figure 1
HIV DNA and RNA levels in circulating CD4 T cell subsets from HIV controllers. (A) HIV DNA copies detected by FCA per 106 TN, TCM, TTM, or TEM cell equivalents. (B) Numbers of HIV-infected TN, TCM, TTM, and TEM cells per milliliter of blood, calculated by adjusting values in (A) for CD4 counts and proportions of CD4 T cells in each subset. The participant color code at right applies to all figures. Horizontal bars indicate median values in all figures. (C) Copies of unspliced (circles) and spliced (diamonds) HIV RNAs in TCM, TTM, and TEM cells from HIV controllers, measured by qRTPCR and normalized to values in (A). Undetectable values are plotted at the assay’s limit of detection (LOD) with open symbols. Wilcoxon signed rank test P values are shown. In panels (A) and (B), all Wilcoxon signed rank test P values for comparisons between TN and memory subsets in HIV controllers are <0.0001, and Mann-Whitney P values for comparisons between HIV controllers and non-controllers are <0.001 for all cell subsets. In panel (C), all Wilcoxon signed rank test P values for comparisons of unspliced or spliced RNA between subsets are >0.05. See also Figures S1–2.
Figure 2
Figure 2
HIV DNA sequence analysis in circulating CD4 T cell subsets from HIV controllers. (A) Number of distinct HIV DNA sequences detected in blood CD4 T cells from each HIV controller, with number of sequences matching ≥1 plasma virus in red. (B) Average genetic distances between plasma HIV RNA sequences and HIV DNA sequences in TCM, TTM, or TEM cells in HIV controllers and non-controllers. Mann-Whitney P values are shown. (C) Phylogenetic analysis of all sequences in the study, with labels colored by participant. The arrow shows one clade in which G-to-A hypermutated sequences from multiple participants are intermingled. (D) Genetic compartmentalization between HIV DNA sequences in TCM, TTM, or TEM cells and plasma viruses in HIV controllers and non-controllers, as determined by Slatkin-Maddison testing with Bonferroni correction. Only 13 participants are shown for TCM cells because participant S1270 had no detectable HIV DNA in TCM cells. Fisher’s exact test P values for comparisons between controllers and non-controllers are shown. (E) Normalized Shannon diversities of plasma viruses and HIV DNA sequences in TCM, TTM, and TEM cells from HIV controllers and non-controllers. Mann-Whitney P values for comparisons between controllers and non-controllers are in black. Wilcoxon signed rank test P values for comparisons between subsets in HIV controllers are in green. All Wilcoxon signed rank test P values for comparisons between subsets in non-controllers are >0.05. See also Figures S3–4.
Figure 3
Figure 3
Clonality of cells and HIV DNA sequences in circulating CD4 T cell subsets from HIV controllers. (A) Normalized Shannon diversities of T cell receptor beta (TCRB) sequences from TCM, TTM, and TEM cells in HIV controllers. Wilcoxon signed rank test P values are shown. (B) Average genetic distances of plasma virus and TCM, TTM, and TEM cell-associated HIV DNA sequences from most recent common ancestral (MRCA) sequences in HIV controllers and non-controllers. Wilcoxon signed rank test P values are shown. (C) Number of recurrent HIV DNA sequences detected in circulating CD4 T cells of each HIV controller, with number of distinct sequences matching ≥1 plasma virus sequence in red. (D) Correlation between the abundance in blood of each recurrent HIV DNA sequence in circulating CD4 T cells from HIV controllers (x-axis) and the average genetic distance of that sequence to plasma viruses (y-axis). Each symbol represents one distinct sequence and is colored by participant. Spearman r and P values are shown. (E–F) HIV DNA sequences associated with expanded cellular clones in HIV controllers V907 (E) and S1349 (F), illustrated using dashed borders within phylogenetic trees. Gene locus names corresponding to the HIV integration sites in these expanded clones are shown. Each number in parentheses represents the percentage of all copies of HIV DNA in blood CD4 T cells from the individual deriving from the indicated HIV integrant. Sequences from participant V907 showing G-to-A hypermutation and associated with expanded cellular clones are shown as detached branches; other hypermutated sequences are omitted for clarity. The large sequence cluster in participant S1349 is shown separated from the tree for ease of viewing; an arrowhead shows the position of this sequence on the tree. See also Table S2.
Figure 4
Figure 4
Subset distribution and genetic attributes of HIV DNA sequences in circulating CD4 T cells. (A) Subset distribution of HIV sequences from presumptive expanded CD4 T cell clones in HIV controllers. (B) Distribution of HIV DNA sequences from presumptive expanded clones across subsets within TCM, TTM, and TEM populations defined by CXCR5, CCR6, and CD57. Each row represents one sequence, labeled by participant and a unique number. Yellow indicates that the sequence was detected in the given subset. Italics indicate G-to-A hypermutated sequences. (C) Levels of HIV DNA sequences in circulating CD4 T cells from HIV controllers and non-controllers categorized according to the number of occurrences (Repeat, >1 occurrence; Singlet, one occurrence) and the presence or absence of G-to-A hypermutation (HM, hypermutation detected; no mut., no lethal genetic defect detected). To allow display of these wide-ranging values – including several values of zero – on a logarithmic scale, each plotted value represents the measured value + 1. Sequences with lethal genetic defects other than hypermutation were rarely detected. See also Table S2.
Figure 5
Figure 5
RNA sequences of virions induced from circulating TCM, TTM, and TEM cells in HIV controllers. (A, x-y plots) Proximity of each HIV DNA sequence from circulating CD4 T cells or virions induced from TCM, TTM, and TEM cells to the participant’s MRCA (x-axis) and nearest genetic neighbor (NN) from plasma virus (y-axis). HIV DNA sequences detected once are shown as gray dots; recurrent HIV DNA sequences are shown as black circles scaled by the abundance of the sequence; and sequences detected in induced virion RNA but not in DNA from a second aliquot of cells (i.e., “unique induced” viruses) are shown as stars. Where an induced virion RNA sequence matched a recurrent HIV DNA sequence from blood cells, the circle corresponding to that DNA sequence is filled. The arrow shows one sequence from participant S1270 containing a lethal deletion within gp120. For alignment production, this deletion was filled with the participant’s consensus sequence; the measured genetic distance of this sequence to the plasma virus NN is therefore an underestimate. (A, hemispheres) Quantities of unique induced proviruses and all other HIV DNA sequences in circulating CD4 T cells from HIV controllers. Plots are scaled to show relative levels of HIV DNA in circulating CD4 T cells from the five participants. For participants with undetectable unique induced viruses from blood cells, the LOD of this measurement is shown. (B) Sequences in virions induced from blood cells in participant S1270. Cyan indicates sequences from an initial experiment; magenta indicates sequences from a repeat experiment. Sequences in which relative insertions were excised or deletions filled in alignment production are shown with gray arrows. See also Figure S5.
Figure 6
Figure 6
HIV DNA and RNA levels in LN CD4 T cell subsets. (A) Levels of HIV DNA measured by FCA in LN non-GC TFH and GC TFH; non-follicular LN subsets (CD57+ subset collected only for participant LIR02); and blood TCM, TTM, and TEM subsets. (B and C) Copies of unspliced (B) and spliced (C) HIV RNAs in LN memory CD4 T cell subsets, measured by qRTPCR and normalized to values in (A). Each cell subset is shown with a unique shape and colored by participant. Undetectable values are plotted at the assay LOD with open symbols. Mann-Whitney P values are shown. (A–C) include results from blood CD4 TCM, TTM, and TEM subsets that are also shown in Figure 1. (D) The percentage of all HIV DNA copies in LN memory CD4 T cells from each participant detected in each subset. (E) HIV RNA+ LN cells detected by in situ hybridization using 35S-labeled riboprobes in two study participants. White arrows indicate examples of HIV RNA+ cells. Some such cells were associated with areas of diffusely increased signal corresponding to the follicular dendritic cell network (follicular); others were outside such areas (extrafollicular). See also Figures S6–7 and Table S3.
Figure 7
Figure 7
Analysis of HIV DNA sequences and host gene expression in LN CD4 T cell subsets from HIV controllers. (A, left), Proximity of each HIV DNA sequence from LN GC and non-GC TFH cells to each participant’s MRCA (x-axis) and plasma virus NN sequence (y-axis). HIV DNA sequences from blood cells are shown as in Figure 5; HIV DNA sequences from GC and non-GC TFH cells are shown as green-filled circles scaled by their relative abundance in LN. Sequences from GC and non-GC TFH cells were compared to those from blood cells for genetic distance to plasma virus NN and MRCA sequences. Mann-Whitney P values for these comparisons are shown. (A, right) Proximity of each HIV DNA sequence from non-TFH TCM and TEM LN cells and TCM, TTM, and TEM blood cells to the NN sequence from GC and non-GC TFH cells. All Mann-Whitney P values for comparisons between LN cell subsets and blood cell subsets are <0.05. (B) PCA of transcriptomes from blood (PB) and LN CD4 T cell subsets. Clusters of symbols representing samples of the same cell subset from multiple study participants are demarcated with dashed boundaries. See also Figures S6–7 and Table S3.

Comment in

References

    1. Abdel-Mohsen M, Raposo RA, Deng X, Li M, Liegler T, Sinclair E, Salama MS, Ghanem Hel D, Hoh R, Wong JK, et al. Expression profile of host restriction factors in HIV-1 elite controllers. Retrovirology. 2013;10:106. - PMC - PubMed
    1. Archin NM, Liberty AL, Kashuba AD, Choudhary SK, Kuruc JD, Crooks AM, Parker DC, Anderson EM, Kearney MF, Strain MC, et al. Administration of vorinostat disrupts HIV-1 latency in patients on antiretroviral therapy. Nature. 2012;487:482–485. - PMC - PubMed
    1. Bailey JR, Williams TM, Siliciano RF, Blankson JN. Maintenance of viral suppression in HIV-1-infected HLA-B*57+ elite suppressors despite CTL escape mutations. J Exp Med. 2006;203:1357–1369. - PMC - PubMed
    1. Blankson JN, Bailey JR, Thayil S, Yang HC, Lassen K, Lai J, Gandhi SK, Siliciano JD, Williams TM, Siliciano RF. Isolation and characterization of replication-competent human immunodeficiency virus type 1 from a subset of elite suppressors. J Virol. 2007;81:2508–2518. - PMC - PubMed
    1. Boufassa F, Lechenadec J, Meyer L, Costagliola D, Hunt PW, Pereyra F, Deeks S, Pancino G, Taulera O, Lichterfeld M, et al. Blunted response to combination antiretroviral therapy in HIV elite controllers: an international HIV controller collaboration. PLoS One. 2014;9:e85516. - PMC - PubMed

Publication types