. 2016 Aug 10;20(2):226-37.
doi: 10.1016/j.chom.2016.06.010. Epub 2016 Jul 21.

CRISPR/Cas9 Screens Reveal Requirements for Host Cell Sulfation and Fucosylation in Bacterial Type III Secretion System-Mediated Cytotoxicity

Affiliations

CRISPR/Cas9 Screens Reveal Requirements for Host Cell Sulfation and Fucosylation in Bacterial Type III Secretion System-Mediated Cytotoxicity

Carlos J Blondel et al. Cell Host Microbe. .

Abstract

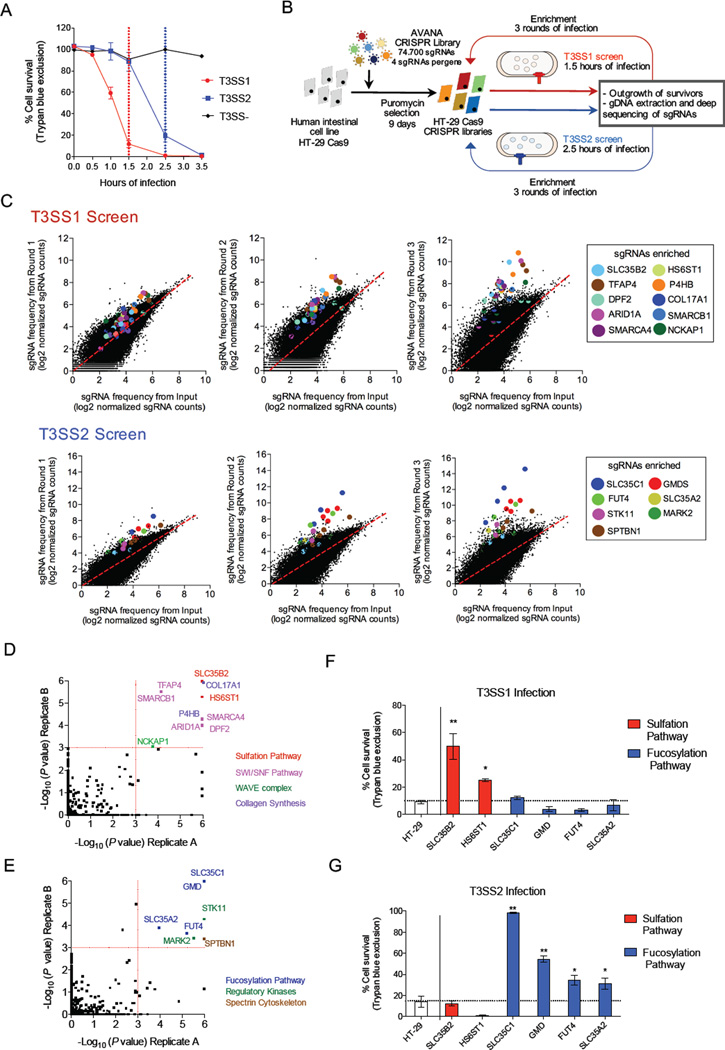
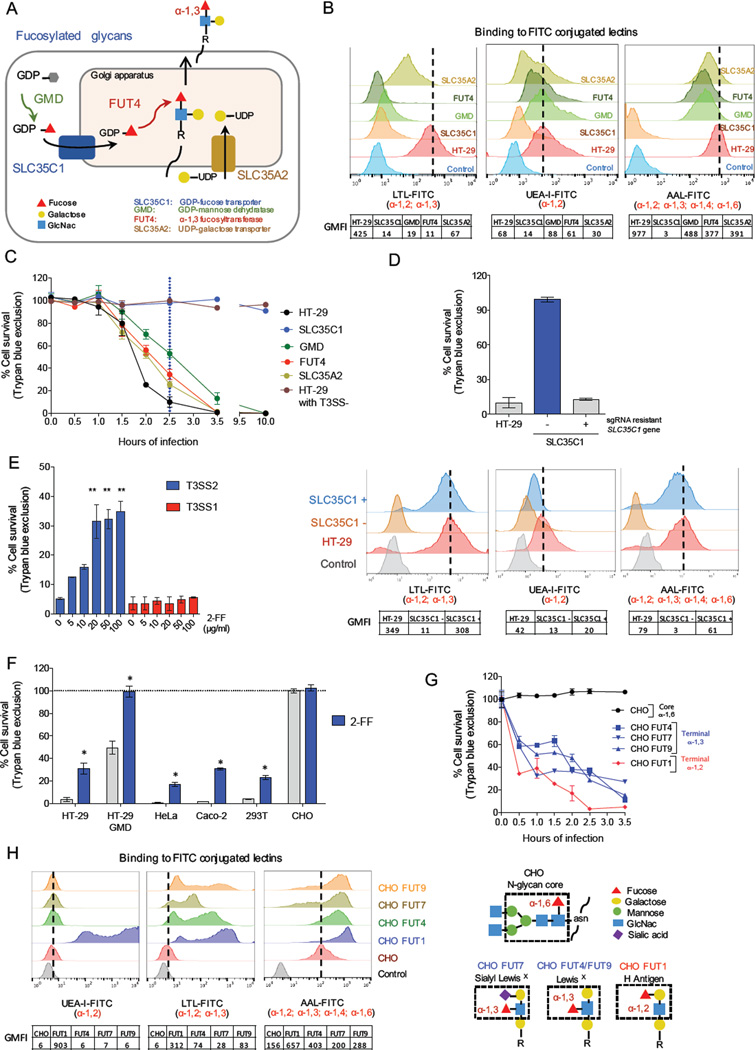
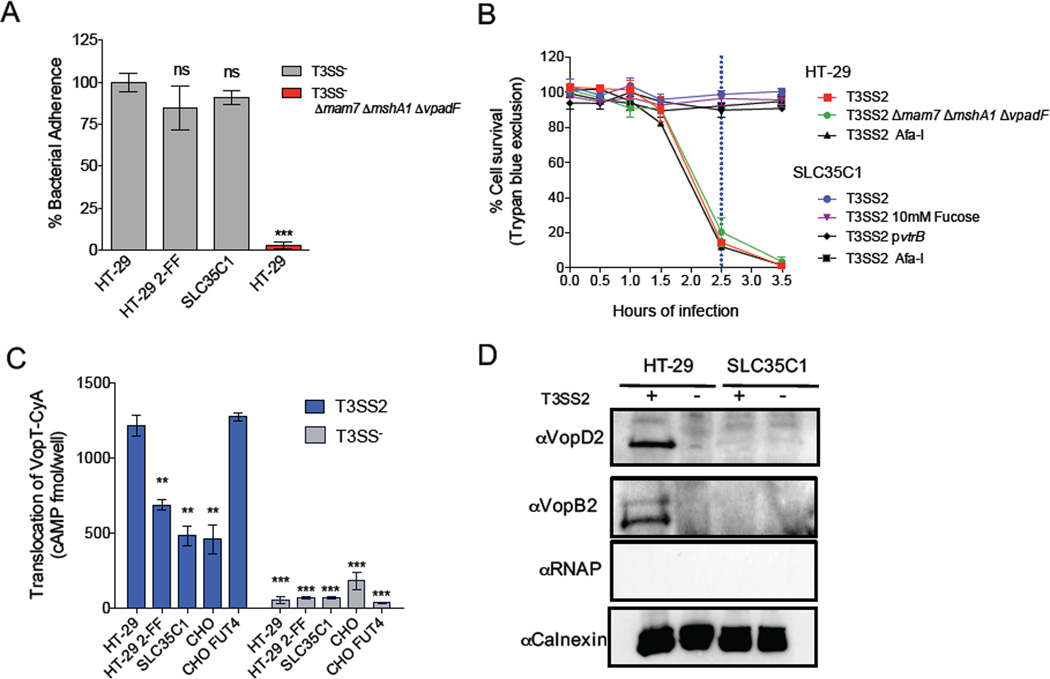
Type III secretion systems (T3SSs) inject bacterial effector proteins into host cells and underlie the virulence of many gram-negative pathogens. Studies have illuminated bacterial factors required for T3SS function, but the required host processes remain largely undefined. We coupled CRISPR/Cas9 genome editing technology with the cytotoxicity of two Vibrio parahaemolyticus T3SSs (T3SS1 and T3SS2) to identify human genome disruptions conferring resistance to T3SS-dependent cytotoxicity. We identity non-overlapping genes required for T3SS1- and T3SS2-mediated cytotoxicity. Genetic ablation of cell surface sulfation reduces bacterial adhesion and thereby alters the kinetics of T3SS1-mediated cytotoxicity. Cell surface fucosylation is required for T3SS2-dependent killing, and genetic inhibition of fucosylation prevents membrane insertion of the T3SS2 translocon complex. These findings reveal the importance of ubiquitous surface modifications for T3SS function, potentially explaining the broad tropism of V. parahaemolyticus, and highlight the utility of genome-wide CRISPR/Cas9 screens to discover processes underlying host-pathogen interactions.


Figures

Figure 1
Figure 1. CRISPR/Cas9 screen reveals coherent and distinct pathways involved in resistance to T3SS killing
(A) Kinetics of T3SS-dependent HT-29 cell death. The duration of infection for the T3SS1 (red) and T3SS2 (blue) screens is marked with dotted lines. (B) Workflow and screening strategy for the CRISPR/Cas9 screens. (C) Scatter plots showing enrichment of specific sgRNAs in the T3SS1 and T3SS2 screens after each round of infection. sgRNAs targeting the same gene are highlighted with the same color. The values correspond to log2 of normalized reads (see Table S2 for data). (D, E) Statistical significance of the gene candidates from the T3SS1 (D) and T3SS2 (E) screens in both biological replicates analyzed by STARS. Candidates for follow up had a P < 0.001 in both biological replicates. The colors of spheres indicate the associated biological process. See also Table S3. (F, G) Survival of HT-29 cells and mutant cells following infection with T3SS1+ or T3SS2+ bacteria for 1.5 or 2.5 hr, respectively. See also Figure S3B-C. Data are mean with SEM (n=3). P values (** < 0.001, * < 0.05) are based on one-way ANOVA with Dunnet post test correction.
Figure 2
Figure 2. Cell surface sulfation promotes T3SS1 cytotoxicity
(A) Overview of sulfated proteoglycan synthesis, highlighting mutations conferring resistance to T3SS1 cytotoxicity. (B) Flow cytometry profiles of HT-29 and mutant cells bound to a heparan sulfate specific antibody (10E4-FITC); GMFI, geometric mean fluorescence intensity. (C) Survival of HT-29 cells treated with the sulfation inhibitor sodium chlorate prior to T3SS1 and T3SS2 infection. (D) T3SS1 killing and sulfation of SLC35B2 mutant cells expressing an sgRNA resistant SLC35B2 cDNA. Data are mean with SEM (n=3). P values (*** < 0.0001) are based on one-way ANOVA with Dunnet post test correction.
Figure 3
Figure 3. Sulfated GAGs facilitate T3SS1 killing by promoting bacterial adhesion
(A) T3SS1 cytotoxicity toward HT-29 and SLC35B2 mutant cells without pretreatment (PBS), preincubated then washed (coating) with GAGs (500µg/ml) (sulfated heparin (HS); dermatan sulfate (DS); chondroitin sulfate (CSA), or non-sulfated: hyaluronic acid (HA)), or infected in the presence of heparin (500µg/ml) (blocking). (B) Adherence of T3SS- V. parahaemolyticus to HT-29 and SLC35B2 mutant cells in presence of 500µg/ml sulfated or non-sulfated GAGs. (C) Effect of GAGs on resistance of HT-29 cells to T3SS1 and T3SS2 killing. (D) Survival kinetics of host cells of varying genotypes following infection with T3SS1+ and T3SS-deficient V. parahaemolyticus. (E) Survival kinetics of HT-29 and SLC35B2 mutant cells during infection with either T3SS1+ or T3SS1+ V. parahaemolyticus expressing the Afa-I adhesin or following infection initiated with centrifugation of V. parahaemolyticus onto host cells (spin). (F) Translocation of the T3SS1 effector VopQ fused to adenylate cyclase (CyA) into different host cells by V. parahaemolyticus after a 20-minute infection. Translocation into SLC35B2 cells was evaluated with and without centrifugation (spin) to enhance bacterial attachment. Data are mean with SEM (n=3). P values (* < 0.01, ** < 0.001, *** < 0.0001) are based on one-way ANOVA with Dunnet post test correction.
Figure 4
Figure 4. MAM7, MshA1, VpadF promote sulfation-dependent adhesion and T3SS1 killing
(A) Flow cytometry profile of T3SS1+ V. parahaemolyticus and derivatives lacking MAM7, MshA1, VpadF or all of them, bound to heparin-FITC; GMFI, geometric mean fluorescence intensity. (B) Kinetics of T3SS1 killing in bacteria lacking the adhesins MAM7, MshA1 and/or VpadF. (C) Survival of SLC35B2 cells infected with T3SS1+ and adhesin-deficient strains with or without heparin coating. Data are mean with SEM (n=3). P values (* < 0.01) are based on one-way ANOVA with Dunnet post test correction.
Figure 5
Figure 5. Terminal fucosylation is required for T3SS2 cytotoxicity
(A) Overview of the steps in the synthesis of fucosylated glycans, highlighting mutations conferring resistance to T3SS2 killing. (B) Flow cytometry profiles of HT-29 and mutant cells bound to fucose-specific FITC-conjugated lectins that recognize distinct fucosylation linkages. Charts below the graphs show geometric mean fluorescence intensity (GMFI). AAL, Aleuria aurantia; LTL, Lotus tetragonolobus; UEA-1, Ulex europaeus Iectin. (C) Kinetics of survival of HT-29 and mutant cells after infection with T3SS2+ or T3SS2 V. parahaemolyticus. (D). T3SS2 killing (top) and fucosylation (bottom) of wt, SLC35C1 mutant cells, and SLC35C1 mutant cells expressing an sgRNA resistant SLC35C1 cDNA. (E) Impact of the fucosylation inhibitor 2-FF on T3SS1 and T3SS2 killing of HT-29 cells. (F) Impact of 2-FF on survival of different cell lines infected with T3SS2+ V. parahaemolyticus. (G) Kinetics of cell survival following T3SS2+ V. parahaemolyticus infection of CHO parental and mutant cells. (H) Lectin binding profiles for CHO cells transduced with FUT genes that generate diverse terminal fucose linkages. Structures of the CHO cell N-glycan core and various terminal fucosylated blood group antigens are shown on the right. Data are mean with SEM (n=3), P values (* < =0.01, ** < 0.001) are based on one-way ANOVA with Dunnet post test correction.
Figure 6
Figure 6. Fucosylation is required for T3SS2 effector translocation and translocon insertion but not bacterial adhesion
(A) Adhesion of T3SS V. parahemolyticus to HT-29 cells alone or treated with 50mM 2-FF or to SLC35C1 mutant cells. The T3SS Δmam7 ΔmshA1 ΔvpadF strain was included as a negative control. (B) Survival kinetics of HT-29 and SLC35C1 mutant cells infected with T3SS2+ V. parahaemolyticus expressing the T3SS2 regulator VtrB or the adhesin Afa-I, infected in the presence of 10mM fucose, or infected with a V. parahaemolyticus strain lacking MAM7, MshA1 and VpadF. (C) Translocation of the T3SS2 effector VopT fused to adenylate cyclase after a 45-minute infection of HT-29 cells +/− 50mM 2-FF, SLC35C1 mutant cells, or CHO cells +/− FUT4. See also Figure S6B. (D) Immunoblot of T3SS2 translocon components VopB2 and VopD2 in host cell membranes after infection with T3SS2+ V. parahaemolyticus. Blots were also probed with antibodies against the host membrane protein calnexin (loading/fractionation control) and bacterial RNAP, demonstrating absence of contaminating intact bacteria. Data are mean with SEM (n=3). P values (** < 0.001, *** < 0.0001) are based on one-way ANOVA with Dunnet post test correction.

Comment in

  • Unhealthy Sugars in Bacterial Cytotoxicity.
    Aguilar-Salvador DI, Tran Van Nhieu G. Aguilar-Salvador DI, et al. Cell Host Microbe. 2016 Aug 10;20(2):126-8. doi: 10.1016/j.chom.2016.07.014. Cell Host Microbe. 2016. PMID: 27512898

References

    1. Abby SS, Rocha EPC. The non-flagellar type III secretion system evolved from the bacterial flagellum and diversified into host-cell adapted systems. PLoS Genet. 2012;8:e1002983. - PMC - PubMed
    1. Becker DJ, Lowe JB. Fucose: biosynthesis and biological function in mammals. Glycobiology. 2003;13:41R–53R. - PubMed
    1. Boyd A. Manipulation of intestinal epithelial cell function by the cell contact-dependent type III secretion systems of Vibrio parahaemolyticus. Front Cell Infect Microbiol. 2014;10(3):114. - PMC - PubMed
    1. Burdette DL, Yarbrough ML, Orvedahl A, Gilpin CJ, Orth K. Vibrio parahaemolyticus orchestrates a multifaceted host cell infection by induction of autophagy, cell rounding, and then cell lysis. Proc. Natl. Acad. Sci. U.S.A. 2008;105:12497–12502. - PMC - PubMed
    1. Dean P. Functional domains and motifs of bacterial type III effector proteins and their roles in infection. FEMS Microbiol Rev. 2011;35:1100–1125. - PubMed

MeSH terms