Case Reports
. 2016 Aug 4;99(2):511-20.
doi: 10.1016/j.ajhg.2016.07.003. Epub 2016 Jul 21.

Mutations in Citron Kinase Cause Recessive Microlissencephaly with Multinucleated Neurons

Affiliations
Case Reports

Mutations in Citron Kinase Cause Recessive Microlissencephaly with Multinucleated Neurons

Brian N Harding et al. Am J Hum Genet. .

Abstract

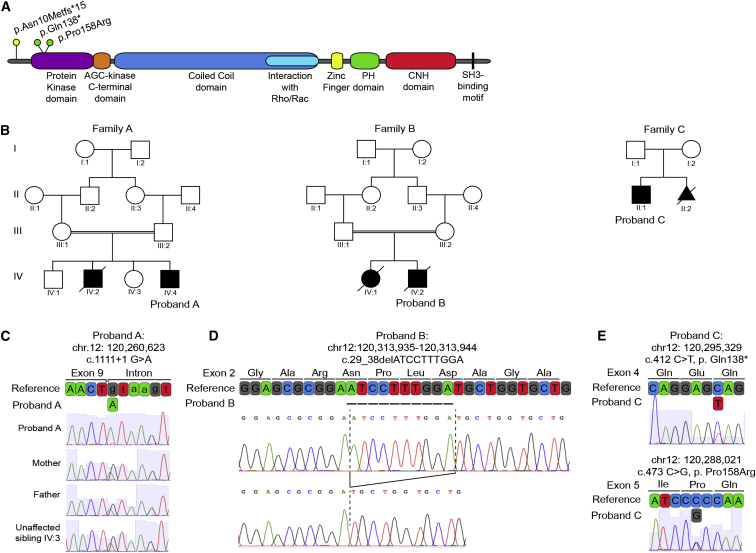
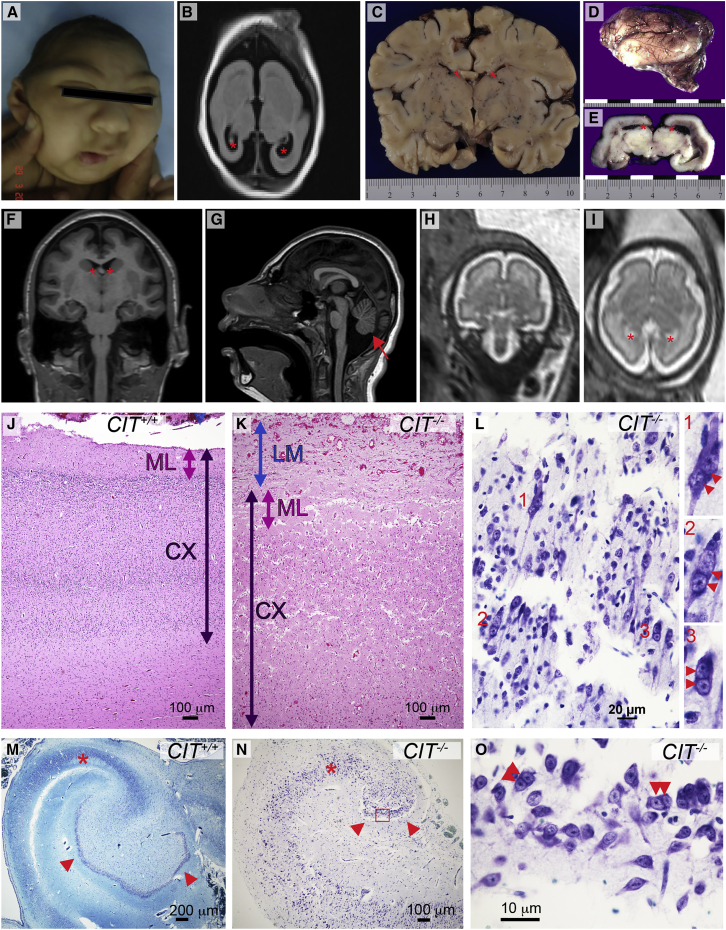
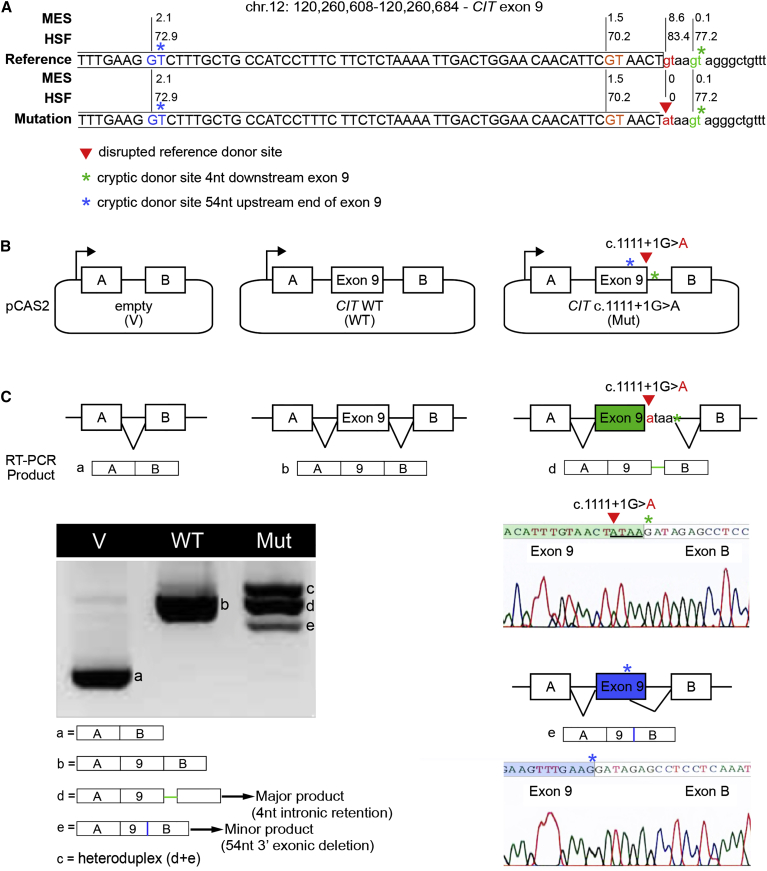
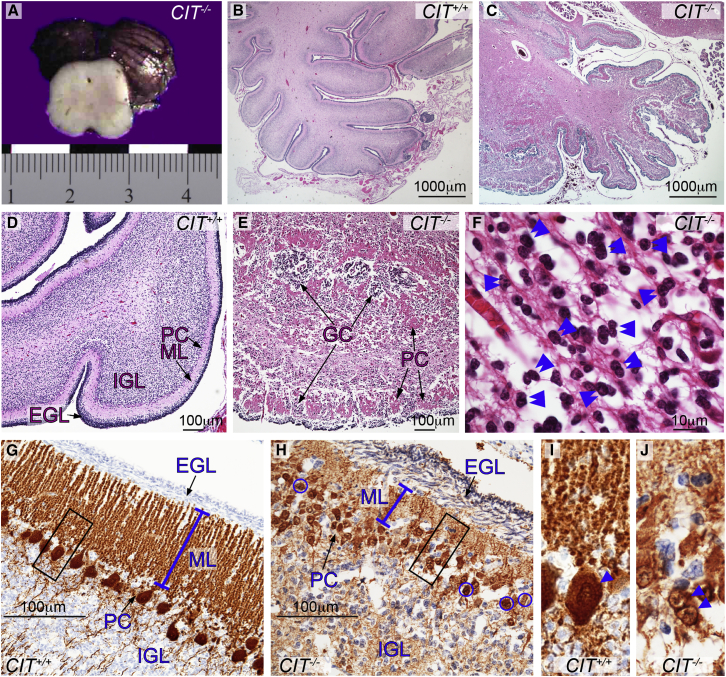
Primary microcephaly is a neurodevelopmental disorder that is caused by a reduction in brain size as a result of defects in the proliferation of neural progenitor cells during development. Mutations in genes encoding proteins that localize to the mitotic spindle and centrosomes have been implicated in the pathogenicity of primary microcephaly. In contrast, the contractile ring and midbody required for cytokinesis, the final stage of mitosis, have not previously been implicated by human genetics in the molecular mechanisms of this phenotype. Citron kinase (CIT) is a multi-domain protein that localizes to the cleavage furrow and midbody of mitotic cells, where it is required for the completion of cytokinesis. Rodent models of Cit deficiency highlighted the role of this gene in neurogenesis and microcephaly over a decade ago. Here, we identify recessively inherited pathogenic variants in CIT as the genetic basis of severe microcephaly and neonatal death. We present postmortem data showing that CIT is critical to building a normally sized human brain. Consistent with cytokinesis defects attributed to CIT, multinucleated neurons were observed throughout the cerebral cortex and cerebellum of an affected proband, expanding our understanding of mechanisms attributed to primary microcephaly.

Keywords: autosomal recessive; citron kinase; cytokinesis; lissencephaly; neurogenesis; primary microcephaly; splicing mutation.


Figures

Figure 1
Figure 1
Recessive CIT Variants in Microlissencephaly (A) Domain organization of CIT shows pathogenic coding variants in relation to protein domains. (B) Pedigrees of the families investigated; probands are noted. (C) Chromatographs and schematic of the boundary between exon 9 and intron 9 of WT reference CIT, the homozygous splice donor variant from proband A (c.1111+1G>A), and the cryptic splice donor site four bases downstream. Parents and unaffected sibling IV:3 are heterozygous carriers. (D) Chromatographs defining the homozygous 10 bp CIT exon 2 deletion (c.29_38delATCCTTTGGA; hg19 chr12: 120,313,935–120,313,944) amplified from proband B. This deletion creates a frameshift leading to a premature stop 15 codons downstream (not shown). (E) Chromatographs and schematic of reference CIT exons 4 and 5 and the corresponding nonsense (c.412C>T [p.Gln138]) and missense (c.473C>G [p.Pro158Arg]) variants identified in proband C.
Figure 2
Figure 2
Structural and Cellular Neocortical Phenotypes (A) Proband A displays a microcephalic cranium, a sloping forehead, a wide nasal bridge, and hypotelorism. (B) T2-weighted axial MRI of proband A at 3.5 months shows markedly reduced cerebral cortical size, simplified gyral folding, and enlarged ventricles (red asterisks). (C) Coronal section of newborn control brain. Width is in centimeters, and lateral ventricles are marked by red asterisks. (D) Lateral view of the lissencephalic newborn brain from proband B (scale in centimeters). (E) Coronal section through the mid-thalamus of the brain of proband B shows enlarged lateral ventricles (red asterisks). (F) Coronal brain MRI of proband C at 10 years of age shows microcephaly, a simplified gyral pattern, and enlarged ventricles (red asterisks). (G) Mid-sagittal MRI of proband C shows a sloping forehead and a hypoplastic brainstem and cerebellum (red arrow). (H and I) Coronal (H) and axial (I) fetal brain MRI of affected subject C:II:2 at 29 GWs shows reduced brain volume, reduced gyrification, and enlarged ventricles (red asterisks). (J and K) Control (J) and proband B (K) cerebral cortex stained with H&E. Compared to the control, leptomeninges (LM; blue arrow) in the proband are excessively thick and contiguous with the molecular layer (ML; pink arrow). Compared to the control, the proband’s cortex (CX; dark purple arrow) is thickened, and the cortical layering is obscure. (L) High magnification of proband B cortex stained with Kluver-Barrera. Disorganized parenchyma includes many multinucleated neurons: inserts show detail of multinucleated (red double arrowheads) cells labeled 1, 2, and 3. (M and N) Kluver-Barrera-stained sections of control (M) and proband B (N) temporal lobe. The proband hippocampus is very small and has a hypoplastic pyramidal layer (red asterisk) and greatly reduced dentate gyrus (arrowheads). The normal control hippocampus was imaged at half the magnification to allow for a comparison of the overall hippocampal structure. (O) Detail of the dentate gyrus from proband B (red box in N) shows binucleated granule cells (double arrowheads).
Figure 3
Figure 3
Functional Analysis of CIT c.1111+1G>A Confirms Its Negative Impact on RNA Splicing (A) Schematic representation of CIT sequence across the boundary between exon 9 and intron 9. The reference donor site (WT, red nucleotides) and cryptic donor sites (blue, orange, and green nucleotides) were delineated and scored with MaxEntScan (MES) and Human Splicing Finder (HSF) as shown in Figure S1. Only splice sites predicted by both algorithms in the WT sequence are shown. Exonic and intronic sequences are indicated by upper and lower case, respectively. The CIT c.1111+1G>A mutation from proband A (red arrowhead) disrupts the WT donor site. Asterisks indicate cryptic splice sites activated in the presence of c.1111+1G>A. (B) A minigene splicing assay was performed as previously described. The structures of the CIT exon 9 minigenes were used in the splicing reporter assay. Arrows represent the CMV promoter. Boxes represent exons, and lines in between indicate introns. (C) Analysis of WT and mutant (Mut) minigene splicing patterns. Transcripts were analyzed by RT-PCR after expression in HeLa cells with the use of primers specific to the minigene’s exons A and B (Table S1). RT-PCR products were separated on an agarose gel and sequenced. Aberrantly spliced products, accompanied by chromatographs, are illustrated on the right.
Figure 4
Figure 4
Structural and Cellular Cerebellar CIT Phenotypes (A) Section through the proband B midbrain shows an external view of the hypoplastic cerebellum. The scale is measured in centimeters. (B–F) Histologic cerebellar sections stained with H&E. In proband B, the cerebellar folia are poorly developed and the cortex is disorganized (C, E, and H). Compared to control cerebellum (B and D), cerebellar lamination in proband B is disrupted by clustered Purkinje cells (PCs) interspersed with granule cells (GCs) within fused folia (C and E). Many GCs appear binucleated (F; double blue arrowheads). (G–J) Cerebellum immunostained for calbindin shows that compared to the control (G), proband B has an abnormally thick EGL, a reduced ML (blue line), and multilayered collections of small PCs (H, arrows). The black boxes is (G) and (H) are enlarged to show that compared to control cells (I), PCs from proband B (J, blue arrowheads) are binucleated within a small soma. Abbreviations are as follows: EGL, external granule layer; IGL, internal granule layer; and ML, molecular layer.

References

    1. Gilmore E.C., Walsh C.A. Genetic causes of microcephaly and lessons for neuronal development. Wiley Interdiscip. Rev. Dev. Biol. 2013;2:461–478. - PMC - PubMed
    1. Paridaen J.T., Huttner W.B. Neurogenesis during development of the vertebrate central nervous system. EMBO Rep. 2014;15:351–364. - PMC - PubMed
    1. Bond J., Roberts E., Mochida G.H., Hampshire D.J., Scott S., Askham J.M., Springell K., Mahadevan M., Crow Y.J., Markham A.F. ASPM is a major determinant of cerebral cortical size. Nat. Genet. 2002;32:316–320. - PubMed
    1. Bond J., Roberts E., Springell K., Lizarraga S.B., Scott S., Higgins J., Hampshire D.J., Morrison E.E., Leal G.F., Silva E.O. A centrosomal mechanism involving CDK5RAP2 and CENPJ controls brain size. Nat. Genet. 2005;37:353–355. - PubMed
    1. Kumar A., Girimaji S.C., Duvvari M.R., Blanton S.H. Mutations in STIL, encoding a pericentriolar and centrosomal protein, cause primary microcephaly. Am. J. Hum. Genet. 2009;84:286–290. - PMC - PubMed

Publication types

Substances