. 2016 Jul 7;1(10):e87059.
doi: 10.1172/jci.insight.87059.

PD-1 blockade enhances the vaccination-induced immune response in glioma

Affiliations

PD-1 blockade enhances the vaccination-induced immune response in glioma

Joseph P Antonios et al. JCI Insight. .

Abstract

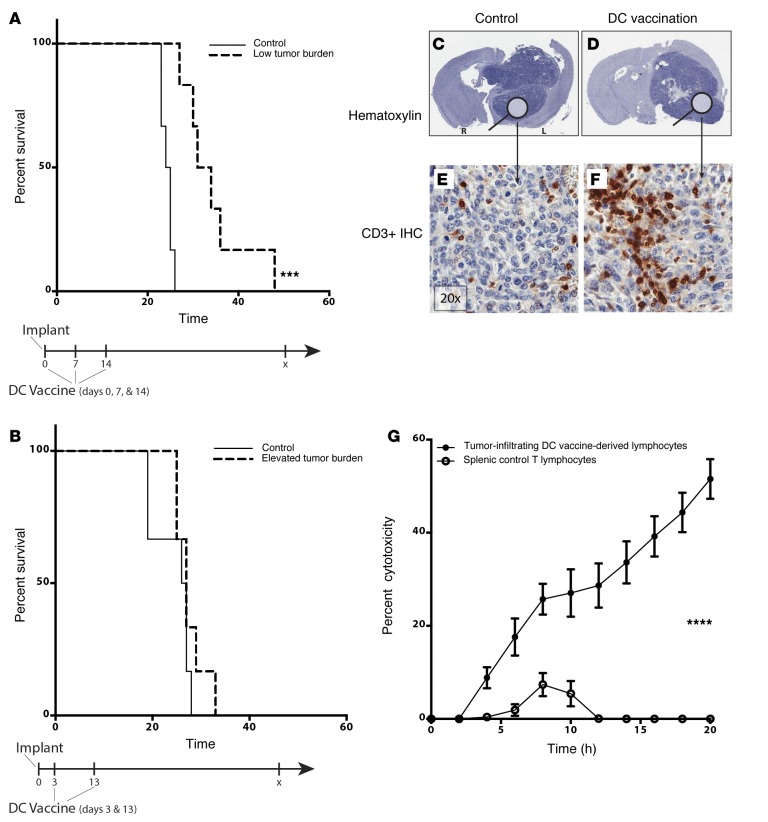
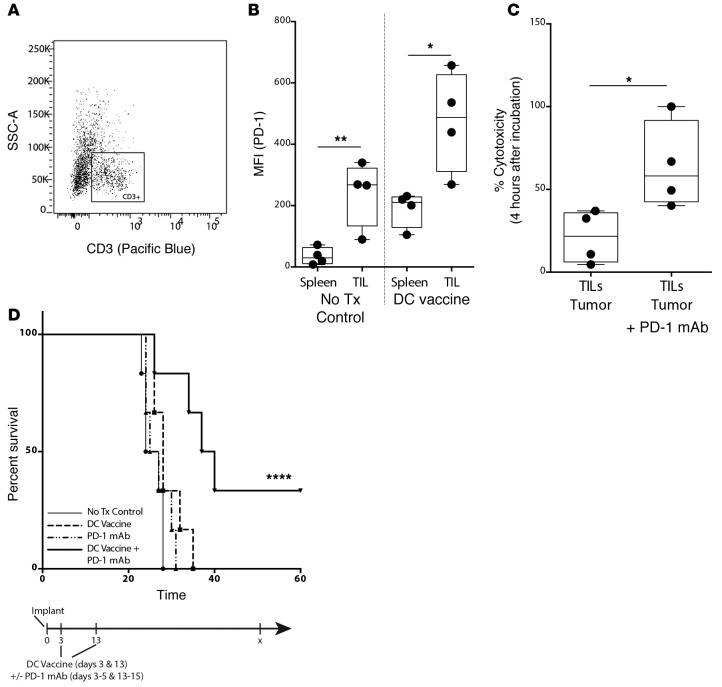
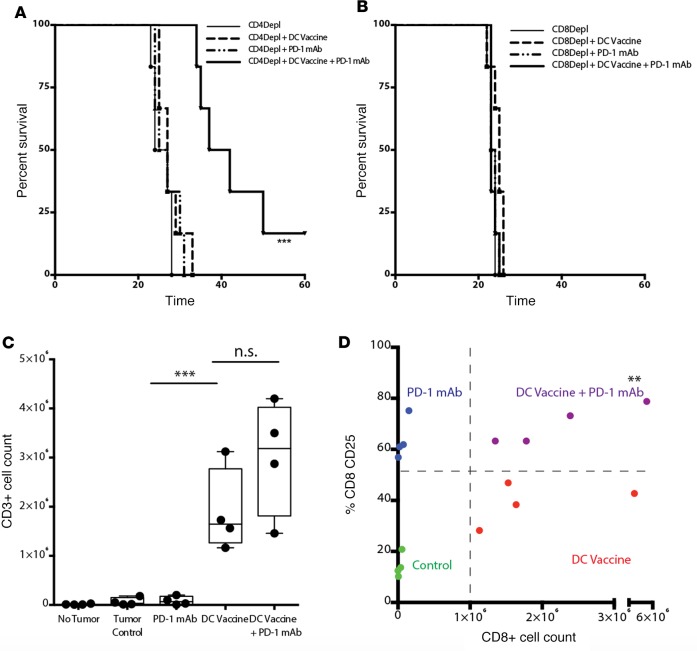
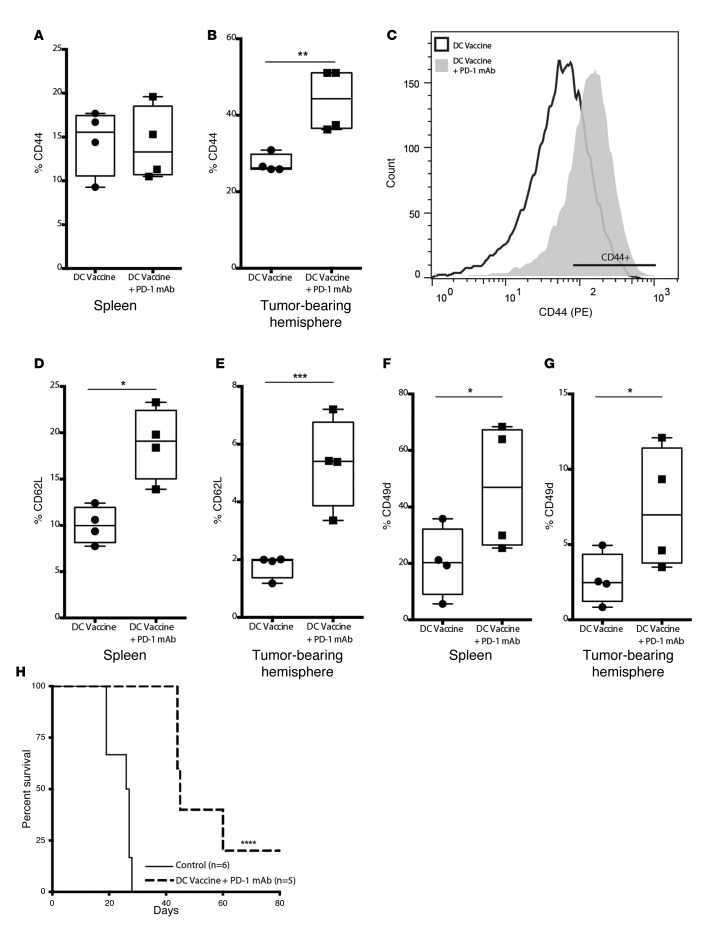
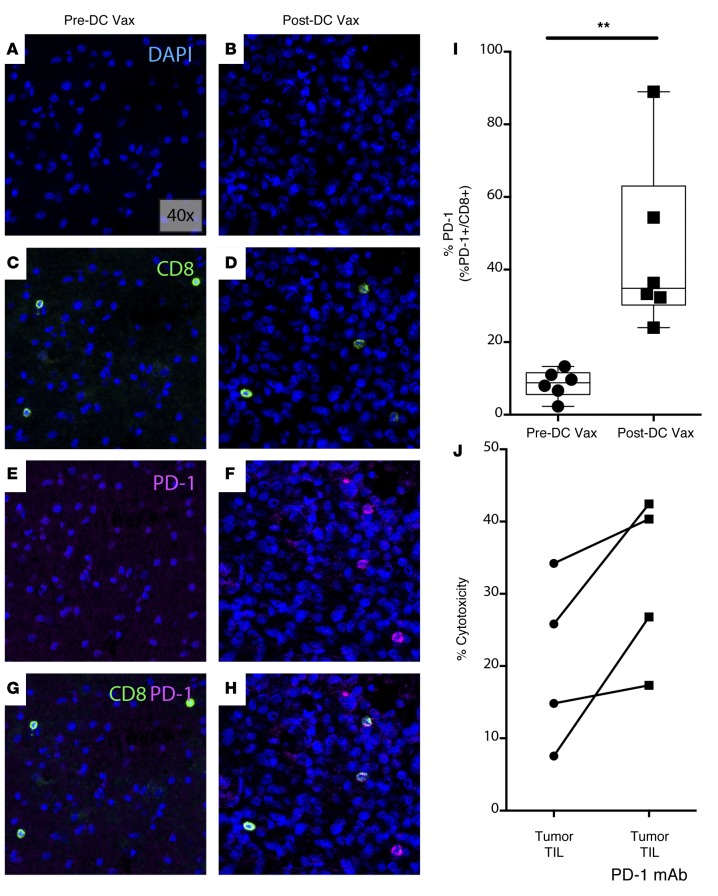
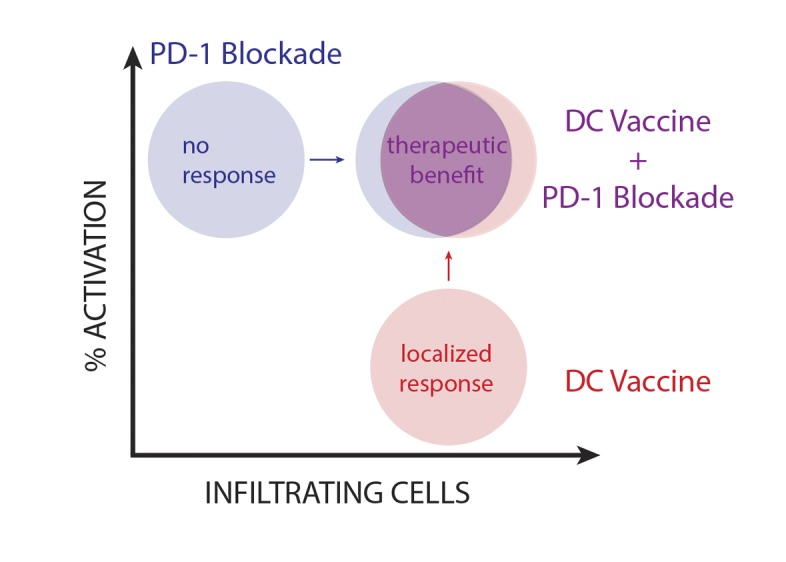
DC vaccination with autologous tumor lysate has demonstrated promising results for the treatment of glioblastoma (GBM) in preclinical and clinical studies. While the vaccine appears capable of inducing T cell infiltration into tumors, the effectiveness of active vaccination in progressively growing tumors is less profound. In parallel, a number of studies have identified negative costimulatory pathways, such as programmed death 1/programmed death ligand 1 (PD-1/PD-L1), as relevant mediators of the intratumoral immune responses. Clinical responses to PD-1 pathway inhibition, however, have also been varied. To evaluate the relevance to established glioma, the effects of PD-1 blockade following DC vaccination were tested in intracranial (i.c.) glioma tumor- bearing mice. Treatment with both DC vaccination and PD-1 mAb blockade resulted in long-term survival, while neither agent alone induced a survival benefit in animals with larger, established tumors. This survival benefit was completely dependent on CD8+ T cells. Additionally, DC vaccine plus PD-1 mAb blockade resulted in the upregulation of integrin homing and immunologic memory markers on tumor-infiltrating lymphocytes (TILs). In clinical samples, DC vaccination in GBM patients was associated with upregulation of PD-1 expression in vivo, while ex vivo blockade of PD-1 on freshly isolated TILs dramatically enhanced autologous tumor cell cytolysis. These findings strongly suggest that the PD-1/PD-L1 pathway plays an important role in the adaptive immune resistance of established GBM in response to antitumor active vaccination and provide us with a rationale for the clinical translation of this combination therapy.


Figures

Figure 1
Figure 1. DC vaccination promotes an antitumor but ineffective infiltrating immune response in the established setting.
Mice intracranially (i.c.) implanted with GL261 were randomly assigned to receive DC vaccine treatments (A) at time of implant (low tumor burden) or (B) once tumors became established (elevated tumor burden). Data shown are representative of 1 experiment repeated 2 times with similar findings. (CF) IHC staining with anti-CD3 antibody (red) on brains harvested from these mice (×20 magnification). (G) CD3+Thy1.2+ cells were FACS sorted from i.c. GL261 gliomas or spleens and plated with GL261 cells for in vitro xCelligence cytotoxicity assay (n = 3) (****P < 0.0001). Data shown are representative of 1 experiment repeated 2 times with similar findings. Each point represents 1 subject (A and B) or the average of biological replicate (n = 4) (G). Survival differences were calculated using log-rank statistical tests and graphed using the method of Kaplan-Meier (A and B), and a Student’s t test was used to calculate statistical significance at individual time points (G).
Figure 2
Figure 2. PD-1 blockade rescues the survival benefit after DC vaccination in mice with established tumor burden.
(A) Splenic and tumor-infiltrating lymphocytes (TILs) were gated for CD3 expression and (B) median fluorescence intensity (MFI) of PD-1 expression on CD3+ cells quantified between control nontreatment (No Tx) and DC vaccine treatment groups (n = 4/group). Data shown are representative of 1 experiment repeated 2 times with similar findings. FACS-sorted CD3+Thy1.2+ TILs from DC vaccine–treated tumor-bearing mice were cocultured with i.c.-derived tumor bulk with or without ex vivo PD-1 mAb, and tumor cytolysis (C) at 4 hours was quantified (*P < 0.05) (n = 4/group). (D) Mice were randomized into control (tumor-bearing, no treatment), PD-1 mAb, DC vaccine, and DC vaccine plus PD-1 mAb treatment groups. Graphs show evaluation of survival (n = 6/group) (***P < 0.001). Data shown are representative of 1 experiment repeated 4 times with similar findings. Each point represents 1 cell (A) or 1 subject (BD). Box-and-whisker plots are used to graphically represent the median (line within box), upper- and lower- quartile (bounds of box), and maximum and minimum values (bars) (B and C). A Student’s t test was used to calculate statistical significance (B and C), and survival differences were calculated using log rank statistical tests and graphed using the method of Kaplan-Meier (D).
Figure 3
Figure 3. PD-1 mAb blockade enhances the intratumoral CD8+ T cell response.
Survival of mice from control (tumor bearing, no treatment), PD-1 mAb, DC vaccine, and DC vaccine plus PD-1 mAb treatment groups when (A) CD4+ cells or (B) CD8+ cells were depleted is shown (n = 6/group). (C) An absolute number T lymphocytes was isolated from tumor-bearing cerebral hemispheres and cells were then analyzed by flow cytometry (***P < 0.001). (D) The absolute CD8+ count was plotted against the percentage of CD25+CD8+ activated lymphocytes and compared across different treatment groups (n = 4/group) (**P<0.01). Data shown are representative of 1 experiment repeated 4 times with similar endings. Each point represents 1 subject (A–D). Box-and-whisker plots were used to graphically represent the median (line within box), upper- and lower- quartile (bounds of box), and maximum and minimum values (bars) (C). Survival differences were calculated using log-rank statistical tests and graphed using the method of Kaplan-Meier (A and B), and the Student’s t test was used to calculate statistical significance at individual time points.
Figure 4
Figure 4. PD-1 mAb blockade increases the population of T cells expressing memory and tumor homing markers.
(AC) Splenic lymphocytes and tumor-infiltrating lymphocytes (TILs) from DC vaccine with or without PD-1 mAb were stained with CD8+CD44+ cells and analyzed by flow cytometry (n = 4/group) (**P < 0.01). (D and E) CD62L+ cells (gated from CD8+CD44+ cells) were analyzed by flow cytometry (n = 4/group) (*P < 0.05, ***P < 0.001). (F and G) CD49d+ cells (gated from CD8+CD44+ cells) were analyzed by flow cytometry (n = 4/group) (*P < 0.05). Data shown are representative of 1 experiment repeated 2 times with similar findings. (H) Survival of long-term DC vaccine plus PD-1 mAb survivors challenged with GL261 glioma cells in the contralateral brain was monitored and compared with naive control mice (control, n = 6; DC vaccine plus PD-1 mAb, n = 5) (****P < 0.0001). Data shown are representative of 1 experiment repeated 3 times with similar findings. Each point represents 1 subject (A, B, and DG). Box-and-whisker plots were used to graphically represent the median (line within box), upper- and lower- quartile (bounds of box), and maximum and minimum values (bars) (A, B, and DG). Statistical analyses were performed by a Student’s t test (A, B, and DG) and Kaplan-Meier method (H).
Figure 5
Figure 5. Ex vivo PD-1 blockade enhances TIL cytotoxicity against human GBM.
(A and B) 4’,6-diamidino-2-phenylindole (DAPI), (C and D) CD8, (E and F) PD-1, and (G and H) CD8 and PD-1 costaining is shown across pre- and post-DC vaccine samples from a representative glioblastoma (GBM) patient (40× magnification). (I) Percent PD-1 expression on CD8+ TILs across pre- and post-DC vaccine treatment patient samples was quantified (n = 6) (**P<0.01). (J) TIL cytotoxicity against human GBM at 15 hours with and without PD-1 mAb blockade is shown (n = 4). Each point represents 1 subject (I and J). Box-and-whisker plots were used to graphically represent the median (line within box), upper- and lower- quartile (bounds of box), and maximum and minimum values (bars) (I). Statistical analyses were performed using the Student’s t test (I).
Figure 6
Figure 6. Therapeutic benefit for i.c. glioma is dependent on TIL infiltration and activation.
DC vaccination promotes activation of a significant tumor-infiltrating lymphocyte (TIL) population, which is then further activated in the presence of PD-1 mAb blockade.

References

    1. Crespo I, et al. Molecular and Genomic Alterations in Glioblastoma Multiforme. Am J Pathol. 2015;185(7):1820–1833. doi: 10.1016/j.ajpath.2015.02.023. - DOI - PubMed
    1. Johnson DR, O’Neill BP. Glioblastoma survival in the United States before and during the temozolomide era. J Neurooncol. 2012;107(2):359–364. doi: 10.1007/s11060-011-0749-4. - DOI - PubMed
    1. Chandana SR, Movva S, Arora M. Primary brain tumors in adults. Am Fam Physician. 2008;77(10):1423–1430. - PubMed
    1. Liau LM, et al. Dendritic cell vaccination in glioblastoma patients induces systemic and intracranial T-cell responses modulated by the local central nervous system tumor microenvironment. Clin Cancer Res. 2005;11(15):5515–5525. doi: 10.1158/1078-0432.CCR-05-0464. - DOI - PubMed
    1. Prins RM, et al. Comparison of glioma-associated antigen peptide-loaded versus autologous tumor lysate-loaded dendritic cell vaccination in malignant glioma patients. J Immunother. 2013;36(2):152–157. doi: 10.1097/CJI.0b013e3182811ae4. - DOI - PMC - PubMed