
E2f8 mediates tumor suppression in postnatal liver development

Lindsey N Kent et al. J Clin Invest. .

Abstract

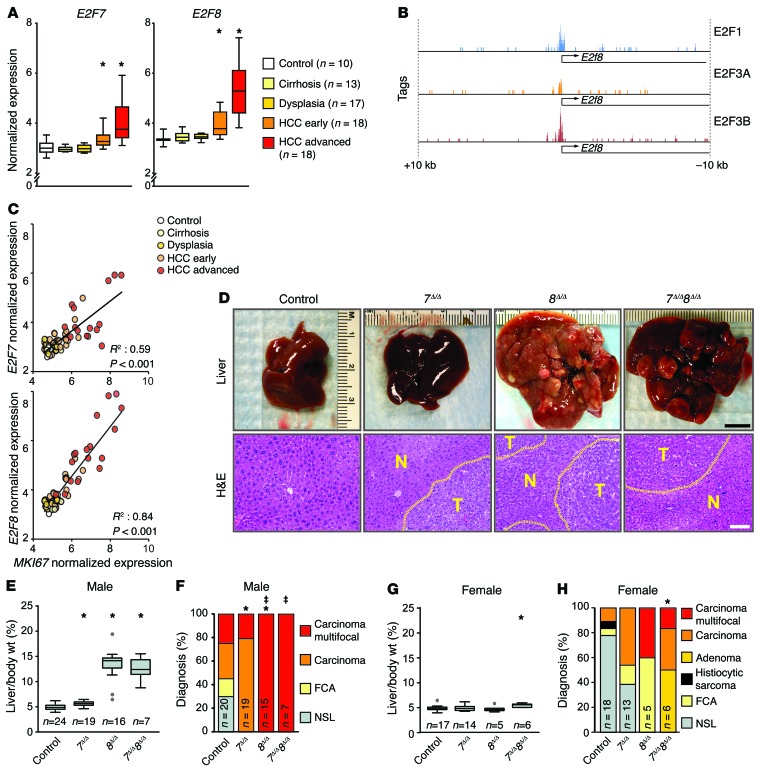
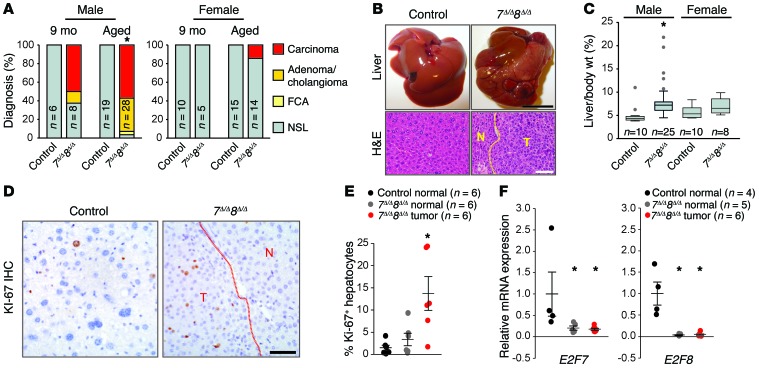
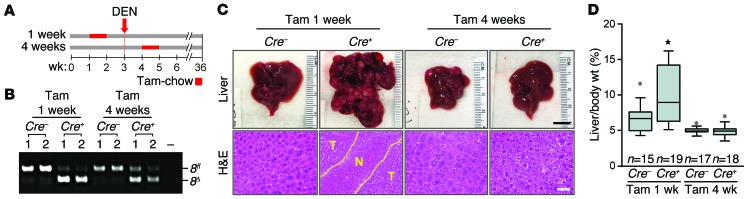
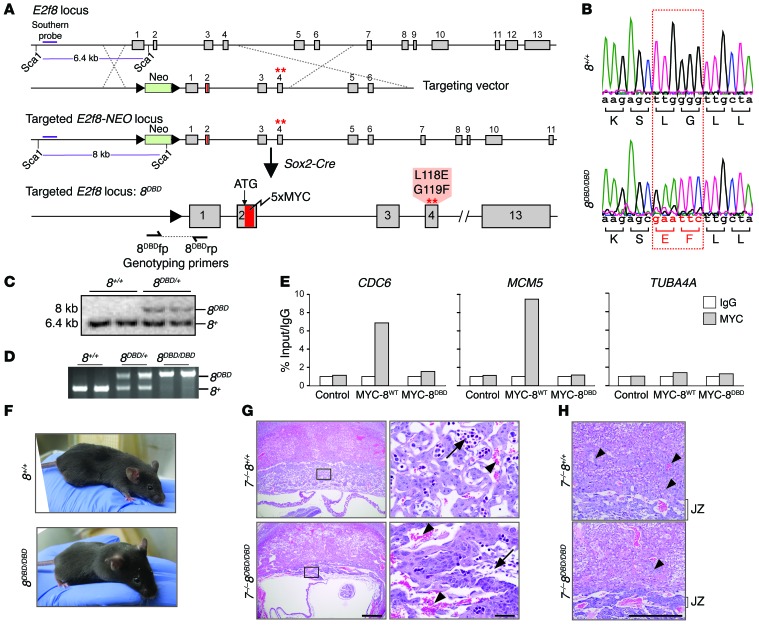
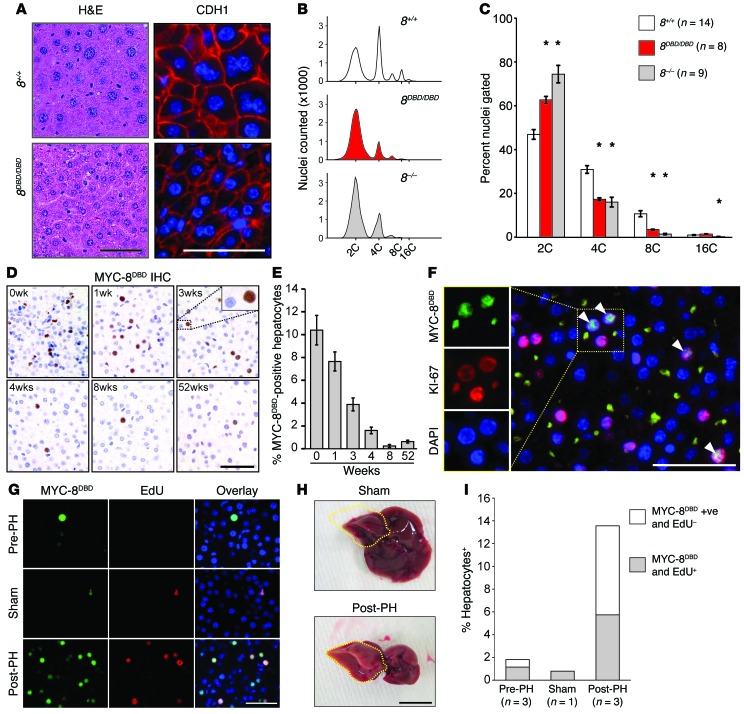
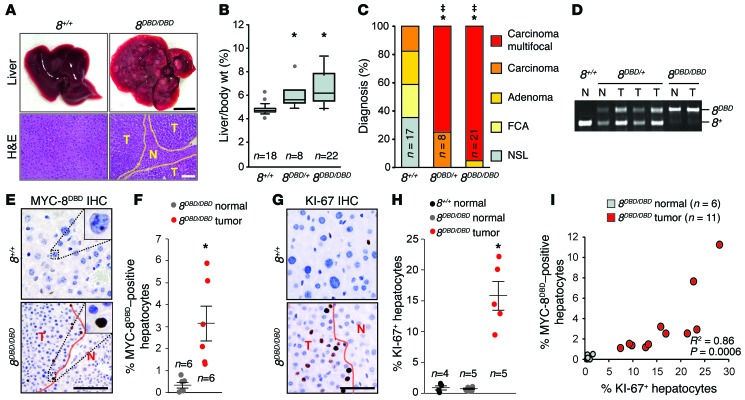
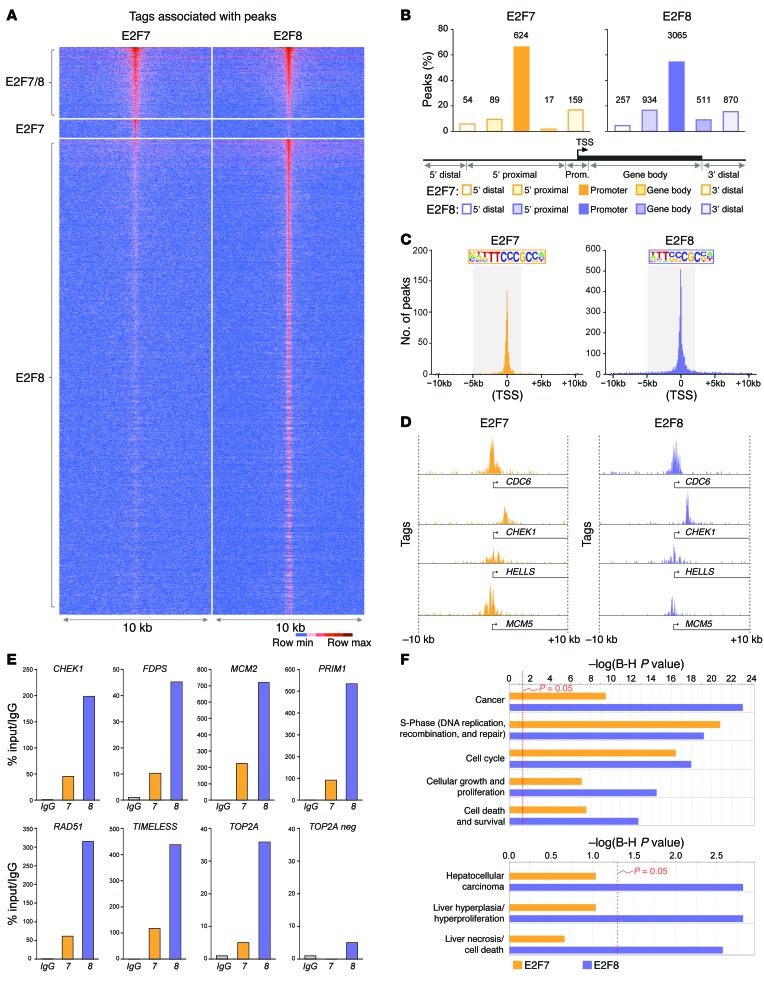
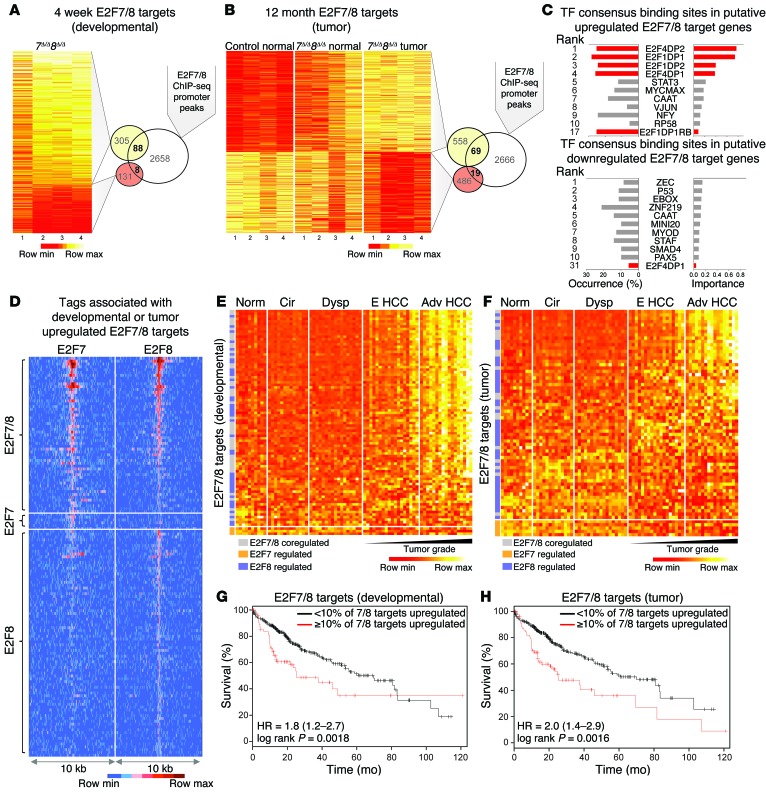
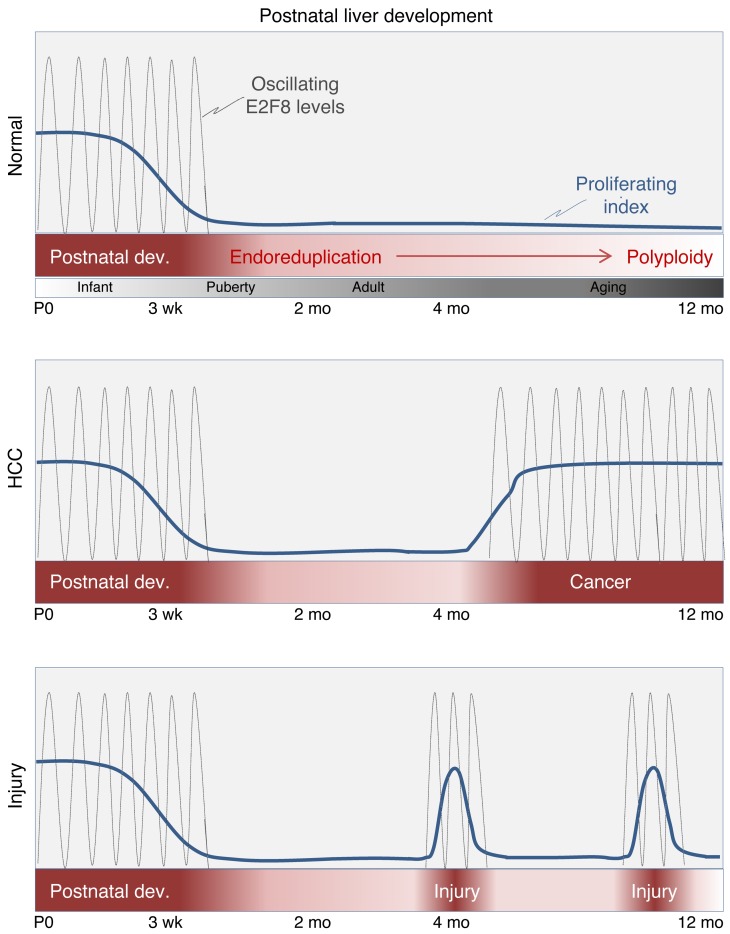
E2F-mediated transcriptional repression of cell cycle-dependent gene expression is critical for the control of cellular proliferation, survival, and development. E2F signaling also interacts with transcriptional programs that are downstream of genetic predictors for cancer development, including hepatocellular carcinoma (HCC). Here, we evaluated the function of the atypical repressor genes E2f7 and E2f8 in adult liver physiology. Using several loss-of-function alleles in mice, we determined that combined deletion of E2f7 and E2f8 in hepatocytes leads to HCC. Temporal-specific ablation strategies revealed that E2f8's tumor suppressor role is critical during the first 2 weeks of life, which correspond to a highly proliferative stage of postnatal liver development. Disruption of E2F8's DNA binding activity phenocopied the effects of an E2f8 null allele and led to HCC. Finally, a profile of chromatin occupancy and gene expression in young and tumor-bearing mice identified a set of shared targets for E2F7 and E2F8 whose increased expression during early postnatal liver development is associated with HCC progression in mice. Increased expression of E2F8-specific target genes was also observed in human liver biopsies from HCC patients compared to healthy patients. In summary, these studies suggest that E2F8-mediated transcriptional repression is a critical tumor suppressor mechanism during postnatal liver development.


Figures

Figure 1
Figure 1. Loss of atypical E2Fs leads to carcinogen-induced HCC.
(A) Box plots showing the mRNA levels of E2F7 and E2F8 from patients with normal or diseased livers derived from Affymterix Microarrays, Wilcoxon tests with Bonferroni’s correction for multiple tests. *, vs. control: E2F7 HCC-early, P = 0.020; HCC-advanced, P < 0.001; E2F8 HCC-early, P = 0.001; and HCC-advanced, P < 0.001. (B) Promoter occupancy of E2Fs on the E2f8 promoter. E2F1, E2F3A, and E2F3B tags were identified by ChIP-seq conducted in MEFs overexpressing E2F1, E2F3A, or E2F3B. (C) Correlation between expression of E2F7/8 and MKI67 mRNA levels in the data set described in A. P values, linear regression analysis. (D) Representative pictures of livers (top) and H&E-stained liver sections (below) from DEN-treated 9-month-old 7fl/fl 8fl/fl (control), Alb-Cre 7fl/fl (7Δ/Δ), Alb-Cre 8fl/fl (8Δ/Δ), and Alb-Cre 7fl/fl 8fl/fl (7Δ/Δ 8Δ/Δ) male mice. Areas of HCC are outlined by dotted lines. T and N, tumor and normal liver, respectively. Scale bars: 1 cm (top) and 100 μm (bottom). (E) Box plots showing the ratio of liver vs. body weight (liver/body wt.) of 9-month-old DEN-treated male mice. Outliers are represented by gray dots. Wilcoxon tests with Bonferroni’s correction. *, vs. control: 7Δ/Δ, P = 0.009; 8Δ/Δ, P < 0.001; and 7Δ/Δ 8Δ/Δ, P < 0.001. (F) Histopathological analysis of livers from E. FCA, focal cellular atypia, NSL, no significant lesions. Fisher’s exact tests with Bonferroni’s correction. *, carcinoma (focal/multifocal) vs. control: 7Δ/Δ, P = 0.004; and 8Δ/Δ, P = 0.13. ‡, multifocal carcinoma vs. control: 8Δ/Δ, P < 0.001; and 7Δ/Δ 8Δ/Δ, P = 0.015. (G) Box plots showing liver/body wt. of 9-month-old DEN-treated female mice. Wilcoxon tests with Bonferroni’s correction. *, 7Δ/Δ 8Δ/Δ vs. control, P < 0.001. (H) Histopathological analysis of livers from G. Fisher’s exact tests with Bonferroni’s correction. *P = 0.026, carcinoma vs. control. n, number of mice or patients per group.
Figure 2
Figure 2. Loss of atypical E2Fs in hepatocytes leads to spontaneous HCC.
(A) Histopathological analysis of livers at 9 months of age or at time of natural death (aged) of control or 7Δ/Δ 8Δ/Δ mice. Fisher’s exact tests were conducted between control and 7Δ/Δ 8Δ/Δ samples comparing carcinoma (focal and multifocal) to no significant lesion (NSL); *P = 0.004. FCA, focal cellular atypia. (B) Representative pictures of livers (top) and H&E-stained liver sections (below) from controls or 7Δ/Δ 8Δ/Δ male mice at time of natural death. Scale bars: 1 cm (top) and 100 μm (bottom). (C) Box plots showing the liver/body wt. from control or 7Δ/Δ 8Δ/Δ male and female mice at time of natural death. 7Δ/Δ 8Δ/Δ males, P < 0.001; Wilcoxon tests. (D) IHC for KI-67 showing proliferating hepatocytes in control normal liver, 7Δ/Δ 8Δ/Δ normal liver, and 7Δ/Δ 8Δ/Δ tumor tissue from male mice at time of natural death. Scale bar: 50 μm. (E) Quantification of the KI-67 IHC in D. At least 100 hepatocytes were counted for each liver. Dots represent values for individual mice and lines represent means ± SEM. Wilcoxon tests with Bonferroni’s correction for multiple tests; *P = 0.026 for 7Δ/Δ 8Δ/Δ tumor samples vs. control. (F) mRNA levels of E2f7 and E2f8 in control normal liver and 7Δ/Δ 8Δ/Δ tumor and adjacent normal tissue from male mice at time of natural death measured by qPCR. Dots represent values for individual mice and lines represent means ± SEM. Wilcoxon tests with Bonferroni’s correction. E2F7: 7Δ/Δ 8Δ/Δ normal vs. control, P = 0.04; and 7Δ/Δ 8Δ/Δ tumor vs control, P = 0.028. E2F8: 7Δ/Δ 8Δ/Δ normal vs. control, P = 0.04; and 7Δ/Δ 8Δ/Δ tumor vs. control, P = 0.028. n, number of mice in each group.
Figure 3
Figure 3. E2F8 tumor suppressor function during early postnatal development.
(A) Diagram illustrating the temporal deletion of E2f8 using Alb-CreERT2 E2f8fl/fl (Cre) and Alb-CreERT2 E2f8fl/fl (Cre+) male littermates were fed tamoxifen chow (Tam) for 7 days, starting at their first and fourth week of life. DEN was administered to all mice at 20 days of age and mice were harvested at 9 months of age. (B) PCR genotyping of liver samples from 9-month-old DEN-treated Cre and Cre+ male mice. The 8fl (670 bp) and the 8Δ band (500 bp) are noted. (C) Representative pictures of livers (top) and H&E-stained liver sections (below) from 9-month-old DEN treated Cre and Cre+ male mice. Areas of HCC are outlined by dotted lines. T and N, tumor and normal liver, respectively. Scale bars: 1 cm (top) and 100 μm (bottom). (D) Box plots showing the liver/body wt. of mice from C. Statistical significance was determined using Student’s t tests comparing Cre and Cre+ groups; *P = 0.007. n, number of mice in each group.
Figure 4
Figure 4. DNA binding activity is required for E2F8 function during development.
(A) Diagram of the mouse E2f8 locus, targeting vector, and targeted E2f8 locus prior to and after germ line deletion of the neomycin (NEO) cassette using Sox2-Cre. A 5×MYC tag (red) was inserted after the ATG and the first DNA binding domain (DBD1) was mutated; amino acid changes are noted. Dashed lines show homologous recombination between targeting vector and endogenous locus. The purple line represents the Southern probe used to test embryonic stem (ES) cell clones after Sca1 digestion. (B) Sequencing histogram of wild-type (8+/+) and 8DBD/DBD mice showing the mutation in DBD1 of E2f8. Altered nucleotides and resulting amino acid changes are shown in red. (C) Southern blotting for the E2f8+ and E2f8DBD alleles in ES cells. (D) PCR genotyping of DNA from 8+/+, 8DBD/+, and 8DBD/DBD mice using primers flanking the LoxP site shown in A. The 8DBD (320 bp) and 8+ (209 bp) bands are noted. (E) ChIP-qPCR using IgG or MYC antibodies in HepG2 cells (control) or HepG2 cells expressing 5×MYC-tagged wild-type E2F8 (MYC-8wt) or 5×MYC-tagged DBD E2F8 (MYC-8DBD). CDC6 and MCM5 are established E2F targets; TUBA4A is shown as a negative control. Percentage of input values for MYC-tagged E2F8 were normalized to IgG. (F) Pictures of 8+/+ and 8DBD/DBD mice. (G) H&E-stained sections from E10.5 7–/– 8+/+ and 7–/– 8DBD/DBD placentation sites illustrating altered placental architecture with a disruption in fetal capillary formation and pooling of maternal blood in 7–/– 8DBD/DBD placentas. Arrows, fetal blood vessels. Arrowheads, maternal blood sinuses. Scale bars: 500 μm (left) and 50 μm (right). (H) Higher magnification of sections from G illustrating altered placental architecture with compaction of the placental junctional zone (JZ) and limited trophoblast invasion (arrowheads) in 7–/– 8DBD/DBD placentas. Scale bar: 500 μm.
Figure 5
Figure 5. E2F8 DNA binding activity is essential for endoreduplication.
(A) Histology of livers from 12-month-old 8+/+ and 8DBD/DBD mice. H&E-stained sections (left), immunofluorescence (IF; right) for cadherin 1 (CDH1) (red) and DAPI (blue). Scale bars: 50 μm. (B) Representative fluorescence-activated cell sorting profiles of propidium iodide–stained liver nuclei from 4-month-old 8+/+, 8DBD/DBD, and 8–/– mice. (C) Nuclear liver ploidy of mice from B. Bars represent means ± SEM. Wilcoxon tests with Bonferroni’s correction for multiple tests. *, 8DBD/DBD and/or 8–/– vs. 8+/+. For 8DBD/DBD: 2C, P = 0.002; 4C, P < 0.001; and 8C, P < 0.001. For 8–/–: 2C, P < 0.001; 4C, P = 0.001; 8C, P < 0.001; and 16C, P = 0.002. (D) IHC using Myc epitope–specific antibodies that recognize the expression of 5×Myc-tagged 8DBD (MYC-8DBD) in livers of 8DBD/DBD mice at the indicated ages. Scale bar: 50 μm. (E) Quantification of MYC-8DBD expression in D. Average percentage of positive hepatocytes per ×40 field ± SEM for 2 livers for 0 to 8 weeks and 1 liver for 52 weeks. At least 640 hepatocytes were counted per liver. (F) IF for MYC-8DBD (green), KI-67 (red), and DAPI (blue) in livers of 3-week-old 8DBD/DBD mice. Colocalization of 8DBD and KI-67 (arrowheads). Scale bar: 50 μm. (G) IF for MYC-8DBD (green), EdU (red), and DAPI (blue) of liver sections from tissue removed during partial hepatectomy (Pre-PH), from sham surgery mice (Sham), or regenerating tissue 32 hours after partial hepatectomy (Post-PH). Scale bar: 50 μm. (H) Representative pictures of Sham- and Post-PH–treated livers. The right lobe (which was not excised) is outlined in yellow. Scale bar: 1 cm. (I) Quantification of MYC-8DBD–positive and EdU-positive hepatocytes from livers described in G. At least 100 hepatocytes were counted per liver. n, number of mice per group.
Figure 6
Figure 6. E2F8 DNA binding activity is essential for tumor suppression.
(A) Representative pictures of livers (top) and H&E-stained sections (bottom) from 8+/+ and 8DBD/DBD DEN-treated 9-month-old male mice. Areas of HCC are outlined by dotted lines. T and N, tumor and normal liver, respectively. Scale bars: 1 cm (top) and 100 μm (bottom). (B) Box plots showing the liver/body wt. of mice from A. Wilcoxon tests with Bonferroni’s correction for multiple tests. *, vs. 8+/+ livers. 8DBD/+, P = 0.002; 8DBD/DBD, P < 0.001. (C) Histopathological analysis of livers from A. Fisher’s exact tests with Bonferroni’s correction. *, carcinoma (focal and multifocal) vs. 8+/+. 8DBD/+, P = 0.001 and 8DBD/DBD, P < 0.001. ‡, multifocal carcinoma vs. 8+/+. 8DBD/+, P < 0.001; 8DBD/DBD, P < 0.001. FCA, focal cellular atypia, NSL, no significant lesions. (D) Genotyping PCR of normal and tumor liver samples from A. (E) IHC using Myc epitope–specific antibodies that recognize the expression MYC-8DBD in livers from A. Scale bar: 50 μm. (F) Quantification of MYC-8DBD expression from E. At least 180 hepatocytes were counted per liver. Dots indicate values for individual mice and lines indicate mean ± SEM. Student’s t tests comparing 8DBD/DBD normal vs. 8DBD/DBD tumor samples. *P = 0.016. (G) IHC for KI-67 in livers from A. Scale bar: 50 μm. (H) Quantification of KI-67 expression from G. At least 210 hepatocytes were counted per liver. Dots indicate values for individual mice and lines indicate mean ± SEM. Wilcoxon tests with Bonferroni’s correction. *P = 0.04 for 8DBD/DBD tumor vs. 8+/+ normal. (I) Correlation between the percentage of cells expressing MYC-8DBD and KI-67 in normal and tumor areas. Each circle represents the percentage of positive hepatocytes in one ×40 field. R2 = Spearman’s rho P values were used to determined correlation between MYC-8DBD and KI-67 expression. n, number of mice per group.
Figure 7
Figure 7. Identification of HCC-relevant E2F targets by ChIP-seq.
(A) Tag-intensity heat map showing the distribution of tags for all E2F7 and E2F8 peaks identified by ChIP-seq. Peaks were centered on E2F8-specific samples except for peaks that were specific to E2F7. (B) Percentage of E2F7- and E2F8-specific peaks in different gene regions. Gene regions were defined by distance from the transcriptional start site (TSS) as follows: 5′ distal (–50 Gb to –50 kb), 5′ proximal (–50 kb to –5 kb), promoter (–5 kb to +2 kb), gene body (+2 kb to end of transcript), 3′ distal (end of transcript to +30 Gb). Number of peaks for each gene region is indicated above bars. (C) Graph depicting the frequency of E2F7 and E2F8 tags relative to the TSS (0). The promoter region (–5 kb to +2 kb from the TSS) is highlighted and the consensus binding sequence at the promoter identified by HOMER is depicted. (D) Examples of E2F7 and E2F8 occupancy at selected promoters. (E) ChIP-qPCR validation using IgG, E2F7, or E2F8 antibodies in HepG2 cells. Selected target promoters are shown (CHEK1, FDPS, MCM2, PRIM1, RAD51, TIMELESS, and TOP2A). A nonpromoter region of TOP2A (TOP2A neg) was used as a negative control. % input values were normalized to IgG. Primers were designed to amplify ChIP-seq–identified peak regions. (F) Gene ontology using ingenuity pathway analysis (IPA) software depicts the estimated contribution of gene functions associated with E2F7- or E2F8-bound promoters. Functional categories related to cell cycle, cancer, and liver disease with the lowest P values are shown. Bars indicate the Benjamini-Hochberg–adjusted (B-H) P value; the threshold of P = 0.05 is shown.
Figure 8
Figure 8. Identification of putative direct targets of E2F7/8 and evaluation of their relevance to human disease.
(A) Fold-change heat map of differentially expressed genes (DEGs) in livers from 4-week-old 7Δ/Δ 8Δ/Δ and control mice measured by Agilent Microarrays. DEGs are defined as having ≥ 1.5-fold change vs. control (P ≤ 0.05). Overlap of DEGs and E2F7/8-occupied promoters (ChIP-seq) represent putative ‘developmental’-associated direct targets. (B) Expression heat map of DEGs in livers or tumors from 12-month-old mice as measured by RNA-seq. DEGs were identified using CuffDiff (≥ 1.5-fold change and FDR < 0.5 between 7Δ/Δ 8Δ/Δ tumor vs. normal control samples). Overlap of DEGs and E2F7/8-occupied promoters represent putative ‘tumor’-associated direct targets. (C) Transcription factor (TF) binding site analysis of putative E2F7/8 targets showing the occurrence and estimated importance of the top 10 TF sites as well as all E2F sites (red). (D) Tag-intensity heat map showing the distribution of tags for all E2F7 and E2F8 promoter peaks identified by ChIP-seq that were associated with DEGs. Peaks were centered on E2F8-specific samples except for peaks that were specific to E2F7. (E) Heat map showing the expression of the 88 developmental-associated E2F7/8 target genes (from A) in normal (Norm) and diseased human patient samples. Cirrhosis (Cir), dysplasia (Dysp), early (E HCC), or advanced HCC (Adv HCC) human livers. (F) Heat map showing the expression of the 69 tumor-associated E2F7/8 target genes (from B) in normal and diseased human patient samples. (G) Kaplan-Meier plots showing % survival of patients that have low (<10%; black line) or high (≥10%; red line) expression of the 88 ‘developmental’-associated target genes. (H) Kaplan-Meier plots showing % survival of patients that have low (<10%; black line) or high (≥10%; red line) expression of the 69 ‘tumor’-associated target genes. HR, hazard ratio (G and H).
Figure 9
Figure 9. Schematic diagram of hepatocyte proliferation during mouse development, liver injury, and cancer.
Summary diagram illustrating the timing of hepatocyte proliferation and the oscillatory nature of E2F8 protein expression during mouse postnatal liver development, cancer, and liver injury. Mouse hepatocyte proliferation during the first weeks of life is a critical time period when the liver is most susceptible to the initiation of HCC. E2F8 plays a critical role in suppressing HCC during this early developmental stage. We also suggest that E2F8-mediated transcriptional repression in cycling hepatocytes may be critical to suppress carcinogenesis following acute (depicted in the bottom panel) or chronic liver injury.

References

    1. de Bruin A, Maiti B, Jakoi L, Timmers C, Buerki R, Leone G. Identification and characterization of E2F7, a novel mammalian E2F family member capable of blocking cellular proliferation. J Biol Chem. 2003;278(43):42041–42049. doi: 10.1074/jbc.M308105200. - DOI - PubMed
    1. Di Stefano L, Jensen MR, Helin K. E2F7, a novel E2F featuring DP-independent repression of a subset of E2F-regulated genes. EMBO J. 2003;22(23):6289–6298. doi: 10.1093/emboj/cdg613. - DOI - PMC - PubMed
    1. Maiti B, et al. Cloning and characterization of mouse E2F8, a novel mammalian E2F family member capable of blocking cellular proliferation. J Biol Chem. 2005;280(18):18211–18220. doi: 10.1074/jbc.M501410200. - DOI - PubMed
    1. Logan N, et al. E2F-8: an E2F family member with a similar organization of DNA-binding domains to E2F-7. Oncogene. 2005;24(31):5000–5004. doi: 10.1038/sj.onc.1208703. - DOI - PubMed
    1. Iaquinta PJ, Lees JA. Life and death decisions by the E2F transcription factors. Curr Opin Cell Biol. 2007;19(6):649–657. doi: 10.1016/j.ceb.2007.10.006. - DOI - PMC - PubMed

Publication types

MeSH terms