. 2017 Jul;78(1):40-48.
doi: 10.1002/mrm.26347. Epub 2016 Jul 25.

Detection of 2-hydroxyglutarate in brain tumors by triple-refocusing MR spectroscopy at 3T in vivo

Affiliations

Detection of 2-hydroxyglutarate in brain tumors by triple-refocusing MR spectroscopy at 3T in vivo

Zhongxu An et al. Magn Reson Med. 2017 Jul.

Abstract

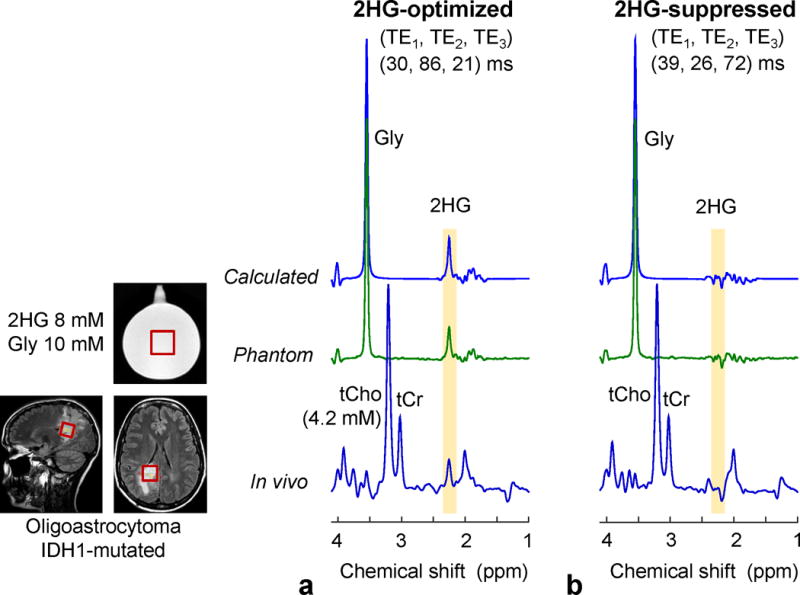
Purpose: To test the efficacy of triple-refocusing MR spectroscopy (MRS) for improved detection of 2-hydroxyglutarate (2HG) in brain tumors at 3T in vivo.

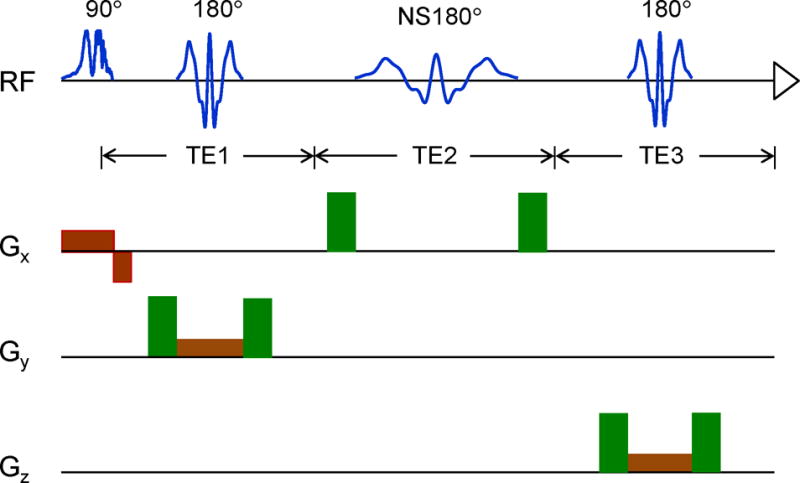
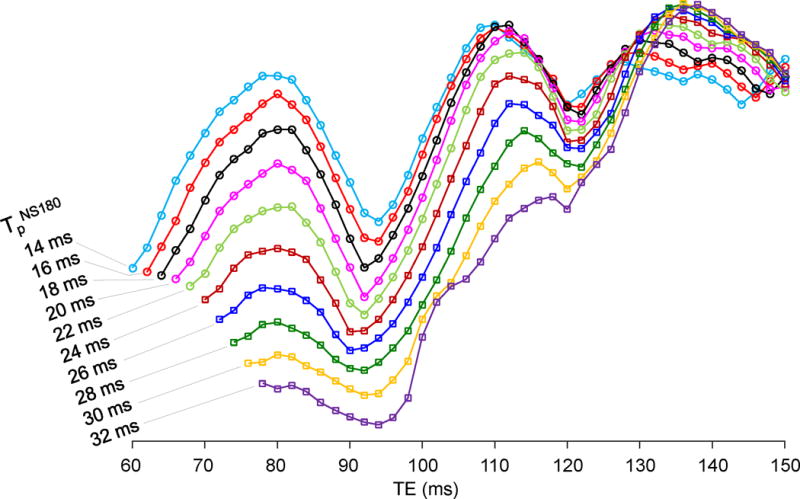
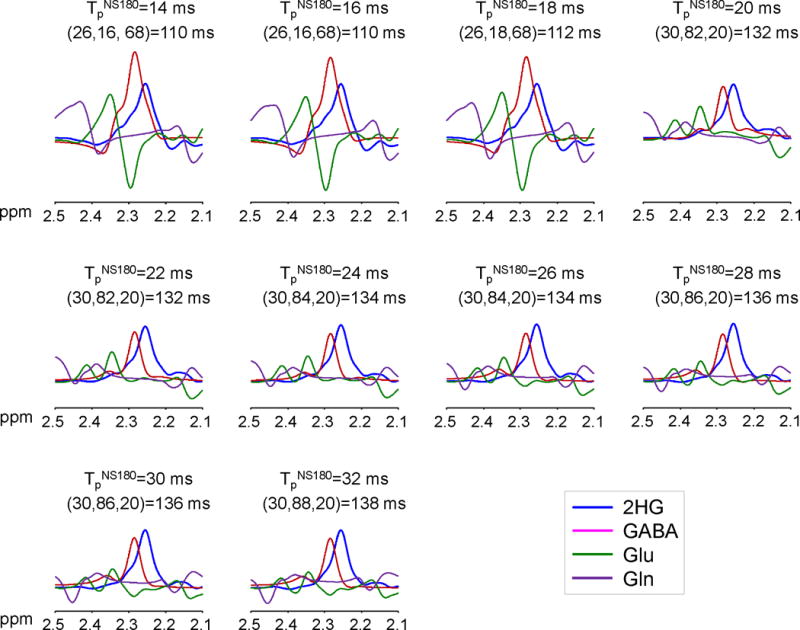
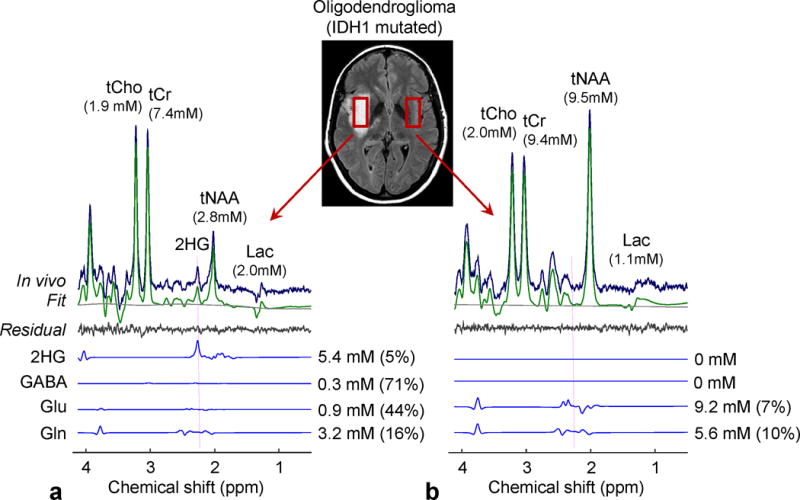
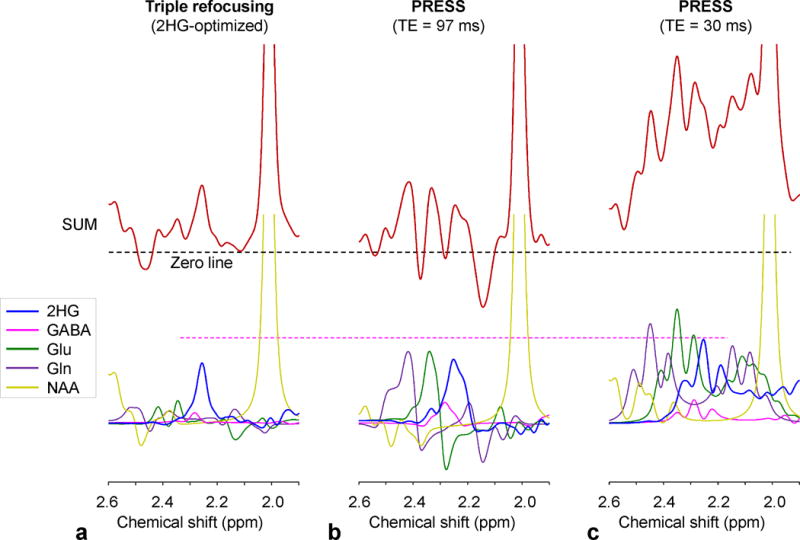
Methods: The triple-refocusing sequence parameters were tailored at 3T, with density-matrix simulations and phantom validation, for enhancing the 2HG 2.25-ppm signal selectivity with respect to the adjacent resonances of glutamate (Glu), glutamine (Gln), and gamma-aminobutyric acid (GABA). In vivo MRS data were acquired from 15 glioma patients and analyzed with LCModel using calculated basis spectra. Metabolites were quantified with reference to water.

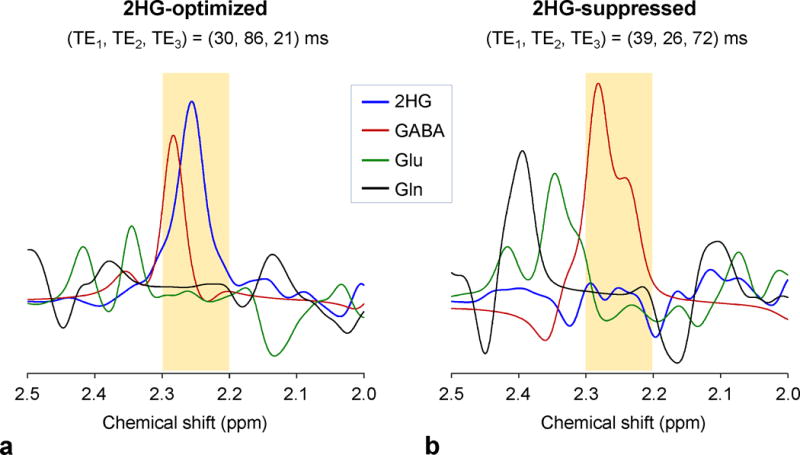
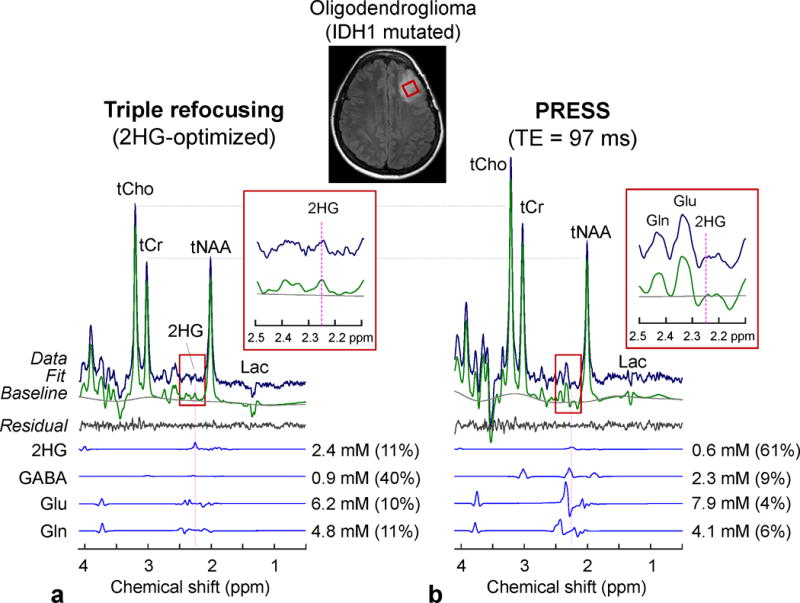
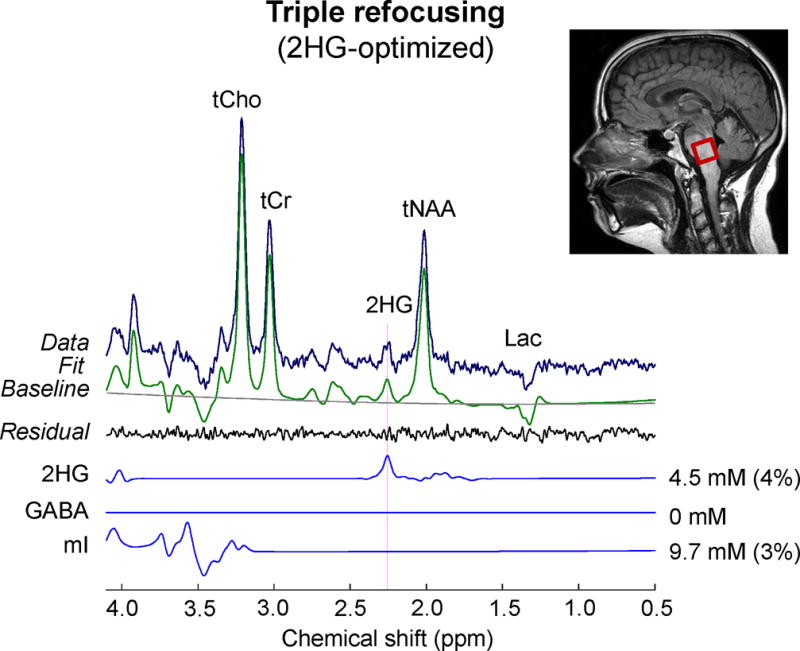
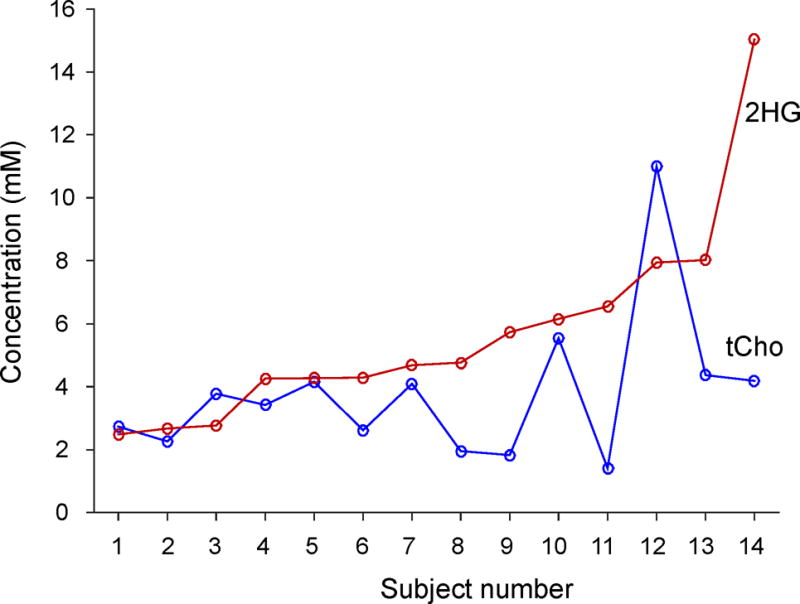
Results: A triple-refocusing sequence (echo time = 137 ms) was obtained for 2HG detection. The 2HG 2.25-ppm signal was large and narrow while the Glu and Gln signals between 2.2 and 2.3 ppm were minimal. The optimized triple refocusing offered improved separation of 2HG from Glu, Gln and GABA when compared with published MRS methods. 2HG was detected in all 15 patients, the estimated 2HG concentrations ranging from 2.4 to 15.0 mM, with Cramer-Rao lower bounds of 2%-11%. The 2HG estimates did not show significant correlation with total choline.

Conclusion: The optimized triple refocusing provides excellent 2HG signal discrimination from adjacent resonances and may confer reliable in vivo measurement of 2HG at relatively low concentrations. Magn Reson Med 78:40-48, 2017. © 2016 International Society for Magnetic Resonance in Medicine.

Keywords: 1H MRS; 2-hydroxyglutarate; 3T; glioma; human brain tumor; isocitrate dehydrogenase; triple refocusing.


Figures

Figure 1
Figure 1
(a) Schematic diagram of the triple-refocusing sequence used is shown with slice selective gradients (brown) and spoiling gradients (green) (strength 32 mT/m, length 1.7 ms, total slope length 0.8 ms). The durations of the slice selective RF pulses were kept the same in numerical simulations and experiments. The duration of the non-slice selective, second 180° RF pulse (NS180) was varied in the simulations.
Figure 2
Figure 2
TE dependence of the numerically-calculated 2HG 2.25-ppm peak amplitude is shown for ten values of the non-selective, second 180° RF pulse duration (TpNS180) of the triple-refocusing sequence used in the study. The 2HG peak amplitude was obtained from the spectra broadened to singlet linewidth of 5 Hz.
Figure 3
Figure 3
Numerically calculated spectra of 2HG, GABA, Glu and Gln at equal concetrations for each of TpNS180 = 14 – 32 ms with 2 ms increments. The subecho time set (TE1, TE2, TE3), shown together with TE at the top in each figure, was chosen at which the 2HG 2.25-ppm peak amplitude was maximum for each TpNS180. Spectra were broadened to singlet linewidth of 5 Hz. Shown at the top of each figure are TpNS180, (TE1, TE2, TE3), and TE.
Figure 4
Figure 4
Spectra of 2HG, GABA, Glu and Gln at equal concentrations, numerically calculated for the 2HG-optimized and 2HG-suppressed triple-refocusing sequences.
Figure 5
Figure 5
Calculated, in-vitro and in-vivo spectra, obtained with the 2HG-optimized and 2HG-suppressed triple-refocusing sequences. The MRS voxel positioning (2.3×2.3×2.3 cm3) is shown in the T2w-FLAIR images. The calculated and in-vitro spectra were broadened to match the in-vivo linewidth (singlet FWHM = 5 Hz). The 2HG-to-Gly concentration ratio was 8:10 for the calculation and in vitro. The in-vivo scan parameters included NSA = 128, TR = 2 s, and TE = 137 ms for both scans.
Figure 6
Figure 6
In-vivo spectra from an IDH1-mutated oligodendroglioma (a) and the contralateral voxel (b), obtained with the 2HG-optimized triple-refocusing sequence, are shown together with LCModel outputs and spectra of 2HG, GABA, Glu and Gln. The estimated concentrations of the metabolites are presented with percentage CRLB values. Vertical dotted lines were drawn at 2.25 ppm. The voxel size and scan time were identical between the scans (3.2×1.5×1.2 cm3 and 12.8 min). Spectra were normalized to STEAM TE=13 ms water. The metabolite concentrations in the contralateral were estimated with reference to water at 40 M following the correction for relaxation effects using T2 = 150, 240, 290 and 180 ms for tCr, tCho, tNAA, and other metabolites, respectively (21,22), and T1 values used for tumor data correction.
Figure 7
Figure 7
In-vivo spectra from an IDH1-mutated oligodendroglioma, obtained with (a) triple refocusing and (b) PRESS TE = 97 ms (11), are shown with LCModel outputs and spectra of 2HG, GABA, Glu and Gln. The voxel size and scan time were identical between the scans (2×2×2 cm3 and 5 min). Spectra were normalized to STEAM TE = 13 ms water. Insets show magnified spectra between 2.1 and 2.5 ppm.
Figure 8
Figure 8
An in-vivo triple-refocused spectrum from a brainstem lesion is shown with LCModel outputs and spectra of 2HG, GABA, and mI. The in-vivo scan parameters included voxel size = 2×2×2 cm3, NSA = 128, TR = 2 s, and TE = 137 ms.
Figure 9
Figure 9
The estimated concentrations of 2HG and tCho in 14 glioma patients with IDH1 mutated gliomas. The data are arranged in the order of increasing 2HG level left to right.
Figure 10
Figure 10
Spectra of 2HG, GABA, Glu, Gln and NAA at a concentration ratio of 5:1:5:5:5, numerically calculated for (a) the 2HG-optimized triple refocusing, (b) PRESS TE = 97 ms (TE1 = 32 ms and TE2 = 65 ms), and (c) PRESS TE = 30 ms at 3T, are shown together with the sum spectra for each sequence. Spectra were broadened to NAA singlet linewidth of 5 Hz.

References

    1. Hanahan D, Weinberg RA. Hallmarks of cancer: the next generation. Cell. 2011;144:646–674. - PubMed
    1. DeBerardinis RJ, Thompson CB. Cellular metabolism and disease: what do metabolic outliers teach us? Cell. 2012;148:1132–1144. - PMC - PubMed
    1. Balss J, Meyer J, Mueller W, Korshunov A, Hartmann C, von Deimling A. Analysis of the IDH1 codon 132 mutation in brain tumors. Acta Neuropathol. 2008;116:597–602. - PubMed
    1. Parsons DW, Jones S, Zhang X, Lin JC, Leary RJ, Angenendt P, Mankoo P, Carter H, Siu IM, Gallia GL, Olivi A, McLendon R, Rasheed BA, Keir S, Nikolskaya T, Nikolsky Y, Busam DA, Tekleab H, Diaz LA, Jr, Hartigan J, Smith DR, Strausberg RL, Marie SK, Shinjo SM, Yan H, Riggins GJ, Bigner DD, Karchin R, Papadopoulos N, Parmigiani G, Vogelstein B, Velculescu VE, Kinzler KW. An integrated genomic analysis of human glioblastoma multiforme. Science. 2008;321:1807–1812. - PMC - PubMed
    1. Yan H, Parsons DW, Jin G, McLendon R, Rasheed BA, Yuan W, Kos I, Batinic-Haberle I, Jones S, Riggins GJ, Friedman H, Friedman A, Reardon D, Herndon J, Kinzler KW, Velculescu VE, Vogelstein B, Bigner DD. IDH1 and IDH2 mutations in gliomas. N Engl J Med. 2009;360:765–773. - PMC - PubMed

Publication types