Evaluation of Tau Imaging in Staging Alzheimer Disease and Revealing Interactions Between β-Amyloid and Tauopathy
- PMID: 27454922
- PMCID: PMC5237382
- DOI: 10.1001/jamaneurol.2016.2078
Evaluation of Tau Imaging in Staging Alzheimer Disease and Revealing Interactions Between β-Amyloid and Tauopathy
Abstract
Importance: In vivo tau imaging may become a diagnostic marker for Alzheimer disease (AD) and provides insights into the pathophysiology of AD.
Objective: To evaluate the usefulness of [18F]-AV-1451 positron emission tomography (PET) imaging to stage AD and assess the associations among β-amyloid (Aβ), tau, and volume loss.
Design, setting, and participants: An imaging study conducted at Knight Alzheimer Disease Research Center at Washington University in St Louis, Missouri. A total of 59 participants who were cognitively normal (CN) (Clinical Dementia Rating [CDR] score, 0) or had AD dementia (CDR score, >0) were included.
Main outcomes and measures: Standardized uptake value ratio (SUVR) of [18F]-AV-1451 in the hippocampus and a priori-defined AD cortical signature regions, cerebrospinal fluid Aβ42, hippocampal volume, and AD signature cortical thickness.
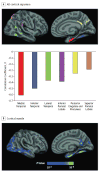
Results: Of the 59 participants, 38 (64%) were male; mean (SD) age was 74 (6) years. The [18F]-AV-1451 SUVR in the hippocampus and AD cortical signature regions distinguished AD from CN participants (area under the receiver operating characteristic curve range [95% CI], 0.89 [0.73-1.00] to 0.98 [0.92-1.00]). An [18F]-AV-1451 SUVR cutoff value of 1.19 (sensitivity, 100%; specificity, 86%) from AD cortical signature regions best separated cerebrospinal fluid Aβ42-positive (Aβ+) AD from cerebrospinal fluid Aβ42-negative (Aβ-) CN participants. This same cutoff also divided Aβ+ CN participants into low vs high tau groups. Moreover, the presence of Aβ+ was associated with an elevated [18F]-AV-1451 SUVR in AD cortical signature regions (Aβ+ participants: mean [SD], 1.3 [0.3]; Aβ- participants: 1.1 [0.1]; F = 4.3, P = .04) but not in the hippocampus. The presence of Aβ+ alone was not related to hippocampal volume or AD signature cortical thickness. An elevated [18F]-AV-1451 SUVR was associated with volumetric loss in both the hippocampus and AD cortical signature regions. The observed [18F]-AV-1451 SUVR volumetric association was modified by Aβ status in the hippocampus but not in AD cortical signature regions. An inverse association between hippocampal [18F]-AV-1451 SUVR and volume was seen in Aβ+ participants (R2 = 0.55; P < .001) but not Aβ- (R2 = 0; P = .97) participants.
Conclusions and relevance: Use of [18F]-AV-1451 has a potential for staging of the preclinical and clinical phases of AD. β-Amyloid interacts with hippocampal and cortical tauopathy to affect neurodegeneration. In the absence of Aβ, hippocampal tau deposition may be insufficient for the neurodegenerative process that leads to AD.
Conflict of interest statement
Disclosures: Dr Fagan is a member of the scientific advisory boards of IBL International and Roche and is a consultant for AbbVie, Novartis, and DiamiR. Drs Benzinger and Morris and are currently participating in a clinical trial of antidementia drugs: A4 (The Anti-Amyloid Treatment in Asymptomatic Alzheimer’s Disease) trial. Dr Benzinger also participates in the Dominantly Inherited Alzheimer Network Trials Unit and in clinical trials sponsored by Eli Lilly/Avid Radiopharmaceuticals. Dr Morris has served as a consultant for Lilly USA and Takeda Pharmaceuticals. Drs Benzinger and Morris receive research support from Eli Lilly/Avid Radiopharmaceuticals. Dr McConathy has served as a consultant for Eli Lilly/Avid Radiopharmaceuticals, GE Healthcare, and Siemens Healthcare. No other disclosures were reported.
Figures


Comment in
-
Tau and β-Amyloid-The Malignant Duo.JAMA Neurol. 2016 Sep 1;73(9):1049-50. doi: 10.1001/jamaneurol.2016.2481. JAMA Neurol. 2016. PMID: 27454015 No abstract available.
References
-
- Braak H, Braak E. Neuropathological stageing of Alzheimer-related changes. Acta Neuropathol. 1991;82(4):239–259. - PubMed
-
- Thal DR, Rüb U, Orantes M, Braak H. Phases of Aβ−deposition in the human brain and its relevance for the development of AD. Neurology. 2002;58(12):1791–1800. - PubMed
-
- Price JL, Morris JC. Tangles and plaques in nondemented aging and “preclinical” Alzheimer’s disease. Ann Neurol. 1999;45(3):358–368. - PubMed
-
- Delacourte A, David JP, Sergeant N, et al. The biochemical pathway of neurofibrillary degeneration in aging and Alzheimer’s disease. Neurology. 1999;52(6):1158–1165. - PubMed
MeSH terms
Substances
Grants and funding
- R01 AG043434/AG/NIA NIH HHS/United States
- R21 MH099979/MH/NIMH NIH HHS/United States
- P01 AG003991/AG/NIA NIH HHS/United States
- P50 AG005681/AG/NIA NIH HHS/United States
- P01 AG026276/AG/NIA NIH HHS/United States
- R01 NR012907/NR/NINR NIH HHS/United States
- R01 EB009352/EB/NIBIB NIH HHS/United States
- P30 NS098577/NS/NINDS NIH HHS/United States
- R01 NR014449/NR/NINR NIH HHS/United States
- P30 NS048056/NS/NINDS NIH HHS/United States
- R01 NR012657/NR/NINR NIH HHS/United States
- UL1 TR000448/TR/NCATS NIH HHS/United States
LinkOut - more resources
Full Text Sources
Other Literature Sources
Medical

