. 2016 Sep;12(9):755-62.
doi: 10.1038/nchembio.2141. Epub 2016 Jul 25.

Photoswitchable diacylglycerols enable optical control of protein kinase C

Affiliations

Photoswitchable diacylglycerols enable optical control of protein kinase C

James Allen Frank et al. Nat Chem Biol. 2016 Sep.

Abstract

Increased levels of the second messenger lipid diacylglycerol (DAG) induce downstream signaling events including the translocation of C1-domain-containing proteins toward the plasma membrane. Here, we introduce three light-sensitive DAGs, termed PhoDAGs, which feature a photoswitchable acyl chain. The PhoDAGs are inactive in the dark and promote the translocation of proteins that feature C1 domains toward the plasma membrane upon a flash of UV-A light. This effect is quickly reversed after the termination of photostimulation or by irradiation with blue light, permitting the generation of oscillation patterns. Both protein kinase C and Munc13 can thus be put under optical control. PhoDAGs control vesicle release in excitable cells, such as mouse pancreatic islets and hippocampal neurons, and modulate synaptic transmission in Caenorhabditis elegans. As such, the PhoDAGs afford an unprecedented degree of spatiotemporal control and are broadly applicable tools to study DAG signaling.


Conflict of interest statement

Competing Financial Interests

The authors declare no competing financial interests.

Figures

Figure 1
Figure 1. Design and synthesis of photoswitchable diacylglycerols.
The chemical structures of (a) the photoswitchable fatty acid FAAzo-4, (b) 2-O-arachidonyl-1-O-stearoyl-sn-glycerol (1,2-SAG) and 1,2-O-dioctanoyl-sn-glycerol (1,2-DOG). (c) The chemical structures of photoswitchable diacylglycerols PhoDAG-1, PhoDAG-2 and PhoDAG-3. (d) PhoDAG-1 was synthesized in four steps and 57% overall yield. (e) The UV-Vis spectra of PhoDAG-1 (25 μM in DMSO) in its dark-adapted (black), UV-adapted (gray) and blue-adapted (blue) photostationary states. The absorbance at λ = 350 nm was plotted as a function of the irradiation wavelength, demonstrating that PhoDAG-1 existed primarily in its trans- and cis-configurations under blue and UV-A irradiation, respectively. (f) PhoDAG-1 could be cycled between the two states over many cycles without fatigue. The absorbance at λ = 350 nm was plotted over multiple cycles of alternating UV-A and blue irradiation.
Figure 2
Figure 2. PhoDAG-1 enables optical control of C1-GFP translocation and intracellular Ca2+ concentration in HeLa cells.
(a) Fluorescence images showed that PhoDAG-1 (150 μM) catalyzed reversible translocation of C1-GFP in HeLa cells towards the plasma membrane only after irradiation with λ = 375 nm light. (b) C1-GFP fluorescence intensity was sampled across a representative cell. GFP fluorescence accumulated at the plasma membrane in the presence of cis-PhoDAG-1. (c) Translocation could be repeatedly triggered over multiple cycles in the presence of PhoDAG-1, and was quantified by plotting the plasma membrane to cytoplasm (PM/CP) fluorescence intensity ratio of a representative cell. (d) Patterns of C1-GFP translocation were generated by irradiation at λ = 375 nm in the presence of PhoDAG-1. (e) Fluorescence quenching dynamics of coumarin-labelled arachidonic acid (cg-AA, 100 μM) localized at the internal cell membranes after application of PhoDAG-1 (150 μM, n = 18, black) or PhoDAG-3 (150 μM, n = 19, gray) in HeLa cells. (f) The TRPC channel blocker SKF-96365 (50 μM) decreased the Ca2+ influx on application and photoactivation of PhoDAG-1 (n = 54, gray) when compared to PhoDAG-1 alone (n = 16, black). [Ca2+]i levels were monitored with the R-GECO Ca2+ sensor. (g) After incubation with PhoDAG-1 followed by the removal of extracellular compound, both cyclopiazonic acid (CPA, 50 μM, n = 64, orange) and NiCl2 (5 mM) combined with a Ca2+-free extracellular buffer (0.1 mM EGTA, n = 73, gray) reduced the Ca2+ response. Error bars were calculated as s.e.m.
Figure 3
Figure 3. PhoDAG-1 enables optical control of novel and conventional PKC isoforms.
(a) Fluorescence images of HeLa cells expressing PKCδ-RFP showed that PhoDAG-1 (100 μM) triggered the reversible translocation of PKCδ-RFP towards the plasma membrane on λ = 375 nm irradiation. (b) After photoactivation, PKCδ-RFP redistributes back to the cytoplasm (n = 19). Translocation is displayed as the plasma membrane to cytoplasm (PM/CP) fluorescence intensity ratio. (c) Oscillations of PKCδ-RFP translocation could be generated by sequential pulses of UV-A irradiation with increasing length (n = 11). (d) Changing the time between pulses of UV-A light did not affect the magnitude of the translocation. Both the 60 s (n = 13) and 240 s (n = 15) intervals showed similar translocation efficiencies. (e) After the application of trans-PhoDAG-1 (150 μM), PKCα-GFP translocation towards the plasma membrane was induced by isomerization to cis (n = 3). Multiple rounds of irradiation led to diminished translocation efficiency, corresponding to a reduced Ca2+ response on sequential photostimulations. [Ca2+]i levels (R-GECO) were displayed as the RFP fluorescence intensity and normalized to the baseline fluorescence (F/Fmin). (f,g) PKC activation was evaluated in HeLa cells expressing PKCδ-RFP and the cytosolic C kinase activation reporter, CKAR. (f) PhoDAG-1 (300 μM) triggered an increase in the cyan/yellow fluorescence emission ratio on irradiation at λ = 375 nm, indicating PKC activation (n = 49). (g) Photoactivation of PhoDAG-1 (n = 49) produced a similar FRET change when compared to 1,2-DOG (300 μM, n = 32) and PMA (5 μM, n = 31). Application of Gö-6983 (10 μM, n = 49) reversed this effect. ns = not significant P>0.05, *P<0.005, ** P<0.001. Error bars were calculated as s.e.m.
Figure 4
Figure 4. Optical control of Ca2+ oscillations in MIN6 and dissociated β-cells.
(a-c) Ca2+ oscillations in glucose-stimulated (20 mM) MIN6 cells were monitored using R-GECO. PhoDAG-1 (300 μM) decreased [Ca2+]i levels on photoactivation with λ = 375 nm light, displayed as (a) individual [Ca2+]i traces from four representative cells, and (b) a statistical analysis of the oscillation frequency (n = 38). Bar graphs represent the number of high intensity Ca2+ oscillations (>50% of highest transient in each trace) detected within every 60 s interval. (c) PhoDAG-3 (35 μM) also triggered a decrease in glucose-stimulated (20 mM) Ca2+ oscillations on photoactivation. (d) Isomerization to cis-PhoDAG-3 (35 μM, n = 6) induced a marked decrease in whole-cell voltage-gated Ca2+ (Cav) current. (e) This effect could be reversed by blue light and could be repeated over several cycles (n = 3). (f,g) In dissociated mouse β-cells, cis-PhoDAG-3 (10 μM) caused a decrease in (f) glucose-stimulated (11 mM) Ca2+ oscillations, corresponding to (g) a reduction in the Cav current (15 μM, n = 3). (h) In contrast, cis-PhoDAG-1 (200 μM) led to an increase in the Ca2+ oscillation frequency. (i) PhoDAG-1 (200 μM) had no effect on the Cav current (n = 5), however (j) a reduction in the delayed rectifier voltage-activated K+ channel (Kv) current was observed on isomerization to cis (n = 3). Error bars were calculated as s.e.m.
Figure 5
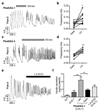
Figure 5. Optical control of insulin secretion in intact mouse pancreatic islets.
Ca2+ oscillations in glucose-stimulated (11 mM) mouse pancreatic islets were monitored using Fluo-2. (a,b) Photoactivation of PhoDAG-1 (200 μM) triggered an increase in the oscillation frequency, displayed as (a) a representative trace from a single islet and (b) the average oscillation frequencies for several islets before and after λ = 350 nm irradiation (n = 9). (c,d) Similarly, photoactivation of PhoDAG-3 (100 μM) led to a marked increase in Ca2+ oscillation frequency (n = 8). (e) The application of 1,2-DOG (100 μM) led to an increase in the oscillation frequency (n = 8). (f) As determined by a homogeneous time-resolved fluorescence (HTRF) assay, cis-PhoDAG-1 (200 μM) at 16.7 mM glucose led to a 3-fold increase in insulin secretion when compared to either trans-PhoDAG-1 or glucose-stimulated conditions (16.7 mM) alone. Similar effects were observed with 1,2-DOG (100 μM) (n = 3 assays from 6 animals). G3 = 3 mM glucose, G16.7 = 16.7 mM glucose. ns = not significant, *P<0.05, **P<0.01. Error bars were calculated as s.e.m.
Figure 6
Figure 6. PhoDAGs enable optical control of Munc13 and synaptic transmission.
(a) In HeLa cells, PhoDAG-1 (150 μM) triggered the reversible translocation of Munc13-1-GFP on photoactivation with λ = 375 nm irradiation (n = 14) towards the outer plasma membrane. (b-f) Wild type mouse hippocampal neurons were pre-incubated with PhoDAG-2 (500 μM, 20-25 min at 37 °C). The neurons were whole-cell voltage clamped and action potentials were stimulated at 0.2 Hz to evoke excitatory post synaptic currents (EPSCs). (b) The application of trans-PhoDAG-2 (red, n = 8) did not affect the initial EPSC amplitudes measured when compared to control neurons (black, n = 6). (c) Photoactivation of PhoDAG-2-treated neurons with λ = 365 nm light caused an increase in the EPSC amplitude while deactivation with λ = 425 nm light reversed the effect, plotted for two neurons pre-incubated with PhoDAG-2 (red) and for two control neurons (black). (d) Representative traces of EPSCs during activation and inactivation. Numbers are given to indicate the EPSC number. Black traces – before activation, red or blue traces – beginning of photostimulation. (e,f) The normalized change in (e) the EPSC amplitude (red = PhoDAG-2, n = 8; black = vehicle, n = 6) and (f) sEPSC frequency (red = PhoDAG-2, n = 6; black = vehicle, n = 6) over six rounds of alternating activation and inactivation. The averaged response following illumination was divided by the averaged response before illumination, and the ratios for all neurons measured are presented by open circles. (g) Caenorhabditis elegans were subjected to aldicarb (1 mM) after cultivation with or without PhoDAG-3 (1 mM). Nematodes (n = 3 experiments with 20 animals each) that were exposed to PhoDAG-3 (yellow) and UV-A irradiation became paralyzed more rapidly when compared to animals without UV-A exposure (black). The paralysis rate was not affected by UV-A irradiation alone (blue, gray). (h) Nematodes were exposed to levamisole (0.1 mM), after cultivation with or without PhoDAG-3 (1 mM). Those that were exposed to PhoDAG-3 (yellow) did not show any change in sensitivity to the drug with or without irradiation when compared to animals cultivated with EtOH only (vehicle) (n = 3 experiments with 20 animals, each). A Mann-Whitney test was used to determine statistical significance. Error bars were calculated as s.e.m.
None
None
None
None
None
None
None
None
None
None
None

Similar articles

Cited by

References

    1. Almena M, Mérida I. Shaping up the membrane: diacylglycerol coordinates spatial orientation of signaling. Trends Biochem Sci. 2011;36:593–603. - PubMed
    1. Brose N, Rosenmund C. Move over protein kinase C, you’ve got company: alternative cellular effectors of diacylglycerol and phorbol esters. J Cell Sci. 2002;115:4399–4411. - PubMed
    1. Newton AC. Protein Kinase C : Structure, Function, and Regulation. J Biol Chem. 1995;270:28495–28498. - PubMed
    1. Pessin MS, Raben DM. Molecular species analysis of 1,2-diglycerides stimulated by alpha-thrombin in cultured fibroblasts. J Biol Chem. 1989;264:8729–8738. - PubMed
    1. Marignani PA, Epand RM, Sebaldt RJ. Acyl Chain Dependence of Diacylglycerol Activation of Protein Kinase C Activity in Vitro. Biochem Biophys Res Commun. 1996;473:469–473. - PubMed

Publication types

MeSH terms