. 2016 Sep;19(9):1210-1217.
doi: 10.1038/nn.4351. Epub 2016 Jul 25.

Rapid production of new oligodendrocytes is required in the earliest stages of motor-skill learning

Affiliations

Rapid production of new oligodendrocytes is required in the earliest stages of motor-skill learning

Lin Xiao et al. Nat Neurosci. 2016 Sep.

Abstract

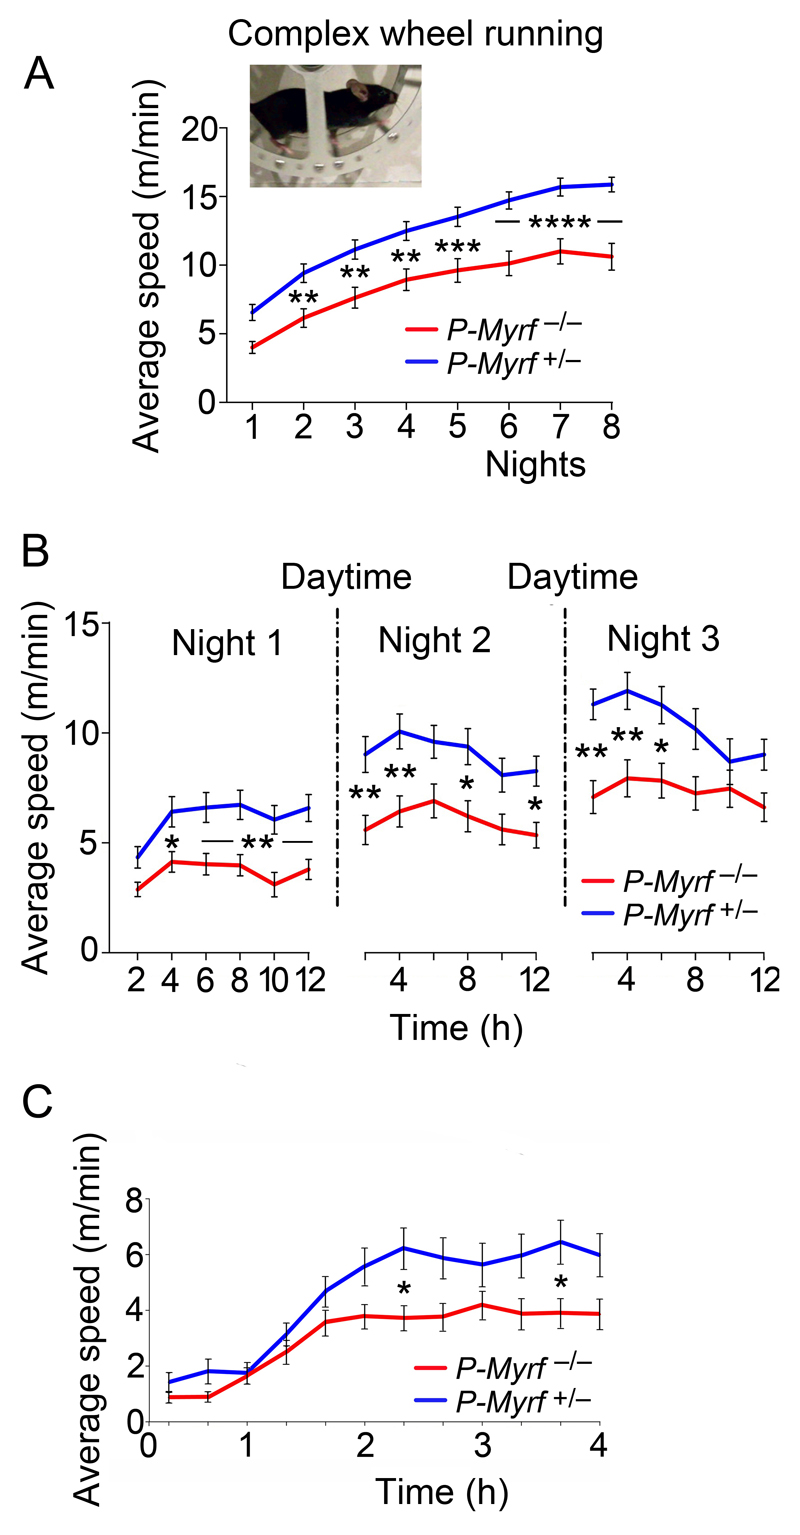
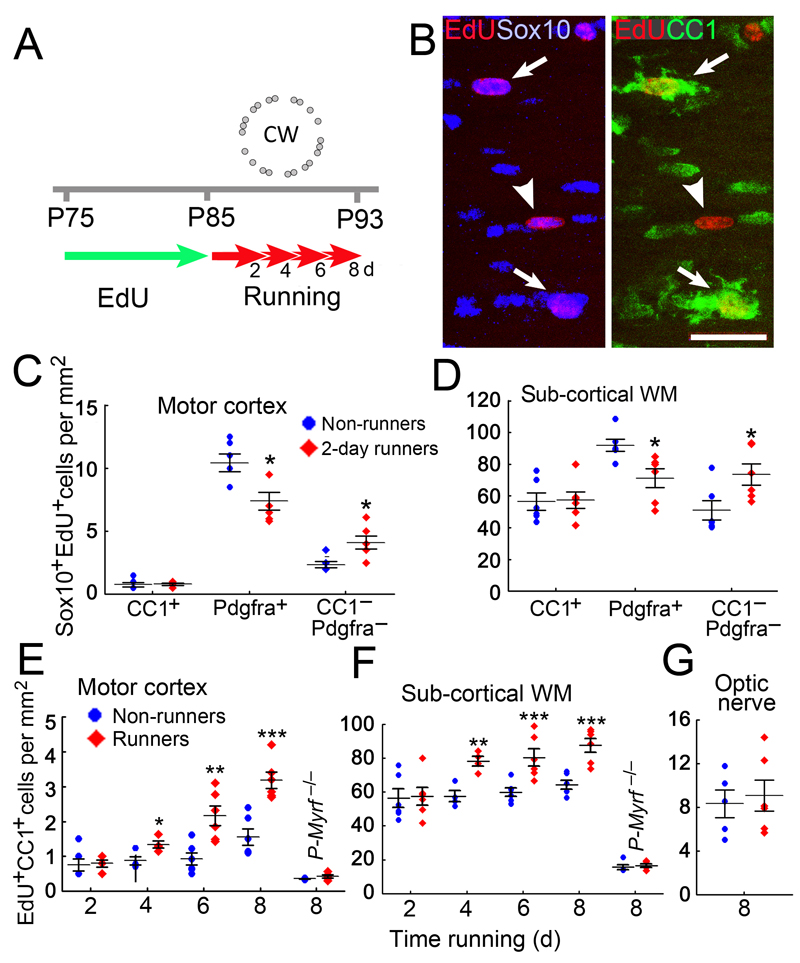
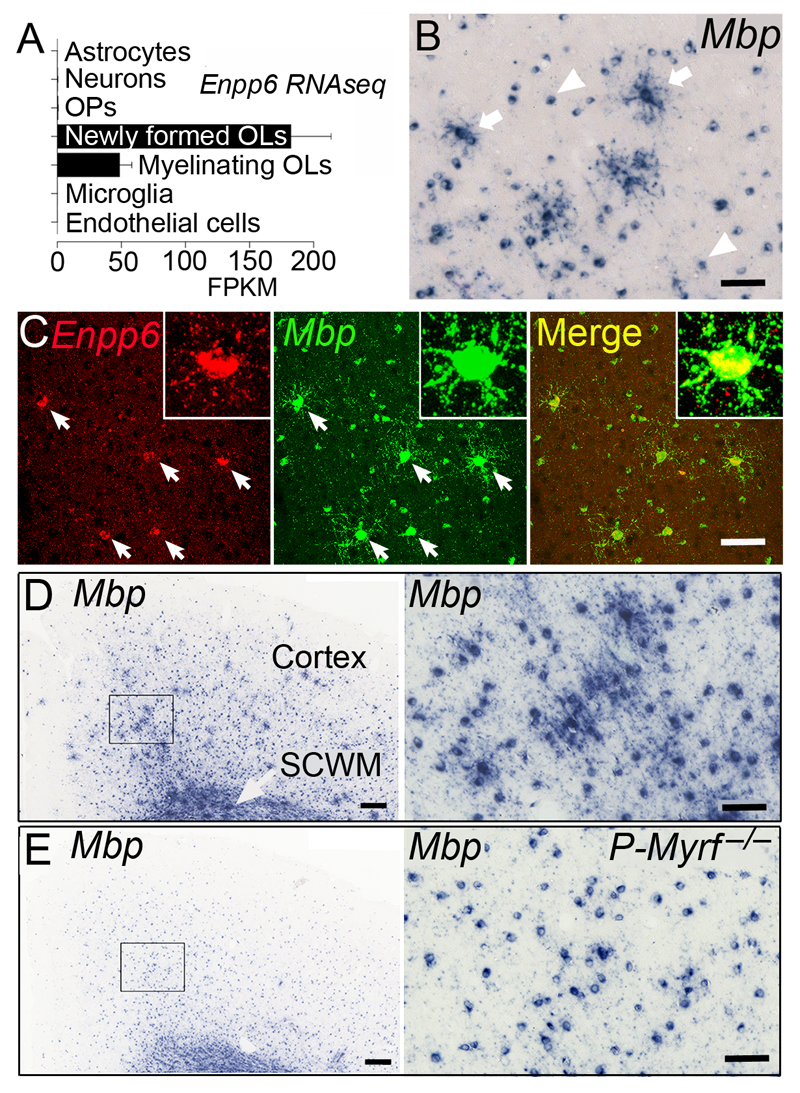
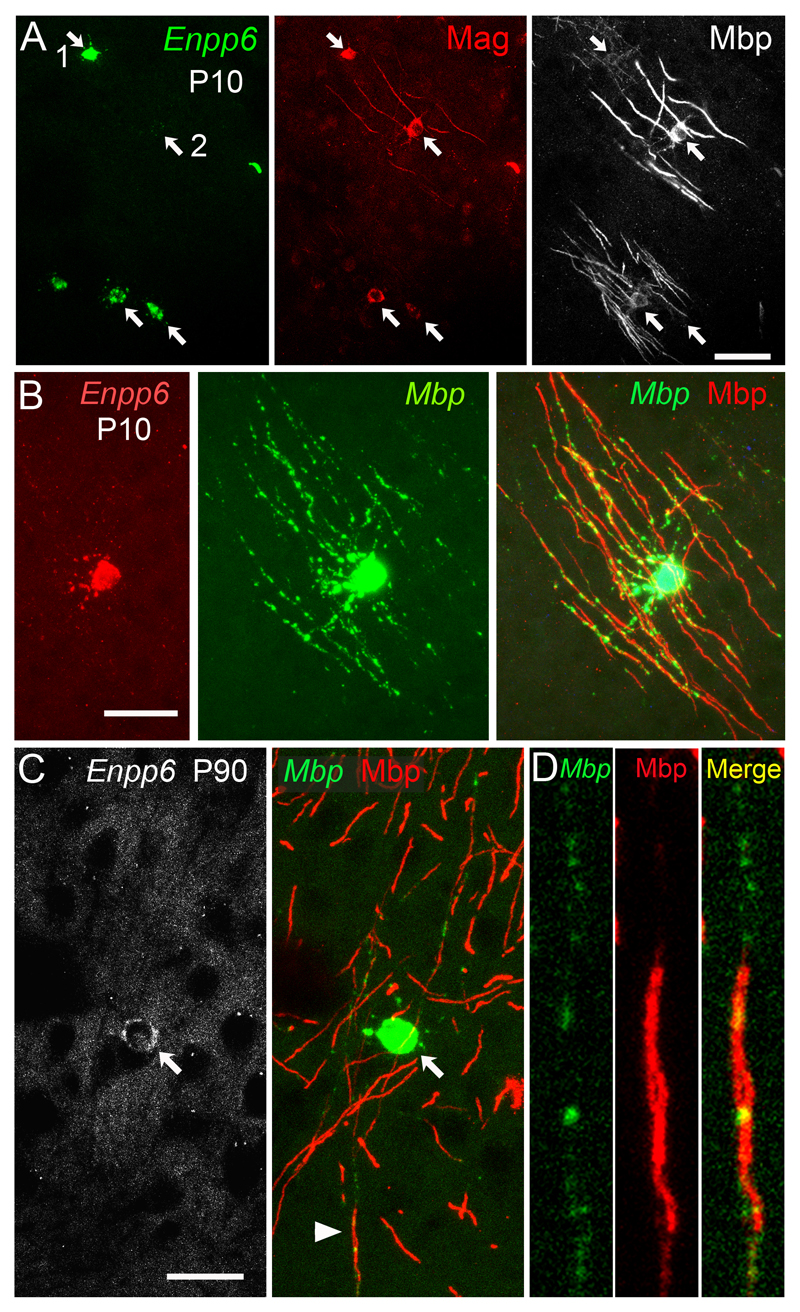
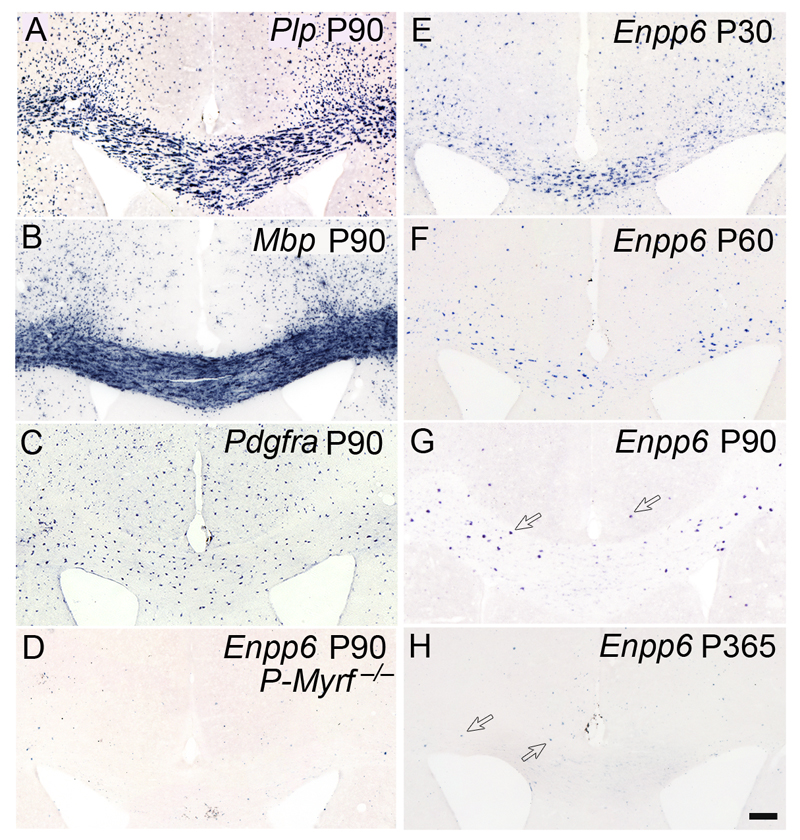
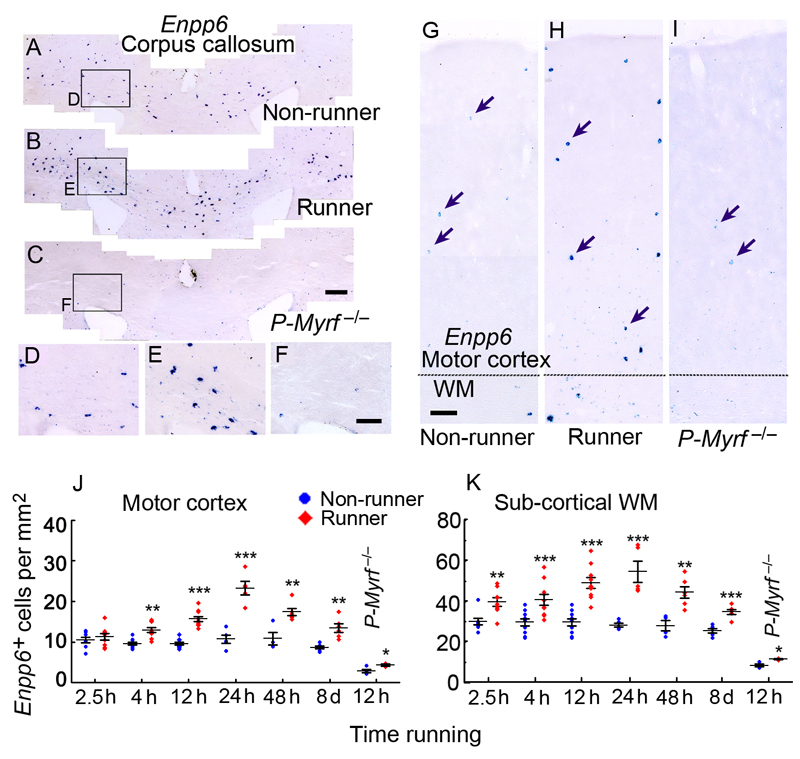
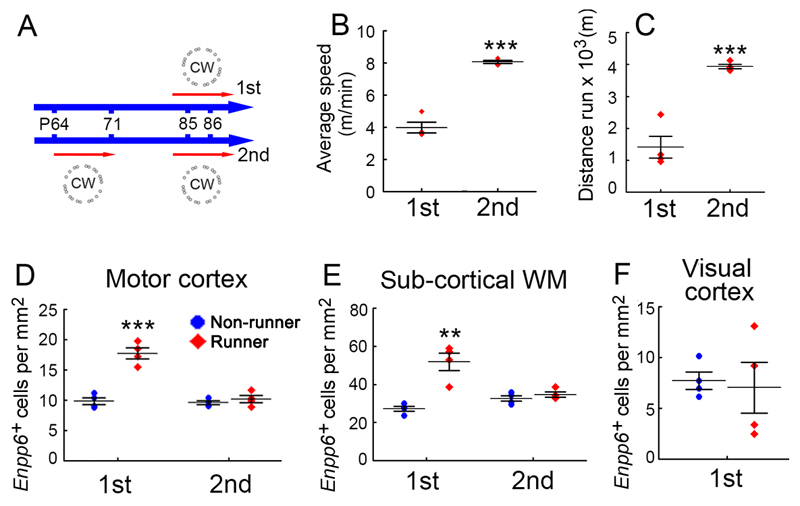
We identified mRNA encoding the ecto-enzyme Enpp6 as a marker of newly forming oligodendrocytes, and used Enpp6 in situ hybridization to track oligodendrocyte differentiation in adult mice as they learned a motor skill (running on a wheel with unevenly spaced rungs). Within just 2.5 h of exposure to the complex wheel, production of Enpp6-expressing immature oligodendrocytes was accelerated in subcortical white matter; within 4 h, it was accelerated in motor cortex. Conditional deletion of myelin regulatory factor (Myrf) in oligodendrocyte precursors blocked formation of new Enpp6(+) oligodendrocytes and impaired learning within the same ∼2-3 h time frame. This very early requirement for oligodendrocytes suggests a direct and active role in learning, closely linked to synaptic strengthening. Running performance of normal mice continued to improve over the following week accompanied by secondary waves of oligodendrocyte precursor proliferation and differentiation. We concluded that new oligodendrocytes contribute to both early and late stages of motor skill learning.


Conflict of interest statement

The authors declare no competing financial interests.

Figures

Fig. 1
Fig. 1
Time course of motor skill learning in mice and the requirement for Myrf. (a) Average speeds on complex wheel (pictured) during successive 24 hour intervals. P-Myrf –/– mice (n=32, 17 male) performed less well then their P-Myrf +/– littermates (n=36, 20 male) over all 8 days of the experiment, including the first 24 hour interval. (b) Average speeds during successive 2 hour intervals during the first 3 days of the experiment. Most improvement during night 1 occurred during the first 4 hours, both for P-Myrf +/– and P-Myrf –/– animals. At the beginning of nights 2 and 3, the mice ran faster from the outset than at any time during the preceding 24 hours. (c) Average speeds in 20 minute intervals during the first 4 hours of the first night. The performance of P-Myrf +/– and P-Myrf –/– mice increased from the same low level during the first 1-2 hours, diverging significantly within 2-4 hours' exposure to the complex wheel. Data were analyzed by two-way ANOVA with Bonferroni's post-hoc test. In (b), each night was treated separately for multiple comparisons. Error bars indicate s.e.m. *p < 0.05, **p < 0.01, ***p < 10–3, ****p < 10–4. [(a) Night 1: p=0.09, t=2.5. Night 2: p=0.01, t=3.3. Night 3: p=0.004, t=3.5. Night 4: p=0.004, t=3.5. Night 5: p=0.0009, t=3.9. Night 6: p<0.0001, t=4.6. Night 7: p<10–4, t=4.7. Night 8: p=0.001, t=3.8. F(1,497)=109.9 and degrees of freedom (df)=497 throughout.] [(b) Night 1: 2 h, p=0.43, t=1.81; 4 h, p=0.03, t=2.8; 6 h, p=0.009, t=3.2; 8 h, p=0.004, t=3.4; 10 h, p=0.002, t=3.7; 12 h, p=0.004, t=3.5. F(1,396)=56.2. Night 2: 2 h, p=0.007, t=3.3; 4 h, p=0.003, t=3.5; 6 h, p=0.063, t=2.6; 8 h, p=0.015, t=3.0; 10 h, p=0.11, t=2.4; 12 h, p=0.03, t=2.8. F(1,396)=51.1. Night 3: 2 h, p=0.002, t=3.63; 4 h, p=0.004, t= 3.43; 6 h, p=0.02, t= 2.95; 8 h, p=0.072, t=2.53; 10 h, p=0.>0.99, t=1.054; 12 h, p=0.24, t=2.06. F(1,396)=40.79. df=396 throughout.] [(c) 20 min: p>0.99, t=0.69; 40 min: p>0.99, t=0.10; 60 min: p>0.99, t=0.13; 80 min: p>0.99, t=0.81; 100 min: p>0.99, t=1.41; 120 min: p=0.30, t=2.44; 140 min: p=0.022, t=3.12; 160 min: p=0.10, t=1.83; 180 min: p=0.83, t=2.63; 200 min: p=0.14, t=2.63; 220 min: p=0.017, t=3.21; 240 min: p=0.095. F(1,792)=42.32 and df=792 throughout.]
Fig. 2
Fig. 2
Oligodendrocyte dynamics during motor skill learning. (a) Experimental design: all mice (approximately equal numbers of male and female) were given tamoxifen by gavage on 4 successive days (P60 to P63 inclusive), then EdU was administered in the drinking water for 10 days (P75 to P84) before transferring the mice to cages equipped with a complex wheel for up to 8 days. (b) Subcortical white matter of wild type mice housed with a wheel for 8 days (“8-day runners”). The great majority (~97%) of EdU+ cells were also Sox10+ oligodendrocyte lineage cells. At this time point there is a mixture of CC1-negative presumptive OPs (arrowhead) and CC1+ newly-formed oligodendrocytes (arrows). Images are representative of >3 similar experiments. (c,d) Numbers of newly-generated (EdU+) oligodendrocyte lineage cells at different developmental stages in 2-day runners versus control littermates, housed without a wheel (“non-runners”). The number of EdU+ CC1+ newly-formed oligodendrocytes is the same in 2-day runners and non-runners, both in motor cortex (c) and underlying white matter (WM) (d). The number of recently generated OPs (EdU+ Pdgfra+) is decreased in 2-day runners compared to non-runners, with a reciprocal increase in the number of newly-differentiating oligodendrocytes (EdU+ Pdgfra CC1). (e,f) Production of (EdU+ CC1+) new myelinating oligodendrocytes is accelerated in both motor cortex (e) and subcortical white matter (f) of runners versus non-runners. The new oligodendrocytes accumulate between 4 and 8 days running. The number of new oligodendrocytes is strongly reduced in P-Myrf –/– mice, both runners and non-runners, compared to wild type mice (non-runner 8 days, Motor cortex: p=0.00091, t= –4.71, df=9; Sub-cortical white matter: p<10–5, t= –15.43, df=9; n=6 for wild type mice, n=5 for Myrf –/– mice). (g) Production of new myelinating oligodendrocytes (EdU+ CC1+) in the optic nerve is not increased by running (p=0.71, t= –0.39, df=9, n=5 runners, n=6 non-runners). All data from runners versus non-runners were compared by two-tailed unpaired t-test. Error bars indicate s.e.m. *p < 0.05, **p < 0.01, ***p < 0.001. Scale bar in B: 40 μm. [(c) CC1+, p=0.81, t= –0.25; Pdgfra+, p= 0.012, t=3.1; Pdgfra, CC1, p=0.012, t= –3.1, df=10, n=6 mice] [(d) CC1+, p= 0.90, t= –0.13; Pdgfra+, p=0.014, t=2.94. df=10. n=6 mice.] [(e) 2 day, p=0.90, t= –0.13, df=10, n=6 mice each group; 4 days, p=0.027, t= –2.90, df=6, n=4 mice each group; 6 days, p=0.0039,t= –3.73, df=10, n=6 mice each group; 8 days (WT), p=0.0006, t= –5.0, df=10, n=6 mice each group; 8 days (Myrf –/–), p=0.18, t= –1.47, df=8, n=6 mice each group.] [(f) 2 days, p=0.61, t= –0.53, df=10; n=6 mice each group; 4 days, p=0.003, t= –4.8, df=6, n=4 mice each group; 6 days, p=0.0027, t= –3.54, df=10, n=6 mice each group; 8 days (WT), p=0.0007, t= –4.82, df=10, n=6 mice each group; 8 days (Myrf –/–), p=0.61, t= –0.53, df=8, n=5 mice each group.]
Fig. 3
Fig. 3
Enpp6 marks newly-forming, pre-myelinating oligodendrocytes. (a) RNA-seq data adapted from reference 27, http://web.stanford.edu/group/barres_lab/brain_rnaseq.html Enpp6 is expressed highly in newly-formed oligodendrocytes (OLs) and less so in myelinating oligodendrocytes. FPKM: fragments per kilobase of transcript per million mapped reads, but not in OPs or other neural cells. (b) ISH for Mbp transcripts on sections of P90 mouse motor cortex reveals many small cell bodies of mature oligodendrocytes (arrowheads) and a few larger process-bearing “spidery” cells (arrows), resembling “pre-myelinating” oligodendrocytes described previously,. (c) Double ISH for Mbp and Enpp6 shows that the spidery Mbp+ cells (arrows) are also Enpp6+. Under our ISH conditions (Supplementary Fig. 2) all Enpp6 high cells are spidery Mbp+ cells and vice versa; they represent ~5% of all Mbp+ cells in both grey and white matter at P90. (d) The spidery Mbp+ cells can be recognized in both cortical grey matter and white matter at P90, although the high density of Mbp+ mature oligodendrocytes tends to obscure them in white matter. The right panels of (D) and (E) are higher-magnification images of the areas indicated on the left. (e) In P-Myrf –/– brain at P90 there are almost no Mbp+ spidery cells in grey or white matter, identifying them as newly-forming oligodendrocytes. SCWM, sub-cortical white matter. Images are representative of >3 similar experiments. Error bars in (a) are s.e.m. Scale bars: (b,c) and (d right, e right) 50 μm, (d left, e left) 200 μm.
Fig. 4
Fig. 4
Enpp6 high, Mbp+ newly-formed oligodendrocytes express myelin structural proteins and synthesize myelin. (a) ISH for Enpp6 (left) followed by double immunolabeling for Mag (middle) and Mbp (right) demonstrates that a significant fraction (~45%) of Enpp6 high cells synthesize myelin sheaths in the P10 cortical grey matter. (b) Double ISH for Enpp6 (left) and Mbp (middle, green) followed by immunolabeling for Mbp (right, red) confirms that some Enpp6 high, Mbp+ newly-formed oligodendrocytes synthesize Mbp protein and myelin in the P10 cortex. Mbp mRNA is present in the cell body, radial processes and nascent myelin sheaths. (c,d) At P90, double ISH for Enpp6 and Mbp (green) followed by immunolabeling for Mbp (red) also identifies Enpp6+ cells in the motor cortex that are synthesizing myelin sheaths (arrow in c). The cell shown is in cortical layer 2; around 60% of Enpp6 high cells in this region of the cortex, where myelin sheaths are relatively sparse, were associated with myelin. (d) Higher magnification images of the myelin sheath indicated by an arrowhead in (c, middle). “Spots” of Mbp mRNA (green) are visible in (d) where there is no Mbp+ myelin sheath (red); presumably these represent oligodendrocyte processes that are in contact with axons but have not yet translated myelin proteins (i.e. nascent myelin sheaths). Images are representative of >3 similar experiments. Scale bars: 50 μm.
Fig. 5
Fig. 5
Visualization of Enpp6 high cells in the developing mouse forebrain by ISH. Enpp6 high cells are much less numerous in P90 forebrain compared to Plp+ or Mbp+ mature oligodendrocytes (compare a,b,g). They are also less numerous and differently distributed to Pdgfra+ OPs (compare c,g). Enpp6 high cells are very infrequent in P-Myrf –/– brains compared to wild type (d,g), consistent with their being early-differentiating oligodendrocytes; Myrf –/– OPs fail to differentiate but die as nascent oligodendrocytes. (eh) As expected for newly-differentiating oligodendrocytes, Enpp6 high cells are more abundant in the white and gray matter at earlier ages when oligodendrocyte generation and myelination is more active. Significant numbers are still present in young adults at P90 (arrows in g). Even at one year of age (h) there are small numbers of Enpp6 high cells (arrows). Images are representative of >3 similar experiments. Scale bar, 100 μm.
Fig. 6
Fig. 6
Rapid increase in Enpp6 high newly-forming oligodendrocytes in response to motor skill learning. (ai) ISH for Enpp6 in sections of non-runner, runner (24 hours with the complex wheel) and P-Myrf –/– (non-runner) subcortical white matter (af) or motor cortex (gi). (df) are higher-magnification images of the areas indicated in (ac). There is a noticeable increase in the number of strongly-labeled cells in runners relative to non-runners, both in motor cortex (compare g,h) and subcortical white matter (compare a,b and d,e). (j,k) Quantification of Enpp6 high cells in wild type or P-Myrf –/– mice housed with or without a complex wheel for different times. Numbers of Enpp6 high cells were increased in runners versus non-runners within only 2.5 hours in the subcortical white matter and within 4 hours in motor cortex and persisted for at least 8 days, in both white and grey matter. Numbers of Enpp6 high cells were greatly decreased in P-Myrf –/– compared to wild type mice, [non-runner 12 h, (j) Motor cortex: p<10–5, t= –13.37, df=12; (k) Sub-cortical white matter: p<10–5, t= –11.28, df=12; n=10 for wild type mice, n=4 for Myrf –/– mice]. Data from runners and non-runners were compared by two-tailed unpaired t-test. Error bars indicate s.e.m. *p < 0.05, **p < 0.01, ***p < 0.001, comparing runners with non-runners. WM, white matter. Images are representative of >3 similar experiments. Scale bars: (ac), 200 μm; (di), 100 μm. [(j) 2.5 h, p=0.43, t= –0.81,df=15, n=8 mice for non runners, n=9 mice for runners; 4 h, p=9x10⁻⁵, t= –5.024, df=18, n=10 mice each group; 12 h (wild type), p<10–5, t= –8.50, df=18, n=10 mice each group; 24 h, p=0.00019, t= –6.46, df=8, n=5 mice each group; 48 h, p=0.0038, t=4.03, df=9, n=4 mice for non runners, n=6 for runners; 8 d, p=0.0013, t= –4.42, df=10, n=6 mice each group; 12 h (Myrf –/–), p=0.049,t= –2.59, df=5, n=4 mice for non runners, n=3 mice for runners.] [(k) 2.5 h, p=0.0026, t= –3.60, df=15, n=8 mice for non runners, n=9 mice for runners; 4 h, p= 0.0026, t= –3.50, df=18, n=10 mice each group; 12 h (wild type), p<10–5, t= –6.20, df=18, n=10 mice each group; 24 h, p=0.001, t= –5.06, df=8, n=5 mice each group; 48 h, p=0.0038, t=4.03, df=8, n=4 mice for non runners, n=6 for runners; 8 d, p=2x10⁻⁵, t= –5.71, df=10, n=6 mice each group; 12 h (Myrf –/–), p=0.013, t= –3.77, df=5, n=4 mice for non runners, n=3 mice for runners.]
Fig 7
Fig 7
Increased production of Enpp6+ new-formed oligodendrocytes is a response to motor learning, not physical exercise. (a) Experimental design. One group of mice self-trained on the complex wheel for one week, rested for 2 weeks then was re-introduced to the wheel along with a separate group that was introduced for the first time. After 24 hours (P85-86) both groups of mice (and parallel groups of non-runners) were analyzed by ISH for Enpp6. Despite the fact that pre-trained mice ran faster and further than the “first-timers” (b,c), there was an increase in the number density of Enpp6 high newly-formed oligodendrocytes in the first timers but not in the pre-trained group, both in motor cortex (d) and subcortical white matter (e). Elevated oligodendrocyte production was not observed in the visual cortex (f), demonstrating regional specificity. All data were compared by two-tailed unpaired t-test. n=4 mice in each group. Error bars indicate s.e.m. *p < 0.05, **p < 0.01, ***p < 0.001. [(b) p=10–5, t= –11.72, df=6.] [(c) p=0.00035, t= –7.23, df=6.] [(d) 1st, p=0.00033, t= –7.29, df=6; 2nd, p=0.38, t= –0.95, df=6.] [(e) 1st, p=0.0021, t= –5.16, df=6; 2nd, p=0.34, t= –1.03, df=6.] [(f) p=0.80, t=0.27 df=6.]

References

    1. Sturrock RR. Myelination of the mouse corpus callosum. Neuropathol Appl Neurobiol. 1980;6:415–420. - PubMed
    1. Yeung MS, et al. Dynamics of oligodendrocyte generation and myelination in the human brain. Cell. 2014;159:766–774. - PubMed
    1. Dimou L, Simon C, Kirchhoff F, Takebayashi H, Gotz M. Progeny of Olig2-expressing progenitors in the gray and white matter of the adult mouse cerebral cortex. J Neurosci. 2008;28:10434–10442. - PMC - PubMed
    1. Rivers LE, et al. PDGFRA/NG2 glia generate myelinating oligodendrocytes and piriform projection neurons in adult mice. Nat Neurosci. 2008;11:1392–1401. - PMC - PubMed
    1. Lasiene J, Matsui A, Sawa Y, Wong F, Horner PJ. Age-related myelin dynamics revealed by increased oligodendrogenesis and short internodes. Aging Cell. 2009;8:201–213. - PMC - PubMed

Publication types

Substances