. 2016 Sep;19(9):1201-9.
doi: 10.1038/nn.4350. Epub 2016 Jul 25.

The coding of cutaneous temperature in the spinal cord

Affiliations

The coding of cutaneous temperature in the spinal cord

Chen Ran et al. Nat Neurosci. 2016 Sep.

Abstract

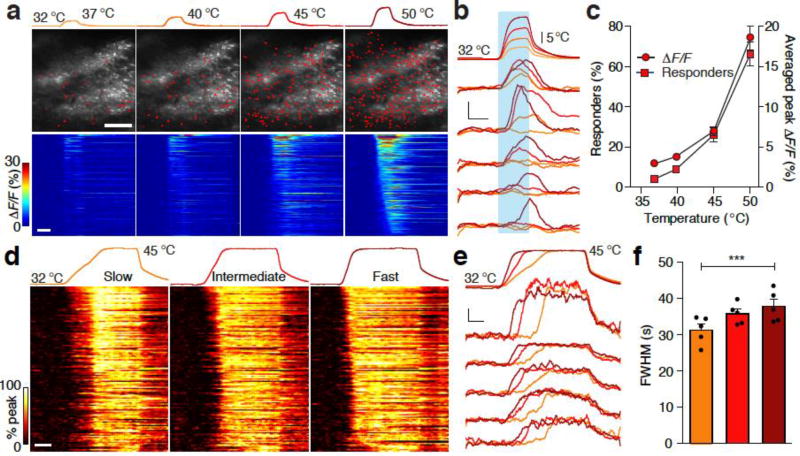
The spinal cord is the initial stage that integrates temperature information from peripheral inputs. Here we used molecular genetics and in vivo calcium imaging to investigate the coding of cutaneous temperature in the spinal cord in mice. We found that heating or cooling the skin evoked robust calcium responses in spinal neurons, and their activation threshold temperatures distributed smoothly over the entire range of stimulation temperatures. Once activated, heat-responding neurons encoded the absolute skin temperature without adaptation and received major inputs from transient receptor potential (TRP) channel V1 (TRPV1)-positive dorsal root ganglion (DRG) neurons. By contrast, cold-responding neurons rapidly adapted to ambient temperature and selectively encoded temperature changes. These neurons received TRP channel M8 (TRPM8)-positive DRG inputs as well as novel TRPV1(+) DRG inputs that were selectively activated by intense cooling. Our results provide a comprehensive examination of the temperature representation in the spinal cord and reveal fundamental differences in the coding of heat and cold.


Conflict of interest statement

Competing Financial Interests

The authors declare no competing financial interests.

Figures

Figure 1
Figure 1. In vivo two-photon calcium imaging in the spinal cord
(a) Schematic illustrating the imaging preparation. The colored dots show the four different locations where stimulation temperature was recorded. (b) Recorded stimulation temperature at the four locations in a during the thermal stimulation. (c) Overlay of temperature curves in b. (d) An example field of view (438 µm × 438 µm) of 413 OGB labeled neurons. Neurons that showed positive responses to the cooling stimulus (see Methods) are marked in green. Similar observations were made in more than 55 experiments. Scale bar, 50 µm. (e) Representative ΔF/F traces from neurons responded to the cooling stimulus. Colored traces are averaged ΔF/F from two individual trials (grey traces). Scale bars are 10 s and 10% ΔF/F, respectively. (f) ΔF/F heat maps for the 193 cold-responding neurons in the FOV in d during a cooling stimulus to 16 °C. Scale bar, 10 s. (g) Example images showing NeuN stained sections of the spinal superficial laminae (left) and layer 2/3 of the motor cortex (right). Scale bars, 50 µm. (h) Quantification of g (spinal cord, n = 5 FOVs from 3 mice; cortex, n = 6 FOVs from 3 mice, ** P = 0.0043, U = 0.0000, Mann Whitney test, Error bars represent s.e.m.). (i) Top: recorded stimulation temperature during ten cooling trials. Bottom: heat maps showing the activity of all 102 neurons that were activated in any one of the ten trials in one mouse, sorted by their maximum response amplitudes. Each row in the heat map represents the response from the same neuron in different trials. Scale bar, 10 s. (j) A rank-ordered plot of peak ΔF/F of all 102 neurons in i. Gray, maximum response amplitudes of individual trials; red, mean.
Figure 2
Figure 2. Representation of cold intensity in the spinal cord
(a) Neuronal responses evoked by cooling the skin from 32 °C to different target temperatures. Top: recorded temperature trace of each cooling stimulus. Middle: an example field of view (FOV) showing neurons activated by the corresponding cooling stimulus. Similar observations were made in 12 mice. Neurons that showed positive responses to cold are marked in green. Bottom: ΔF/F heat maps for all 138 cold-responding neurons in the same FOV during cooling to different temperatures. Neurons are rank-ordered by their response onset times during the cooling stimulus to 5 °C. Each row in the heat maps represents responses from the same neuron to different cooling stimuli. Scale bar, 10 s. (b) Top: stimulation temperature traces. Bottom: calcium traces of 5 representative neurons with different activation temperature thresholds. Cooling period is marked with cyan. Scale bars, 10 s and 10% ΔF/F. (c) Left Y axis, quantification of the percentage of total OGB labeled neurons that responded to the given cooling stimuli in an FOV (squares). Right Y axis, the averaged peak ΔF/F (circles) at a given temperature indicated on the Y axis from all cold responders to any cooling stimuli (n = 12 mice). Error bars represent s.e.m. (d) An overlay of the temperature trace of a cooling stimuli (white, from 32 °C to 16 °C) with neuronal responses during this stimulus (heat map). Scale bar, 10 s.
Figure 3
Figure 3. Rapid adaptive responses to cooling
(a) Heat maps of normalized ΔF/F traces illustrating the response kinetics to cooling. Top: recorded temperature trace of each cooling stimulus with different temperature change rates. Green: slow, 0.31 °C·s−1, teal: intermediate, 0.56 °C·s−1, blue: fast, 0.99 °C·s−1. Bottom: heat maps of the response kinetics of all 113 cold-responding neurons in one FOV. The peak ΔF/F of each responding neuron is normalized to 100%. Neurons are rank-ordered by their response onset times to the slowest cooling stimulus. Each row in the heat maps represents the response of the same neuron to different cooling rates. Scale bar, 10 s. (b) Top: stimulation temperature traces. Bottom: calcium traces of 5 representative neurons to cooling from 32 °C to 22 °C at different cooling rates. Scale bars, 10 s and 10% ΔF/F. (c) Quantification of the number of cold-responding neurons (squares) and the averaged peak ΔF/F (circles) in response to three different cooling stimuli. (d) Quantification of the full width at half maximum (FWHM, illustrated in the insert) of ΔF/F traces evoked by cooling at different rates (n = 6 mice). ** P = 0.0017, Friedman statistic = 10.33, Friedman Test. Error bars represent s.e.m.
Figure 4
Figure 4. Neurons encode the change of temperature for cold
(a) Neuronal responses to cooling to 19 °C from different adaptation temperatures (ATs). Top: recorded temperature traces of cooling by different ΔTs (3 °C, 8 °C, 13 °C and 18 °C). Bottom: ΔF/F heat maps demonstrating fluorescence changes of all 163 cold-responding neurons in the same FOV to the corresponding cooling stimulus. Neurons are rank-ordered by their response onset times to the cooling by ΔT = 18 °C. Each row in the heat map represents the responses from the same neuron to a different cooling stimulus. Scale bar, 10 s. (b) Quantification of the number of cold-responding neurons (squares, left Y axis) and the peak ΔF/F (circles, right Y axis) averaged across all cold-responders to any of the four cooling stimuli (ΔT = 18 °C, n = 3 mice; other data points, n = 4 mice). (c) Neuronal responses to cooling by 8 °C from different ATs. Top: recorded temperature traces of cooling stimuli with different ATs (42 °C, 37 °C, 32 °C, 27 °C and 22 °C). Bottom: ΔF/F heat maps demonstrating fluorescence changes of all 141 cold-responding neurons the corresponding cooling stimulus. Neurons are rank-ordered by their response onset times to cooling from 22 °C to 14 °C. Scale bar, 10 s. (d) Quantification of c (AT = 22–37 °C, n = 12 mice; AT = 42 °C, n = 4 mice). Error bars represent s.e.m.
Figure 5
Figure 5. The representation of heating in the spinal cord
(a) Neuronal responses to heating the skin from 32 °C to different target temperatures. Top: recorded temperature trace of each heating stimulus. Middle: an example FOV image showing neurons activated by the corresponding heating-stimulus. Heat-responding neurons are marked in red. Bottom: ΔF/F heat maps demonstrating fluorescence changes of all 276 heat-responding neurons in the same FOV to different temperatures. Neurons are rank-ordered by their response onset times to the 50 °C stimulus. Each row in the heat maps represents responses from the same neuron to different temperatures. Similar observations were made in ten mice. Scale bar, 100 µm. (b) Top: recorded stimulation temperature traces. Bottom: calcium traces of 5 representative neurons with different activation temperature thresholds. Heating period is marked with cyan. Scale bars, 10 s and 10% ΔF/F. (c) Left Y axis, quantification of the percentage of total OGB loaded neurons that respond to the given heating stimuli in an FOV (squares). Right Y axis, the averaged ΔF/F (circles) at a given temperature indicated on the Y axis from all heat responders to any heating stimuli (n = 10 mice). (d) Heat maps of normalized ΔF/F traces illustrating response kinetics to heating. Top: temperature traces of each heating stimuli with different temperature change rates. Orange: slow 0.31 °C·s−1, red: intermediate 0.56 °C·s−1, cardinal: fast 0.99 °C·s−1. Bottom: heat maps of the response kinetics of all 137 heat-responding neurons in one FOV. Peak ΔF/F of each responding neuron is normalized to 100%. Neurons are rank-ordered by their response onset times for the slowest heat stimulus. Each row in the heat map represents responses from the same neuron to different heating rates. Scale bar, 10 s. (e) Top: stimulation temperature traces. Bottom: calcium traces from 5 representative neurons to heating from 32 °C to 45 °C, at different heating rates. ΔF/F signals closely followed the temperature curve of the heat stimuli. Scale bars, 10 s and 10% ΔF/F. (f) Quantification of FWHM of ΔF/F traces evoked by heating at different rates (n = 5 mice). *** P = 0.0008, Friedman statistic = 10.00, Friedman Test. Error bars represent s.e.m.
Figure 6
Figure 6. Neurons encode absolute temperature for heat
(a) Neuronal responses to heating to 43 °C from different ATs. Top: recorded temperature traces of heating by different ΔTs (6 °C, 11 °C, 16 °C and 21 °C). Bottom: ΔF/F heat maps demonstrating fluorescence changes of all 69 heat-responding neurons in the same FOV to the corresponding heating stimulus. Neurons are rank-ordered by their response onset times to the cooling stimulus with ΔT = 21 °C. Each row in the heat maps represents the responses from the same neuron to a different heating stimulus. Scale bar, 10 s. (b) Quantification of the number of heat-responding neurons (squares, left Y axis) and the peak ΔF/F (circles, right Y axis) averaged across all heat-responders to any of the four cooling stimuli (n = 7 mice). (c) Neuronal responses to heating by 8 °C from different ATs. Top: recorded temperature traces of heating stimuli with different ATs (22 °C, 27 °C, 32 °C, 37 °C and 42 °C). Bottom: ΔF/F heat maps demonstrating fluorescence changes of all 296 heat-responding neurons in the same FOV to the corresponding stimulus. Neurons are rank-ordered by their response onset times to cooling from 42 °C to 50 °C. Scale bar, 10 s. (d) Quantification of c (AT = 42 °C, n = 3 mice; other data points, n = 4 mice). Error bars represent s.e.m.
Figure 7
Figure 7. Spinal responses to temperature are mediated by specific DRG inputs
(a) Heat maps of the activities of all heat-responding neurons in representative FOVs in wild type (WT, 396 neurons), TRPV1-DTR (188 neurons) and TRPM8-DTR (467 neurons) mice after diphtheria toxin treatment. Scale bar, 10 s. (b) A histogram showing the distribution of activation thresholds of heat-responding neurons in WT, TRPV1-DTR and TRPM8-DTR mice. (Black: WT, n = 10 mice, orange: TRPV1-DTR, n = 9 mice, blue: TRPM8-DTR, n = 4 mice. Dunn's multiple comparisons test following Kruskal-Wallis test. TRPV1-DTR vs. WT, P = 0.0049, P = 0.0446, P = 0.0149, P = 0.0004 for the four temperature ranges, respectively. TRPM8-DTR vs. WT, P = 0.6377, P = 0.4073, P > 0.9999, P > 0.9999.) (c) The percentage of reduction (calculate from b) of heat-responding neurons in DTR mice compare to WT. (d) Heat maps of the activities of all cold-responding neurons in representative FOVs in WT (299 neurons), TRPV1-DTR (146 neurons) and TRPM8-DTR (138 neurons) mice after diphtheria toxin treatment. Scale bar, 10 s. (e) A histogram showing the distribution of activation thresholds of cold-responding neurons in WT, TRPV1-DTR and TRPM8-DTR mice. (Black: WT, n = 12 mice, orange: TRPV1-DTR, n = 7 mice, blue: TRPM8-DTR, n = 8 mice. Dunn's multiple comparisons test following Kruskal-Wallis test. TRPV1-DTR vs. WT, P > 0.9999, P = 0.2075, P = 0.0296, P = 0.0281, P = 0.0033 for the five temperature ranges, respectively. TRPM8-DTR vs. WT, P = 0.0004, P = 0.0030, P = 0.3078, P = 0.6914, P = 0.2411.) (f) The percentage of reduction (calculate from e) of cold-responding neurons in DTR mice compare to WT. Dashed bars indicate the sum of reduction of cold-responding neurons of TRPV1-DTR and TRPM8-DTR mice. Error bars represent s.e.m.
Figure 8
Figure 8. Broadly tuned thermal responding neurons in the spinal cord
(a) An example FOV image showing neurons activated by cooling to 16 °C (green), heating to 45 °C (red) or both (yellow). Similar observations were made in 55 mice. Scale bar, 100 µm. (b) Top: stimulation temperature traces. Bottom: representative ΔF/F traces from neurons responded only to cooling (Neurons #1 and #2), only to heating (Neurons #3 and #4) and to both cooling and heating (Neurons #5 and #6). Colored traces are averaged ΔF/F from three individual trials (grey traces) per thermal stimulus. Scale bars, 10 s and 10% ΔF/F. (c) Heat maps showing the activities of all thermal-responding neurons (86 cold only, 89 heat only and 61 broadly tuned) in a. Each row in the heat maps represents responses from the same neuron to different stimuli. Neurons are sorted into 3 different groups based on their tuning properties (indicated by the color bar on the right). In each group, neurons are rank-ordered based on their response onset times. (d) A heat map showing the percentage of broadly tuned neurons in total number of thermosensitive neurons at different stimulation temperatures (n = 6 mice). (e) Averaged response latencies of singly- and broadly-tuned neurons in response to a cooling stimulus to 16 °C and a heating stimulus to 45 °C (n = 55 mice, Cold, P = 0.0008, W = 786.0; heat, P = 0.1053, W = −388.0, Wilcoxon matched-pairs signed rank test). (f) An example FOV image showing neurons that selectively respond to cooling to 29 °C (green), or respond to both heating to 45 °C and cooling to 29 °C (yellow) in wild type and DT treated TRPV1-DTR mice. Scale bar, 100 µm. (g) Quantification of g. WT, n = 11 mice, TRPV1-DTR, n = 8 mice. P = 0.0287, U = 17.00, Mann Whitney test.) * P < 0.05, ** P < 0.01. Error bars represent s.e.m.

Comment in

  • Heat is absolute, cold is relative.
    Vandewauw I, Voets T. Vandewauw I, et al. Nat Neurosci. 2016 Aug 26;19(9):1188-9. doi: 10.1038/nn.4367. Nat Neurosci. 2016. PMID: 27571197 No abstract available.
  • Representations of temperature in the spinal cord.
    Ran C. Ran C. Temperature (Austin). 2017 Mar 20;4(3):214-216. doi: 10.1080/23328940.2017.1308453. eCollection 2017. Temperature (Austin). 2017. PMID: 28944267 Free PMC article. No abstract available.

Similar articles

Cited by

References

    1. Julius D. TRP channels and pain. Annu Rev Cell Dev Biol. 2013;29:355–384. doi: 10.1146/annurev-cellbio-101011-155833. - DOI - PubMed
    1. Vriens J, Nilius B, Voets T. Peripheral thermosensation in mammals. Nat Rev Neurosci. 2014;15:573–589. doi: 10.1038/nrn3784. - DOI - PubMed
    1. Basbaum AI, Bautista DM, Scherrer G, Julius D. Cellular and molecular mechanisms of pain. Cell. 2009;139:267–284. doi: 10.1016/j.cell.2009.09.028. - DOI - PMC - PubMed
    1. Palkar R, Lippoldt EK, McKemy DD. The molecular and cellular basis of thermosensation in mammals. Curr Opin Neurobiol. 2015;34C:14–19. doi:S0959-4388(15)00019-7 [pii] 10.1016/j.conb.2015.01.010. - PMC - PubMed
    1. Caterina MJ, et al. Impaired nociception and pain sensation in mice lacking the capsaicin receptor. Science. 2000;288:306–313. doi:8443 [pii] - PubMed

Publication types