. 2016 Sep;48(9):1049-1054.
doi: 10.1038/ng.3620. Epub 2016 Jul 25.

A thrifty variant in CREBRF strongly influences body mass index in Samoans

Affiliations

A thrifty variant in CREBRF strongly influences body mass index in Samoans

Ryan L Minster et al. Nat Genet. 2016 Sep.

Abstract

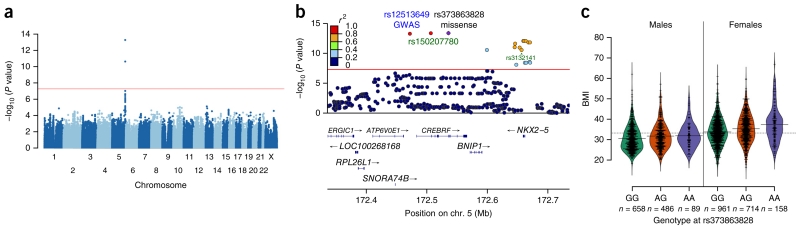
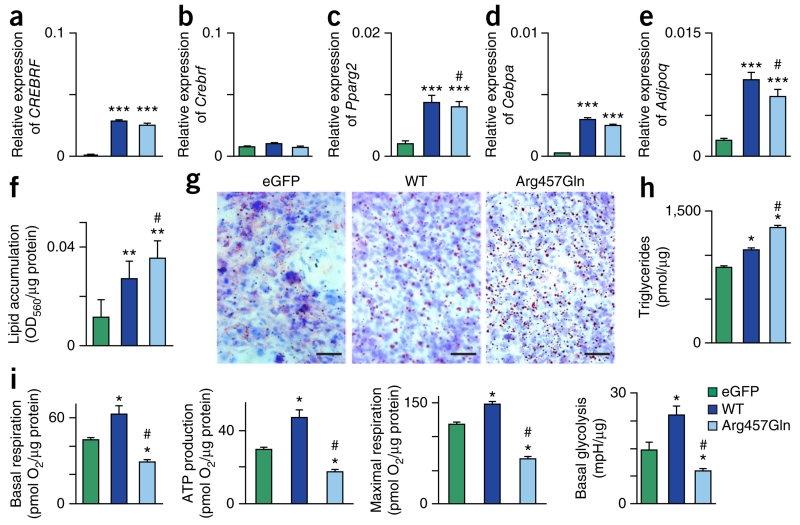
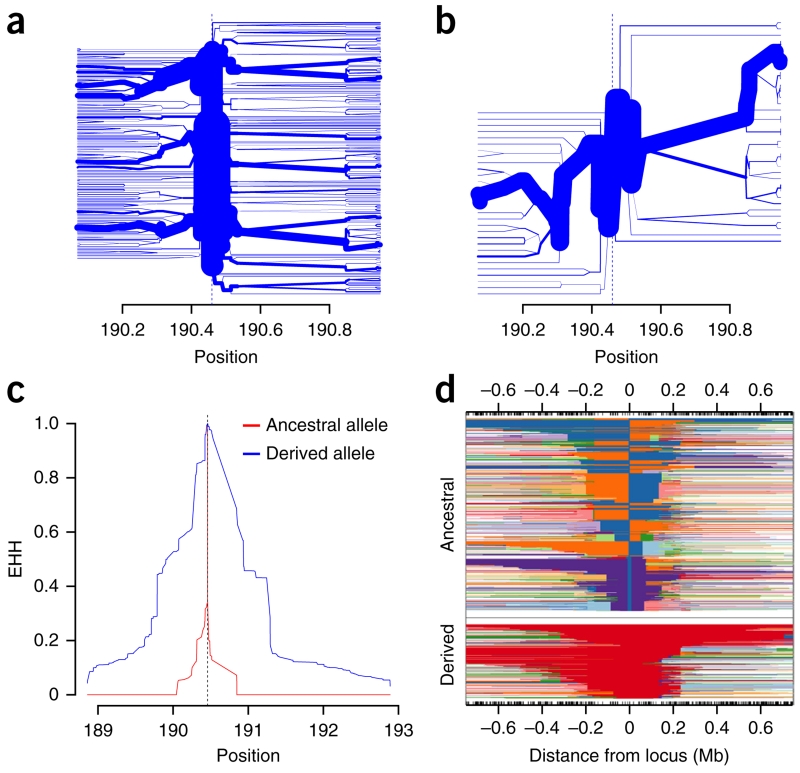
Samoans are a unique founder population with a high prevalence of obesity, making them well suited for identifying new genetic contributors to obesity. We conducted a genome-wide association study (GWAS) in 3,072 Samoans, discovered a variant, rs12513649, strongly associated with body mass index (BMI) (P = 5.3 × 10(-14)), and replicated the association in 2,102 additional Samoans (P = 1.2 × 10(-9)). Targeted sequencing identified a strongly associated missense variant, rs373863828 (p.Arg457Gln), in CREBRF (meta P = 1.4 × 10(-20)). Although this variant is extremely rare in other populations, it is common in Samoans (frequency of 0.259), with an effect size much larger than that of any other known common BMI risk variant (1.36-1.45 kg/m(2) per copy of the risk-associated allele). In comparison to wild-type CREBRF, the Arg457Gln variant when overexpressed selectively decreased energy use and increased fat storage in an adipocyte cell model. These data, in combination with evidence of positive selection of the allele encoding p.Arg457Gln, support a 'thrifty' variant hypothesis as a factor in human obesity.


Figures

Figure 1
Figure 1
Association results from genome-wide and targeted sequencing and beanplots of BMI versus genotype in men and women from the discovery sample. (a) Manhattan plot of the genome-wide association scan for association with BMI. The red line corresponds to a P value of 5 × 10⁻⁸. (b) Association results using imputed data for the region encompassing CREBRF. The strength of LD, as measured by the squared correlation of genotype dosages, between each variant and the missense variant rs373863828 is represented by the color of each point. The red line corresponds to a P value of 5 × 10⁻⁸. The plot was generated using LocusZoom. (c) Beanplots of BMI versus genotype in men (n = 1,233) and women (n = 1,833) from the discovery sample. Each bean consists of a mirrored density curve containing a one-dimensional scatterplot of the individual data. A solid line shows the average for each group, and the dashed line represents the overall average. The plot was generated using the R beanplot package.
Figure 2
Figure 2
CREBRF variants, adipogenic differentiation, lipid accumulation, and energy homeostasis. 3T3-L1 mouse preadipocytes overexpressing enhanced GFP–only negative control (eGFP), wild-type human CREBRF (WT), or Arg457Gln human CREBRF were collected at 8 d after confluence in the absence of hormonal stimulation of adipogenic differentiation. (ae) mRNA levels of human CREBRF (a) and endogenous mouse Crebrf (b), Pparg2 (c), Cebpa (d), and Adipoq (e) relative to those of the β-actin (Actb) reference gene determined using quantitative RT–PCR. Values are given as means ± s.e.m. from three biological replicates with four technical replicates each (n = 3 × 4 = 12). Representative results from one of four experiments are shown. (f) Quantification of lipid accumulation with Oil Red O staining normalized to protein content (OD560/μg protein). Data are shown as means ± s.e.m. from three transfection replicates with eight wells for each transfection (n = 3 × 8 = 24). (g) Representative photomicrographs of Oil Red O staining to visualize lipid droplets (red) with counterstaining of nuclei with hematoxylin (blue). Scale bars, 50 μm. (h) Biochemical assay for triglycerides. Data are shown as means ± s.e.m., n = 2 biological replicates. (i) Key bioenergenic variables as determined on the basis of oxygen consumption rate (OCR) and extracellular acidification rate (ECAR) normalized to protein content. Values are given as means ± s.e.m. (n = 6 biological replicates). mpH, 0.01 pH unit. Statistical analysis: one-way analysis of variance (ANOVA), two-sided Games–Howell post-hoc test. *P < 0.03, **P < 1 × 10⁻³, ***P < 1 × 10⁻⁴ compared to 3T3-L1 cells transfected with eGFP control construct; #P < 0.05 compared to 3T3-L1 cells transfected with construct for wild-type CREBRF.
Figure 3
Figure 3
Induction of Crebrf expression by nutritional stress and protection against starvation. (a,b) 3T3-L1 preadipocytes were starved (a) or treated with 20 ng/ml rapamycin (b) for 0, 2, 4, 12, or 24 h. A set of cells was starved or treated with rapamycin for 12 h and then refed with fresh growth medium for an additional 12 h (24 h (refed)). Crebrf mRNA levels were determined relative to Actb levels and normalized to baseline levels (0 h). Values are given as means ± s.e.m. from three biological replicates with four technical replicates each (n = 3 × 4 = 12). Statistical analysis: one-way ANOVA and two-sided Bonferroni post-hoc tests. **P = 0.002, ***P < 1 × 10⁻¹¹ compared to cells at 0 h; #P = 0.02, ###P = 8.8 × 10⁻¹³ compared to cells at 24 h (refed). (c,d) 3T3-L1 preadipocytes were either untransfected (UT) or transfected with plasmid encoding eGFP-only negative control, wild-type human CREBRF, or Arg457Gln CREBRF and starved. (c) Time course of 3T3-L1 cell survival upon starvation up to 24 h. (d) Cell death rates after 0–6 h of starvation. Values are given as means ± s.e.m. from two transfection replicates with six wells for each transfection and three technical (cell counting) replicates (n = 2 × 6 × 3 = 36). This experiment was performed once following a pilot experiment with fewer time points showing similar results. Statistical analysis: one-way ANOVA and two-sided Games–Howell post-hoc tests. ***P < 5 × 10⁻⁵ compared to cells transfected with control eGFP construct.
Figure 4
Figure 4
Evidence of positive selection centered on the missense variant rs373863828. Findings are shown for 626 Samoans who are not closely related. (a,b) Haplotype bifurcation plots for haplotypes carrying the ancestral allele (a) and the derived allele (b) at rs373863828 show that haplotypes carrying the derived allele have unusual long-range homozygosity. (c,d) Haplotypes carrying the derived allele have elevated EHH values as one moves away from rs373863828 (vertical dashed line) (c) and are longer than those carrying the ancestral allele (d).

Comment in

References

    1. Åberg K, et al. Susceptibility loci for adiposity phenotypes on 8p, 9p, and 16q in American Samoa and Samoa. Obesity (Silver Spring) 2009;17:518–524. - PMC - PubMed
    1. McGarvey ST. Obesity in Samoans and a perspective on its etiology in Polynesians. Am. J. Clin. Nutr. 1991;53(Suppl. 6):1586S–1594S. - PubMed
    1. Hawley NL, et al. Prevalence of adiposity and associated cardiometabolic risk factors in the Samoan genome-wide association study. Am. J. Hum. Biol. 2014;26:491–501. - PMC - PubMed
    1. Tishkoff S. Strength in small numbers. Science. 2015;349:1282–1283. - PMC - PubMed
    1. McGarvey ST, Bindon JR, Crews DE, Schendel DE. In: Human Population Biology: A Transdisciplinary Science. Little MA, Haas JD, editors. Academic Press; 1989. pp. 263–279.

Publication types

Substances