. 2016 Jul 26:6:30338.
doi: 10.1038/srep30338.

Metabolic pathways regulated by γ-aminobutyric acid (GABA) contributing to heat tolerance in creeping bentgrass (Agrostis stolonifera)

Affiliations

Metabolic pathways regulated by γ-aminobutyric acid (GABA) contributing to heat tolerance in creeping bentgrass (Agrostis stolonifera)

Zhou Li et al. Sci Rep. .

Abstract

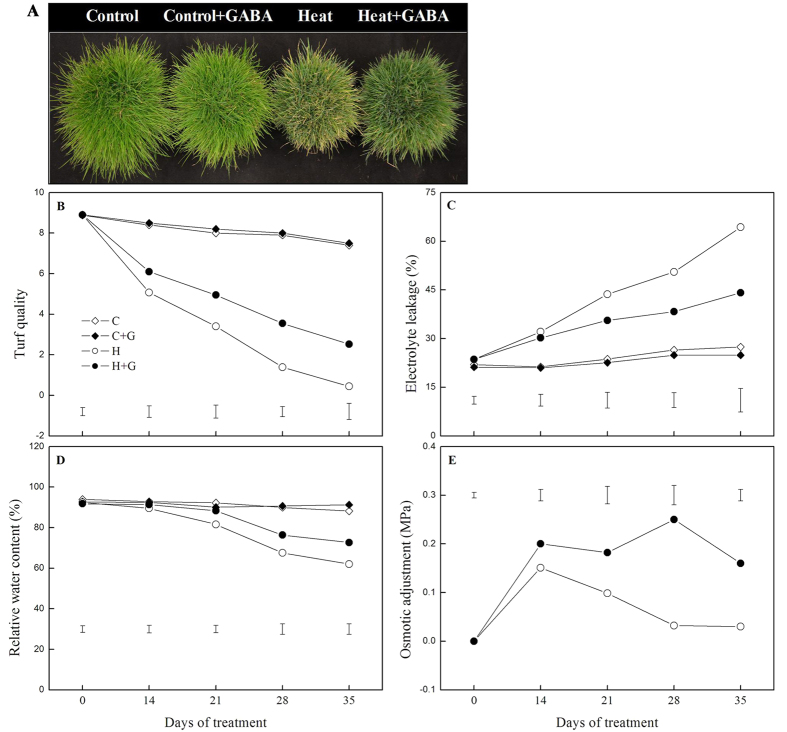
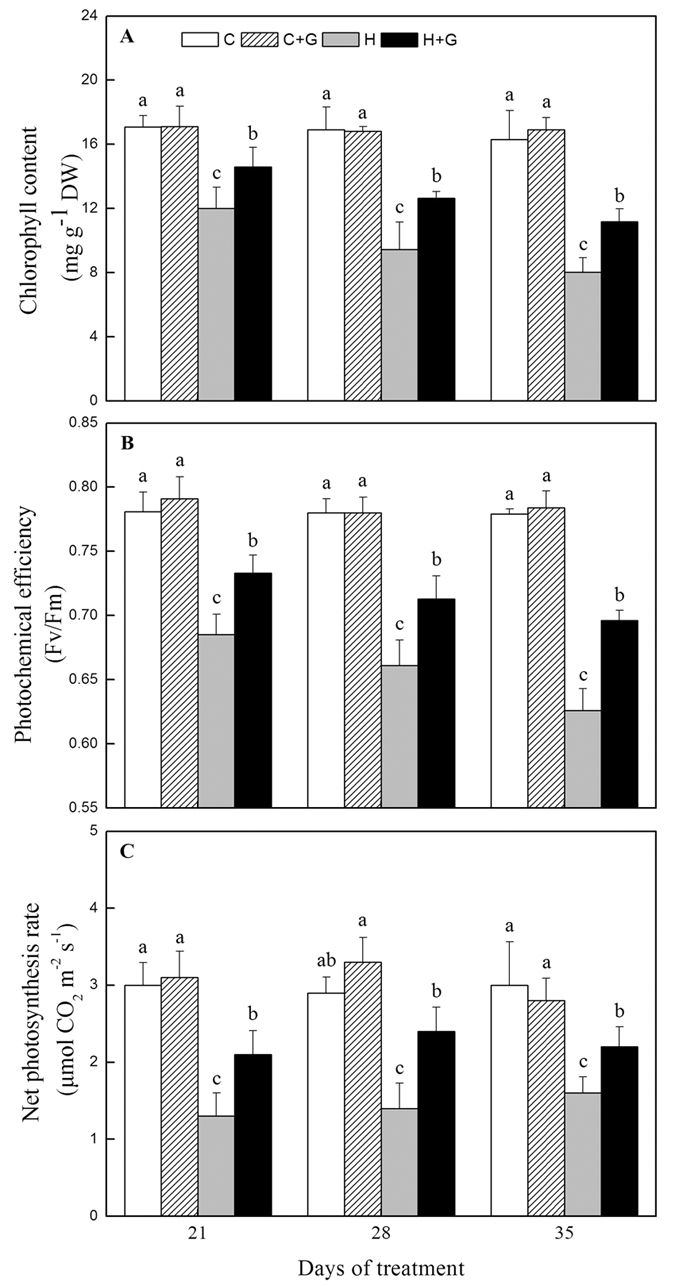
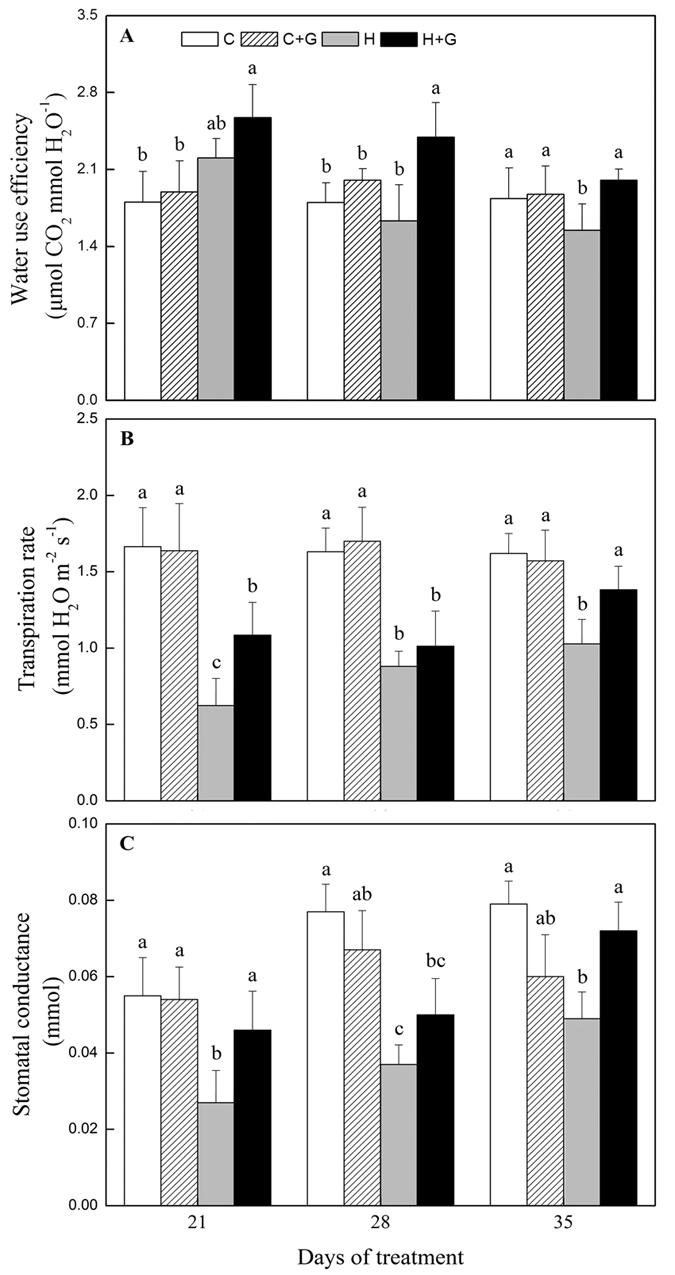
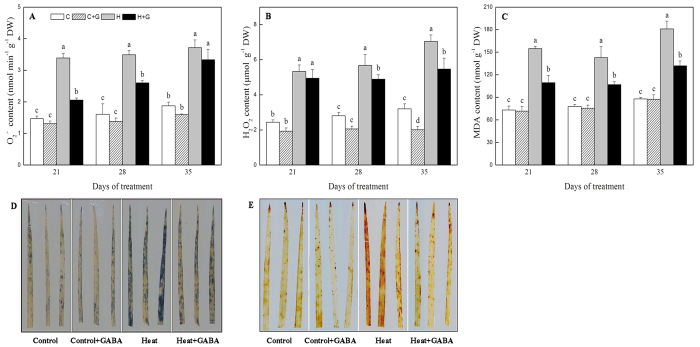
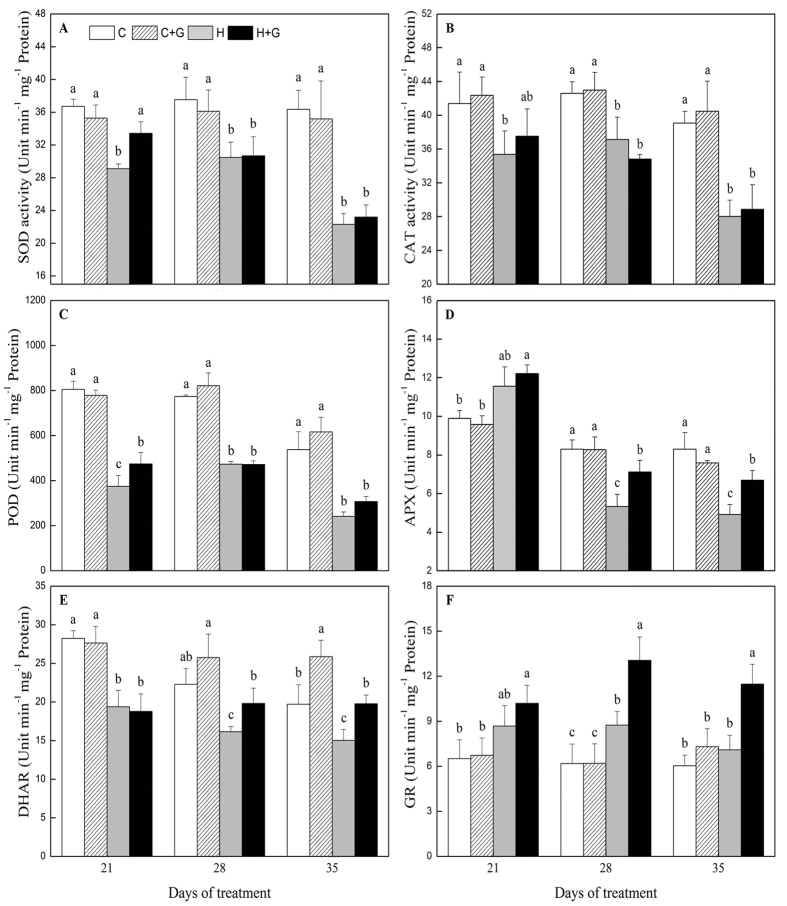
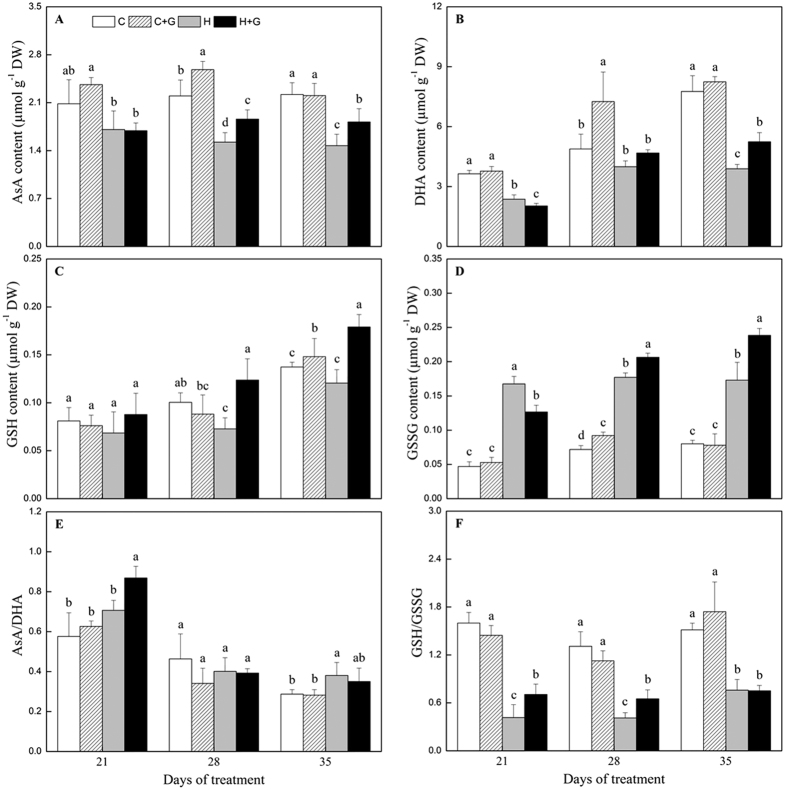
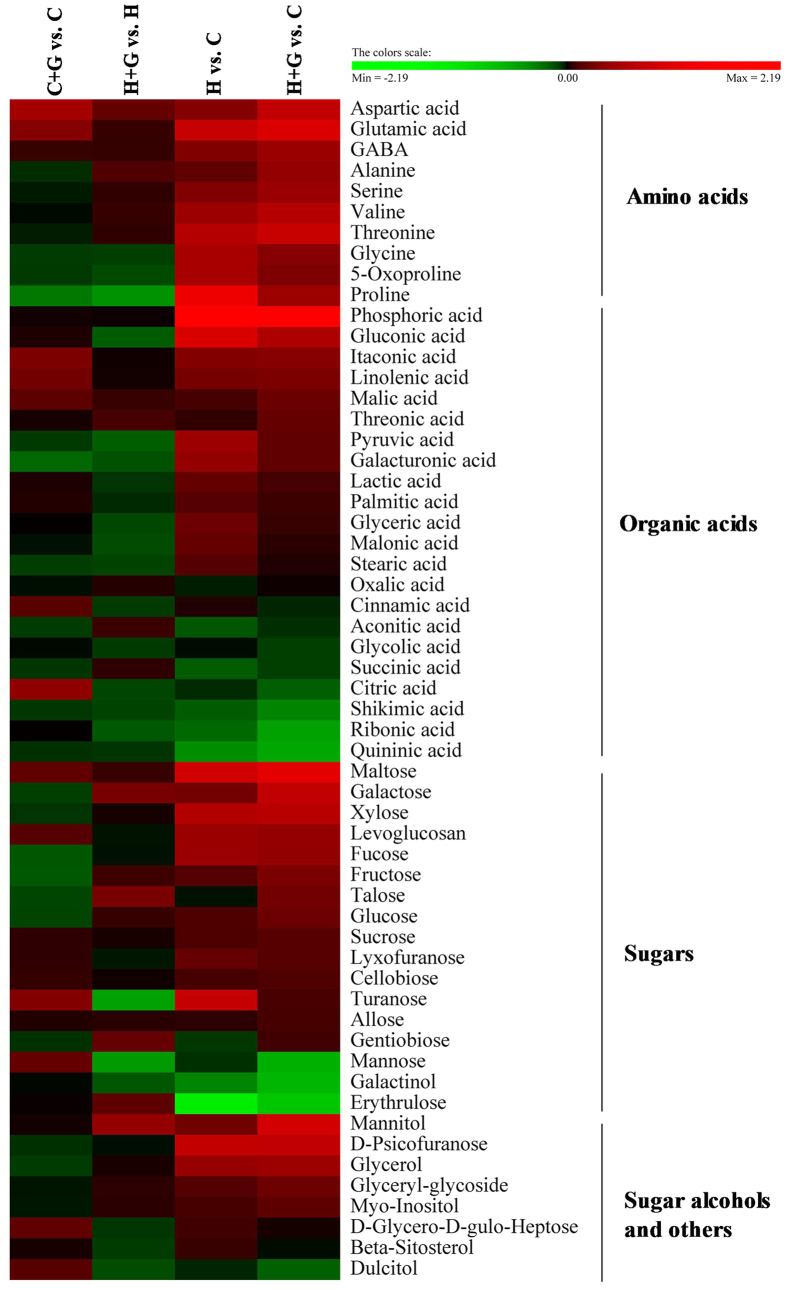
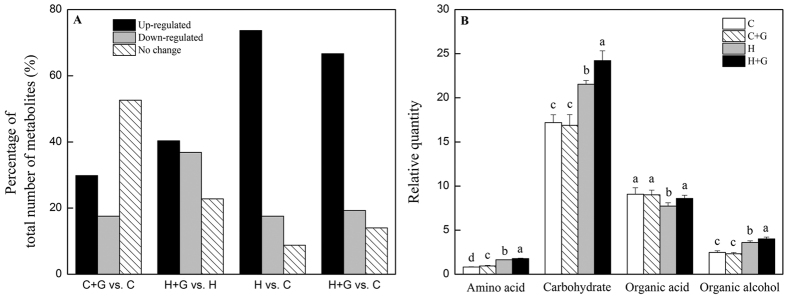
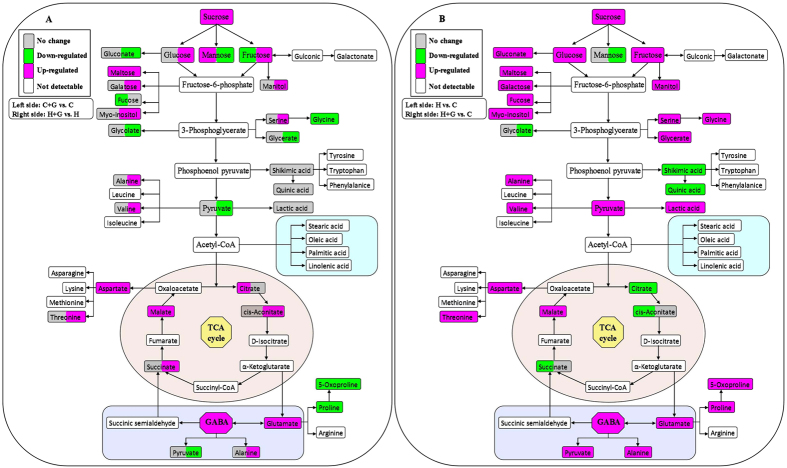
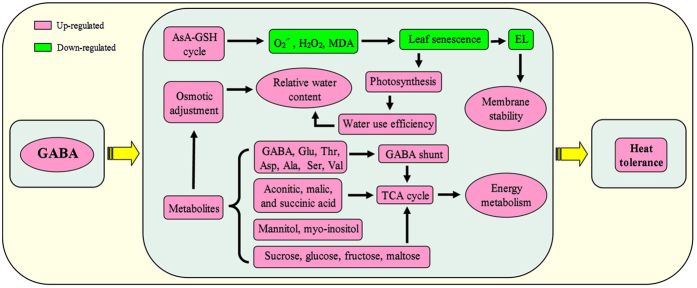
γ-Aminobutyric acid is a non-protein amino acid involved in various metabolic processes. The objectives of this study were to examine whether increased GABA could improve heat tolerance in cool-season creeping bentgrass through physiological analysis, and to determine major metabolic pathways regulated by GABA through metabolic profiling. Plants were pretreated with 0.5 mM GABA or water before exposed to non-stressed condition (21/19 °C) or heat stress (35/30 °C) in controlled growth chambers for 35 d. The growth and physiological analysis demonstrated that exogenous GABA application significantly improved heat tolerance of creeping bentgrass. Metabolic profiling found that exogenous application of GABA led to increases in accumulations of amino acids (glutamic acid, aspartic acid, alanine, threonine, serine, and valine), organic acids (aconitic acid, malic acid, succinic acid, oxalic acid, and threonic acid), sugars (sucrose, fructose, glucose, galactose, and maltose), and sugar alcohols (mannitol and myo-inositol). These findings suggest that GABA-induced heat tolerance in creeping bentgrass could involve the enhancement of photosynthesis and ascorbate-glutathione cycle, the maintenance of osmotic adjustment, and the increase in GABA shunt. The increased GABA shunt could be the supply of intermediates to feed the tricarboxylic acid cycle of respiration metabolism during a long-term heat stress, thereby maintaining metabolic homeostasis.


Figures

Figure 1
Figure 1. The effects of GABA on leaf water deficit and membrane stability during 35 d of 21/19 or 35/30 °C condition.
(A) Phenotype at 35 d of treatment, (B) turf quality, (C) electrolyte leakage, (D) relative water content, and (E) osmotic adjustment. Vertical bars represent least significance difference (LSD) values at a given day of treatment (P = 0.05). C, control; C + G, control + GABA; H, heat; H + G, heat + GABA.
Figure 2
Figure 2. The effects of GABA on photosynthesis during 35 d of 21/19 or 35/30 °C condition.
(A) Chlorophyll content; (B) Photochemical efficiency (Fv/Fm); (C) Net photosynthesis rate. Vertical bars above columns indicate standard error of each mean. Different letters indicate significant difference for comparison at a given day of treatment (P = 0.05). C, control; C + G, control + GABA; H, heat; H + G, heat + GABA.
Figure 3
Figure 3. The effects of GABA on water use during 35 d of 21/19 or 35/30 °C condition.
(A) Water use efficiency; (B) Transpiration rate; (C) Stomatal conductance. Vertical bars above columns indicate standard error of each mean. Different letters indicate significant difference for comparison at a given day of treatment (P = 0.05). C, control; C + G, control + GABA; H, heat; H + G, heat + GABA.
Figure 4
Figure 4. The effects of GABA on reactive oxygen species (ROS) accumulation during 35 d of 21/19 or 35/30 °C condition.
(A) Superoxide anion radical (O2·−) content, (B) hydrogen peroxide (H2O2) content, (C) malondialdehyde (MDA) content, (D) O2·− staining at 28 d of treatment, and (E) H2O2 staining at 35 d of treatment. Vertical bars above columns indicate standard error of each mean. Different letters indicate significant difference for comparison at a given day of treatment (P = 0.05). C, control; C + G, control + GABA; H, heat; H + G, heat + GABA.
Figure 5
Figure 5. The effects of GABA on antioxidant enzyme activities during 35 d of 21/19 or 35/30 °C condition.
(A) Superoxide dismutase (SOD) activity, (B) catalase (CAT) activity, (C) peroxide (POD) activity, and (D) ascorbate peroxidase (APX) activity, (E) dehydroascorbate reductase (DHAR) activity, (F) glutathione reductase (GR) activity. Vertical bars above columns indicate standard error of each mean. Different letters indicate significant difference for comparison at a given day of treatment (P = 0.05). C, control; C + G, control + GABA; H, heat; H + G, heat + GABA.
Figure 6
Figure 6. The effects of GABA on non–enzymatic antioxidants during 35 d of 21/19 or 35/30°C condition.
(A) reduced ascorbate (AsA), (B) dehydroascorbic acid (DHA), (C) reduced glutathione (GSH), (D) oxidized glutathione (GSSG), (E) AsA/DHA ratio, and (F) GSH/GSSG ratio. Vertical bars above columns indicate standard error of each mean. Different letters indicate significant difference for comparison at a given day of treatment (P = 0.05). C, control; C + G, control + GABA; H, heat; H + G, heat + GABA.
Figure 7
Figure 7. Heat map of changes in 57 metabolites levels in creeping bentgrass at 35 d in response to exogenous GABA application and heat stress.
The log2 fold change ratios are shown in the results. Red indicates an up–regulation, and green indicates a down–regulation. C + G vs. C and H + G vs. H implied the effects of exogenous GABA on metabolites under control or heat condition, respectively. H vs. C and H + G vs. C implied the effects of heat stress on metabolites without or with GABA application, respectively. C, control; C + G, control + GABA; H, heat; H + G, heat + GABA.
Figure 8
Figure 8
Change to (A) the percentage of total number of metabolites (%), and (B) total relative amino acid, organic acid, sugar and sugar alcohol content at 35 d of treatment. Vertical bars above columns indicate standard error of each mean. Different letters indicate significant difference (P = 0.05). C, control; C + G, control + GABA; H, heat; H + G, heat + GABA.
Figure 9
Figure 9
Change to (A) relative amino acids, (B) organic acids, and (C) sugars and sugar alcohols content at 35 d of treatment. Vertical bars above columns indicate standard error of each mean. Different letters indicate significant difference (P = 0.05). C, control; C + G, control + GABA; H, heat; H + G, heat + GABA.
Figure 10
Figure 10. Assignment of the 30 metabolites from 57 assayed metabolites to the metabolic pathway.
(A) The effects of increased GABA on metabolites under control or heat condition, and the color of left side each box means C + G vs. C, and the color of right side each box means H + G vs. H. (B) The effects of heat stress on metabolites without or with GABA application, and the color of left side each box means H vs. C, and the color of right side each box means H + G vs. C. C, control; C + G, control + GABA; H, heat; H + G, heat + GABA.
Figure 11
Figure 11. A proposed model for GABA–induced heat tolerance in creeping bentgrass associated with physiological and metabolic changes.
Red indicates an up–regulation, green indicates a down–regulation.

Similar articles

Cited by

References

    1. Hansen J. et al.. Global temperature change. Proc. Nat. Acad. Sci. USA 103, 14288–14293 (2006). - PMC - PubMed
    1. Wahid A., Gelani S., Ashrafa M. & Foolad M. R. Heat tolerance in plants: an overview. J. Exp. Bot. 61, 199–223 (2007).
    1. Blum A., Klueva N. & Nguyen H. T. Wheat cellular thermotolerance is related to yield under heat stress. Euphytica 117, 117–123 (2001).
    1. Fry J. & Huang B. R. Applied turfgrass science and physiology (John Wiley & Sons, 2004).
    1. Shelp B. J., Bown A. W. & McLean M. D. Metabolism and functions of γ–aminobutyric acid. Trends Plant Sci. 41, 446–452 (1999). - PubMed

Substances

LinkOut - more resources