. 2016 Aug 22;213(9):1675-83.
doi: 10.1084/jem.20151227. Epub 2016 Jul 25.

DNA polymerase ι functions in the generation of tandem mutations during somatic hypermutation of antibody genes

Affiliations

DNA polymerase ι functions in the generation of tandem mutations during somatic hypermutation of antibody genes

Robert W Maul et al. J Exp Med. .

Abstract

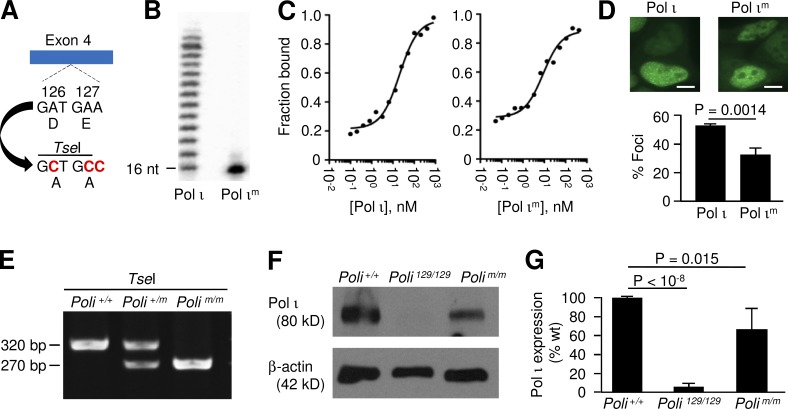
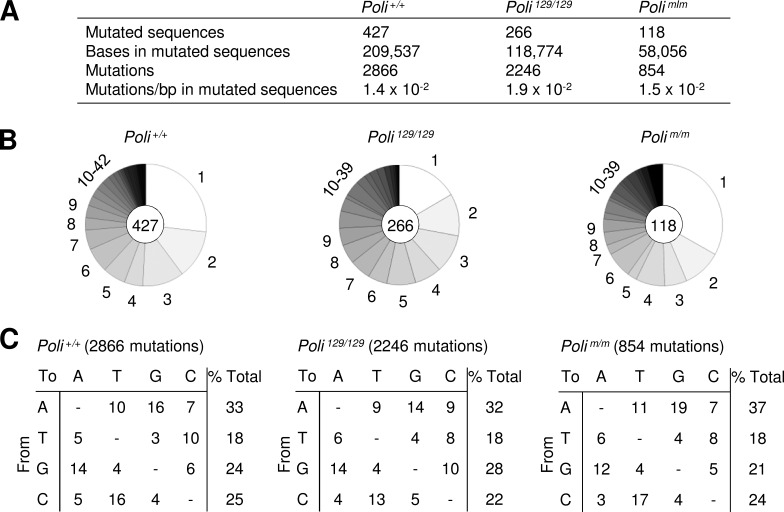
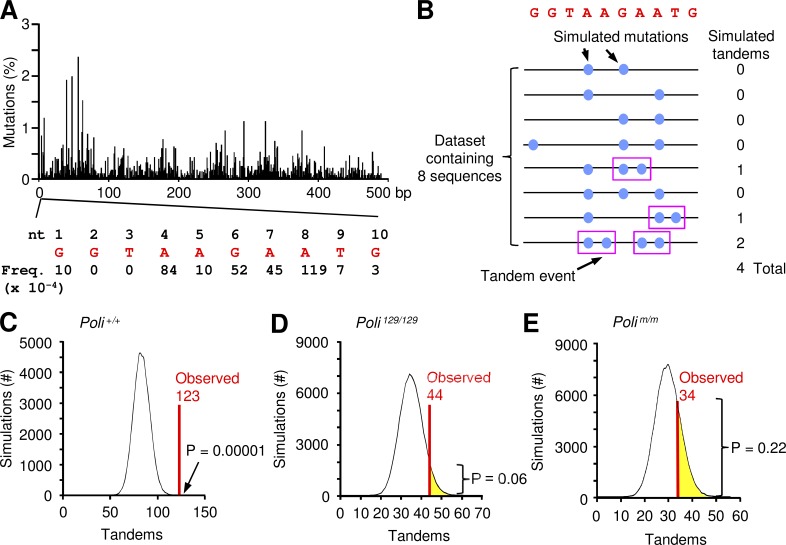
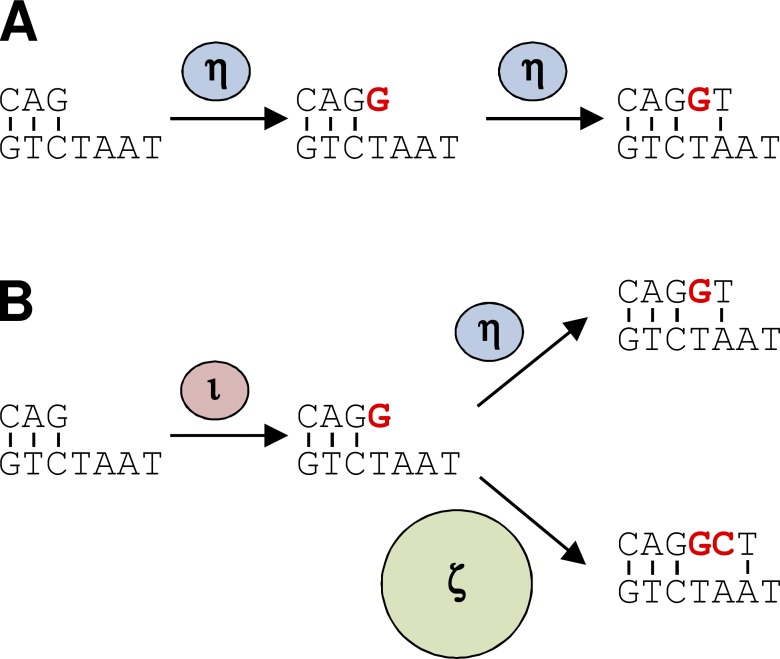
DNA polymerase ι (Pol ι) is an attractive candidate for somatic hypermutation in antibody genes because of its low fidelity. To identify a role for Pol ι, we analyzed mutations in two strains of mice with deficiencies in the enzyme: 129 mice with negligible expression of truncated Pol ι, and knock-in mice that express full-length Pol ι that is catalytically inactive. Both strains had normal frequencies and spectra of mutations in the variable region, indicating that loss of Pol ι did not change overall mutagenesis. We next examined if Pol ι affected tandem mutations generated by another error-prone polymerase, Pol ζ. The frequency of contiguous mutations was analyzed using a novel computational model to determine if they occur during a single DNA transaction or during two independent events. Analyses of 2,000 mutations from both strains indicated that Pol ι-compromised mice lost the tandem signature, whereas C57BL/6 mice accumulated significant amounts of double mutations. The results support a model where Pol ι occasionally accesses the replication fork to generate a first mutation, and Pol ζ extends the mismatch with a second mutation.


Figures

Figure 1.
Figure 1.
Pol ιm activity and expression in knock-in mice. (A) Nucleotide substitutions introduced into exon 4 produced D126A-E127A altered codons, and created a TseI restriction site for PCR genotyping. (B) DNA primer extension assay comparing wild-type Pol ι and Pol ιm. (C) Binding affinity of Pol ι and Pol ιm for DNA by EMSA analysis. The dissociation constant KD(DNA) was obtained by plotting the fraction of bound DNA as a function of enzyme concentration. (D) Replication foci formation. Representative images are shown for HEK293T cells transformed with either EGFP-Pol ι or EGFP-Pol ιm constructs. The protein is seen as multiple bright foci throughout the green nucleus at the bottom of each picture. Bars, 5 µm. Graph shows the results from three independent experiments, with 200 nuclei each counted for the constructs. Error bars represent the standard deviation; p-value was calculated from a two-tailed Student’s t test. (E) Genotyping analysis of Poli alleles. PCR amplification produced a 320-bp amplicon, which was digested with TseI. (F) Pol ι expression in mouse testis from three strains of mice, comparing Pol ι and β-actin by Western blot. A representative image is shown. (G) Quantification of Western blot signals normalized to β-actin. Error bars signify the standard deviation of values from three independent experiments with two to four mice per experiment. The p-value was determined from a two-tailed Student’s t test.
Figure 2.
Figure 2.
Somatic hypermutation analyses in JH4 intron of germinal center B cells. (A) Frequency of mutation in the JH4 intron from Peyer’s patch B cells for Poli+/+, Poli129/129, and Polim/m mice. Poli+/+ data are previously published; Poli129/129 data are from McDonald et al. (2003), and four additional independent experiments, with one to three mice per experiment; and Polim/m data are from three independent experiments, with two to five mice per experiment. (B) Number of mutations per sequence. Each pie segment depicts the percentage of sequences with one or more mutations. Center circle shows number of mutated sequences analyzed. (C) Spectra of substitutions. The number of mutations is shown in parentheses. Mutations were recorded from the nontranscribed strand and corrected for base composition of the sequence. Data are expressed as a percentage of mutations.
Figure 3.
Figure 3.
Computational model to determine significance of tandem mutations. (A) Frequency of mutation at each nucleotide in the JH4 intron (492 bp). Data are from 2866 mutations observed in C57BL/6 sequences. Expanded view shows the frequency per base of the first 10 nucleotides (red). (B) Schematic description of the computational model. A dataset of eight sequences is constructed with simulated mutations (blue circles) inserted into the red germline sequence of the first 10 nucleotides. Mutations correspond to the observed mutation frequencies shown in A. The number of simulated tandems (circles in pink boxes) that are generated randomly is calculated for each sequence. (C) Plot of simulations versus tandems. For Poli+/+ sequences, the total number of expected tandems in each simulated dataset is shown as a histogram. The observed number of tandems, 123, is marked by a red line. The p-value, 0.00001, was calculated as the fraction of simulations (out of 100,000) in which the number of expected tandems was greater than, plus half of the number equal, to the observed number. (D and E) Values for Poli29/129 and Polim/m sequences. The observed number of tandems is shown in red, and the number of simulations with expected tandems greater than the observed number is highlighted in yellow. P-values were determined as in C.
Figure 4.
Figure 4.
Two-step model of Pol ι and Pol ζ in tandem genesis. (A) Pol η generates mutations (red) when copying A:T bp and extends the single mismatch with the correct base. (B) Occasionally, Pol ι synthesizes a mutation, falls off, and Pol η extends the single mispair. Alternatively, Pol ζ synthesizes a second mutation, and extends the double mismatch with the correct base, producing a tandem mutation.

References

    1. Aoufouchi S., De Smet A., Delbos F., Gelot C., Guerrera I.C., Weill J.C., and Reynaud C.A.. 2015. 129-Derived mouse strains express an unstable but catalytically active DNA polymerase iota variant. Mol. Cell. Biol. 35:3059–3070. 10.1128/MCB.00371-15 - DOI - PMC - PubMed
    1. Bardwell P.D., Woo C.J., Wei K., Li Z., Martin A., Sack S.Z., Parris T., Edelmann W., and Scharff M.D.. 2004. Altered somatic hypermutation and reduced class-switch recombination in exonuclease 1-mutant mice. Nat. Immunol. 5:224–229. 10.1038/ni1031 - DOI - PubMed
    1. Daly J., Bebenek K., Watt D.L., Richter K., Jiang C., Zhao M.L., Ray M., McGregor W.G., Kunkel T.A., and Diaz M.. 2012. Altered Ig hypermutation pattern and frequency in complementary mouse models of DNA polymerase ζ activity. J. Immunol. 188:5528–5537. 10.4049/jimmunol.1102629 - DOI - PMC - PubMed
    1. Delbos F., Aoufouchi S., Faili A., Weill J.C., and Reynaud C.A.. 2007. DNA polymerase eta is the sole contributor of A/T modifications during immunoglobulin gene hypermutation in the mouse. J. Exp. Med. 204:17–23. 10.1084/jem.20062131 - DOI - PMC - PubMed
    1. Donigan K.A., McLenigan M.P., Yang W., Goodman M.F., and Woodgate R.. 2014. The steric gate of DNA polymerase ι regulates ribonucleotide incorporation and deoxyribonucleotide fidelity. J. Biol. Chem. 289:9136–9145. 10.1074/jbc.M113.545442 - DOI - PMC - PubMed

Publication types