. 2016 Jul 26:6:30135.
doi: 10.1038/srep30135.

Full transcription of the chloroplast genome in photosynthetic eukaryotes

Affiliations

Full transcription of the chloroplast genome in photosynthetic eukaryotes

Chao Shi et al. Sci Rep. .

Abstract

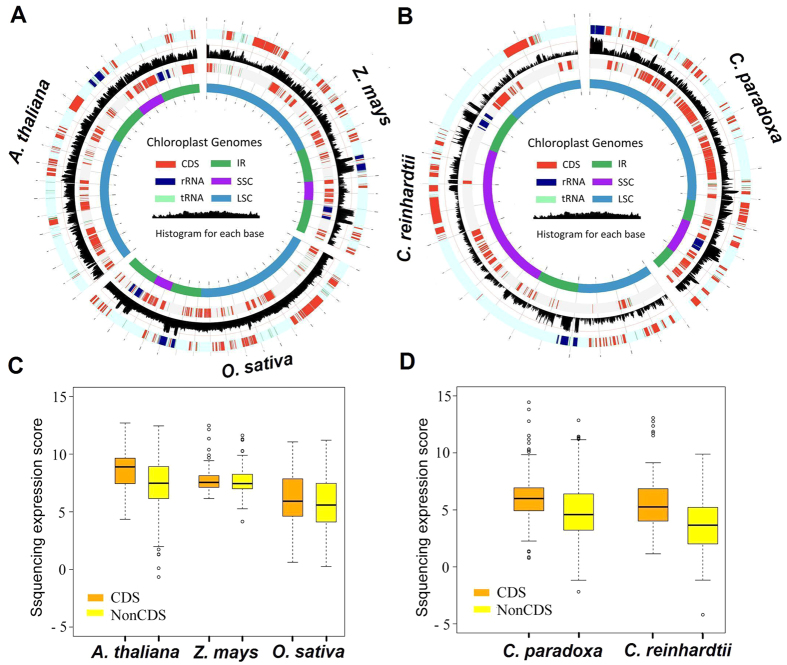
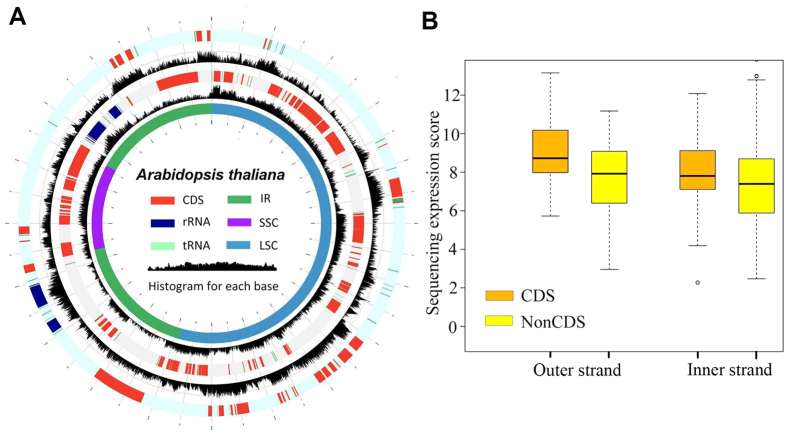
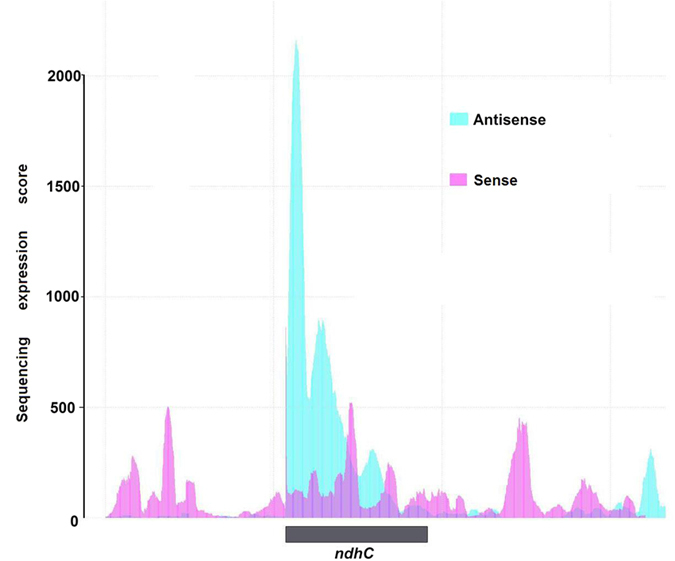
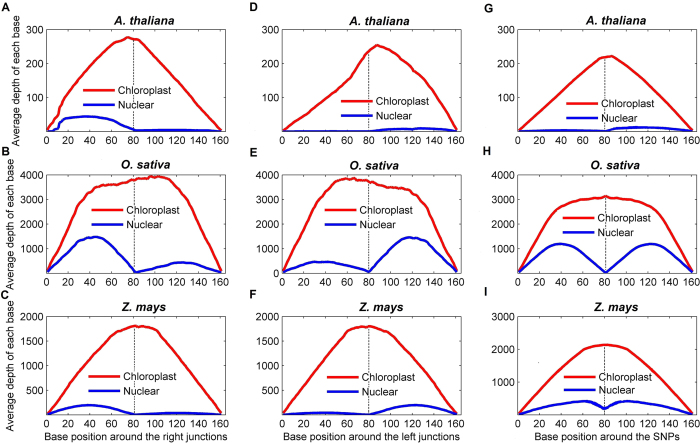
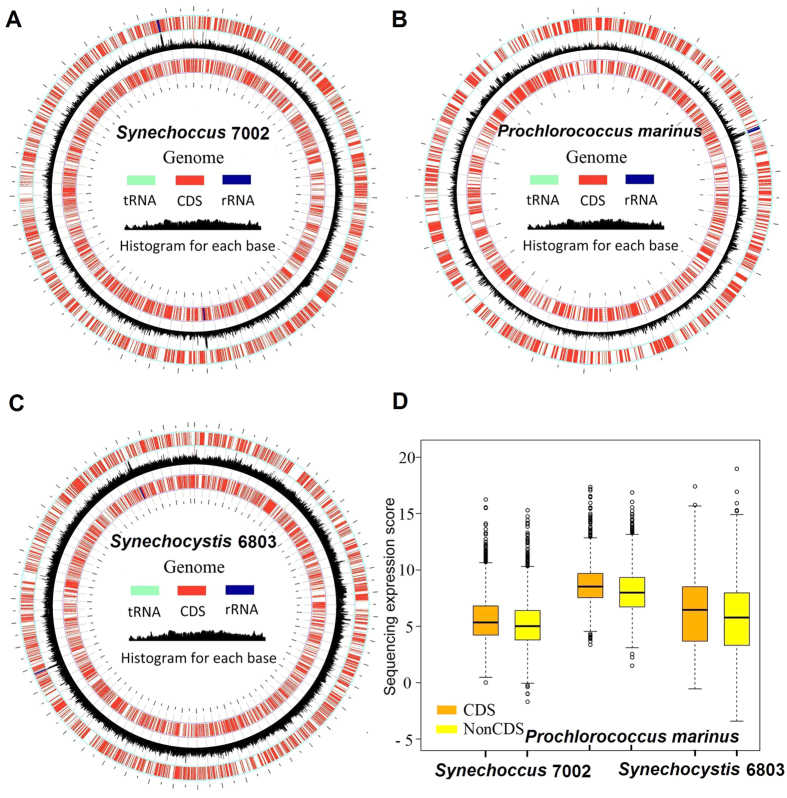
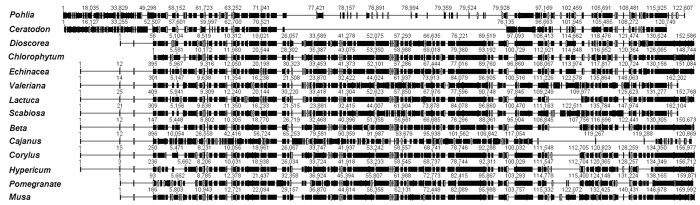
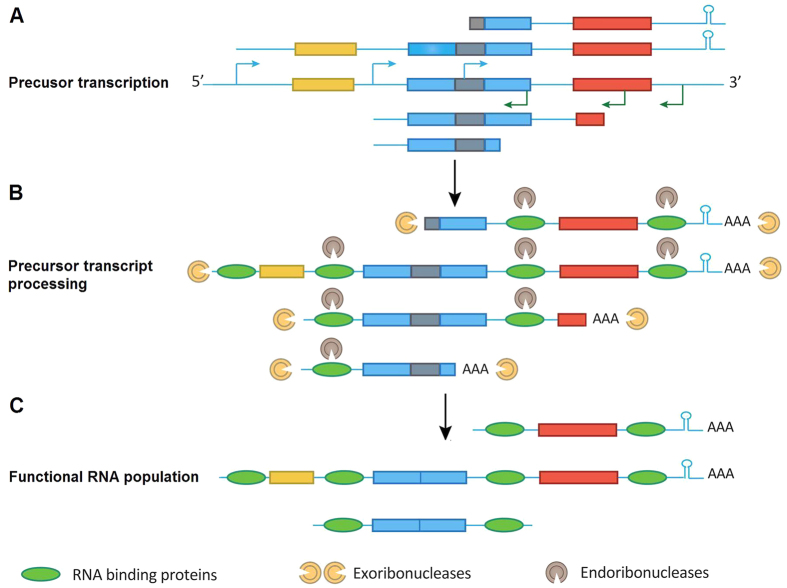
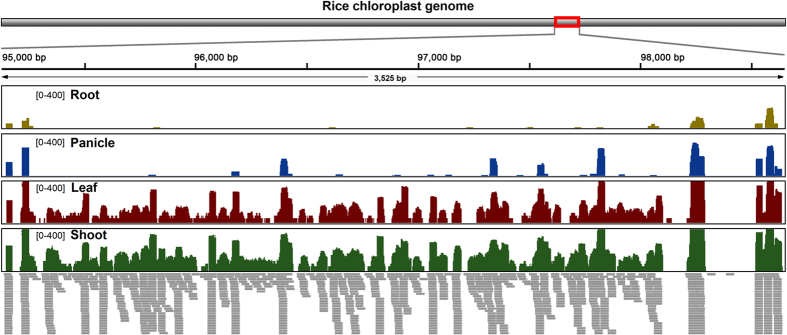
Prokaryotes possess a simple genome transcription system that is different from that of eukaryotes. In chloroplasts (plastids), it is believed that the prokaryotic gene transcription features govern genome transcription. However, the polycistronic operon transcription model cannot account for all the chloroplast genome (plastome) transcription products at whole-genome level, especially regarding various RNA isoforms. By systematically analyzing transcriptomes of plastids of algae and higher plants, and cyanobacteria, we find that the entire plastome is transcribed in photosynthetic green plants, and that this pattern originated from prokaryotic cyanobacteria - ancestor of the chloroplast genomes that diverged about 1 billion years ago. We propose a multiple arrangement transcription model that multiple transcription initiations and terminations combine haphazardly to accomplish the genome transcription followed by subsequent RNA processing events, which explains the full chloroplast genome transcription phenomenon and numerous functional and/or aberrant pre-RNAs. Our findings indicate a complex prokaryotic genome regulation when processing primary transcripts.


Figures

Figure 1
Figure 1. Full transcription of the photosynthetic eukaryote chloroplast genomes.
(A,B) Integrated maps of the plastome transcription with the outer and third tracks representing the plastome genes, the inner track showing four genomic regions of the plastome, and the black histogram of the second track representing RNAseq reads mapping (scale log10-transformed numbers of sequence reads per nucleotide). The three species, rice, maize, and Arabidopsis were integrated into (A) and two unicellular algae Chlamydomonas and C. paradoxa were integrated into (B). The genome map was proportional to its actual genome size. The separated transcription maps for these five species are also shown in Supplementary Fig. S1. Box-and-whisker plots (in which the whiskers denote the 5th and 95th quantiles) of log2-transformed numbers of sequence reads per nucleotide for all intergenic sequences (NonCDS) and coding sequences (CDS). Diamonds represent outliers.
Figure 2
Figure 2. Both strands of the Arabidopsis plastome were transcribed.
(A) Strand-specific transcriptome reads were mapped to both strands of the Arabidopsis plastome. The outer and third tracks represent genes in the outer and inner strand, respectively. The black histograms of the second and fourth tracks indicate RNAseq reads mapping (scale log10-transformed numbers of sequence reads per nucleotide). (B) Comparisons of intergenic and coding region transcription for each strand of the Arabidopsis plastome. Box-and-whisker plots (in which the whiskers denote the 5th and 95th quantiles) of log2-transformed numbers of sequence reads per nucleotide for all intergenic sequences (NonCDS) and coding sequences (CDS). Diamonds represent outliers.
Figure 3
Figure 3. Antisense transcription in the chloroplast genome.
Strand-specific transcriptome reads showing that antisense transcription (light blue) exceeds sense transcription (light red) for the ndhC gene.
Figure 4
Figure 4. Examination of nupDNA transcription.
(AF) nupDNAs (blue) and plastome sequences (red) with a homologous sequence before (AC) and after the site 80 (DF). (GI) nupDNAs (blue) and plastome homologous sequences (red) with a single SNP or indel in site 80. All nupDNAs and plastome homologous sequences had a sequence length of 160 bp (x-axis). The y-axis represents the RNAseq reads mapping depth per nucleotide.
Figure 5
Figure 5. Full transcription of the cyanobacteria genomes.
(AC) Maps of the cyanobacteria genomes transcription with the outer and third tracks representing genes in the genome, and the black histogram of the second track represent RNAseq reads mapping (scale log10-transformed numbers of sequence reads per nucleotide). (D) Comparisons of intergenic and coding region transcription for the five species. Box-and-whisker plots (in which the whiskers denote the 5th and 95th quantiles) of log2-transformed numbers of sequence reads per nucleotide are shown for all the intergenic sequences (NonCDS) and coding sequences (CDS). Diamonds represent outliers.
Figure 6
Figure 6. Complete cp genomes were de novo assembled from transcriptome data.
The wrap sequence alignment of the assembled genome. The black blocks depict genome similarity for these species. A detailed species list is provided in Supplementary Table S7.
Figure 7
Figure 7. Model for the full plastome transcription and procession.
(A) Transcription initiation of a gene cluster occurs from multiple promoters (bent arrow) upstream of open reading frames (ORFs) or within ORFs. Together with inefficient transcription termination, this setup generates numerous precursor transcripts that can include complete or incomplete ORFs. Introns and RNA stem–loop structures are depicted as light black rectangles and hairpins, respectively. (B) Precursor transcripts are processed by a combination of exo- and endo-ribonucleases. The precursor transcripts also can be polyadenylated by the addition of a Poly(A)-tail at the 3′-end of the transcripts. The sequence-specific RNA-binding proteins define functional RNAs followed by ribonuclease digestion. Introns and incomplete ORFs without sequence-specific RNA-binding proteins protection were digested by exo- or endo-ribonucleases. (C) RNA processing produces a pool of functional RNAs.
Figure 8
Figure 8. Small RNA transcription in the rice chloroplast genome.
Small RNA transcriptome reads of four tissues were mapped to the rice plastome. The colored histograms represent small RNA mapping coverage in a logarithmic scale. Detailed statistics of reads mapping is given in Supplementary Table S8.

Similar articles

Cited by

References

    1. Jacquier A. The complex eukaryotic transcriptome: unexpected pervasive transcription and novel small RNAs. Nat. Rev. Genet. 10, 833–844 (2009). - PubMed
    1. Xu Z. et al.. Bidirectional promoters generate pervasive transcription in yeast. Nature 457, 1033–1037 (2009). - PMC - PubMed
    1. Neil H. et al.. Widespread bidirectional promoters are the major source of cryptic transcripts in yeast. Nature 457, 1038–1042 (2009). - PubMed
    1. Fejes-Toth K. et al.. Post-transcriptional processing generates a diversity of 5’-modified long and short RNAs. Nature 457, 1028–1032 (2009). - PMC - PubMed
    1. Brown J. B. et al.. Diversity and dynamics of the Drosophila transcriptome. Nature 512, 393–399 (2014). - PMC - PubMed

Publication types