

Diaphragm assessment by two dimensional speckle tracking imaging in normal subjects
- PMID: 27456490
- PMCID: PMC4960718
- DOI: 10.1186/s12871-016-0201-6
Diaphragm assessment by two dimensional speckle tracking imaging in normal subjects
Abstract
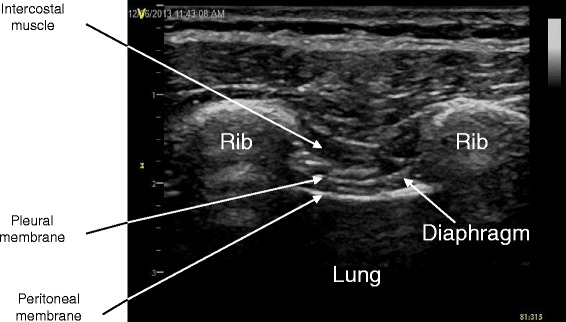
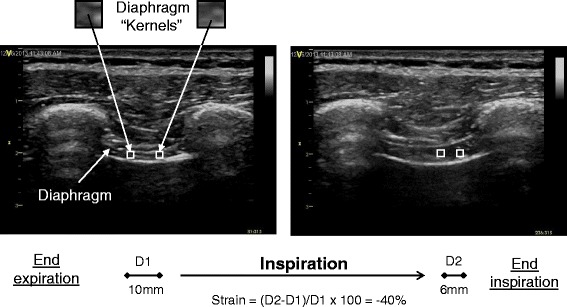
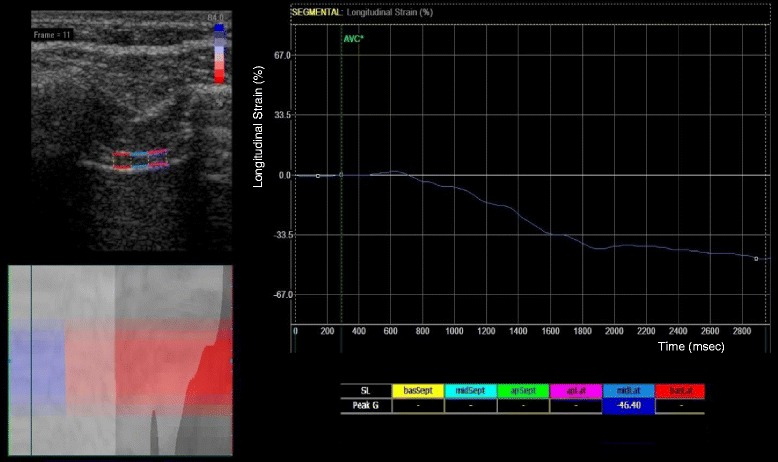
Background: Conventionally, ultrasonographic assessment of diaphragm contractility has involved measuring respiratory changes in diaphragm thickness (thickening fraction) using B-mode or caudal displacement with M-mode. Two-dimensional speckle-tracking has been increasingly used to assess muscle deformation ('strain') in echocardiography. We sought to determine in a pilot study if this technology could be utilized to analyze diaphragmatic contraction.
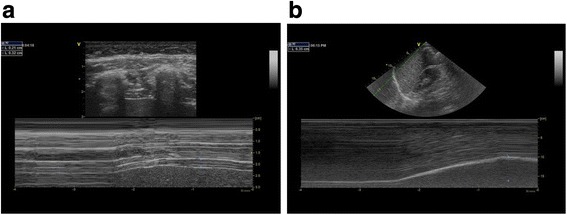
Methods: Fifty healthy adult volunteers with normal exercise capacity underwent ultrasound imaging. A linear array transducer was used for the assessment of diaphragm thickness, thickening fraction (TF), and strain in the right anterior axillary line at approximately the ninth intercostal space. A phased array transducer was applied subcostally for the assessment of diaphragm displacement on the right mid-clavicular line. Diaphragmatic images were recorded from the end of expiration through the end of inspiration at 60 % maximal inspiratory capacity. Diaphragm strain was analyzed off-line by speckle tracking imaging. Blinded inter- and intra-rater variability was tested in 10 cases.
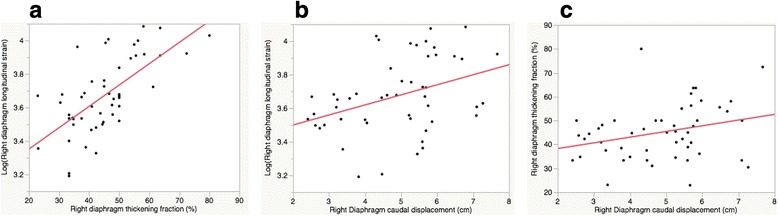
Results: Mean right diaphragm thickness at end-expiration (±SD: standard deviation) was 0.24 cm (±0.1), with TF of 45.1 % (±12) at 60 % peak inspiratory effort. Mean right diaphragm caudal displacement was 4.9 cm (±1). Mean right diaphragm strain was -40.3 % (±9). A moderate correlation was seen between longitudinal strain and TF (R(2) 0.44, p < 0.0001). A weak correlation was seen between strain and caudal displacement (R(2) 0.14, p < 0.01), and an even weaker correlation was seen between caudal displacement and TF (R(2) 0.1, p = 0.04). Age, gender, and body mass index were not significantly associated with right diaphragm strain or TF. Although inter- and intra-rater variability was overall good for TF, caudal displacement, and strain (inter-rater R(2); 0.8, 0.9, and 0.7, respectively [p < 0.01], intra-rater R(2); 0.9, 0.7, and 0.9, respectively [p < 0.01]), strain values did have a slightly lower inter-rater repeatability.
Conclusions: Diaphragmatic strain estimated by speckle tracking imaging was associated with conventional ultrasound measures of diaphragmatic function (TF and caudal displacement). Further clinical studies are warranted to investigate its clinical utility.
Keywords: Diaphragm; Speckle tracking; Ultrasound.
Figures
Similar articles
-
Functional assessment of the diaphragm by speckle tracking ultrasound during inspiratory loading.J Appl Physiol (1985). 2017 Nov 1;123(5):1063-1070. doi: 10.1152/japplphysiol.00095.2017. Epub 2017 May 18. J Appl Physiol (1985). 2017. PMID: 28522757 Clinical Trial.
-
Comparison of assessment of diaphragm function using speckle tracking between patients with successful and failed weaning: a multicentre, observational, pilot study.BMC Pulm Med. 2022 Dec 1;22(1):459. doi: 10.1186/s12890-022-02260-z. BMC Pulm Med. 2022. PMID: 36456940 Free PMC article.
-
Diaphragmatic thickness-lung volume relationship in vivo.J Appl Physiol (1985). 1989 Oct;67(4):1560-8. doi: 10.1152/jappl.1989.67.4.1560. J Appl Physiol (1985). 1989. PMID: 2676955
-
Reliability and validity of ultrasonography in evaluating the thickness, excursion, stiffness, and strain rate of respiratory muscles in non-hospitalized individuals: a systematic review.BMC Oral Health. 2023 Dec 2;23(1):959. doi: 10.1186/s12903-023-03558-y. BMC Oral Health. 2023. PMID: 38042780 Free PMC article.
-
Monitoring diaphragm function in the ICU.Curr Opin Crit Care. 2020 Feb;26(1):18-25. doi: 10.1097/MCC.0000000000000682. Curr Opin Crit Care. 2020. PMID: 31876624 Review.
Cited by
-
A Novel Normalized Cross-Correlation Speckle-Tracking Ultrasound Algorithm for the Evaluation of Diaphragm Deformation.Front Med (Lausanne). 2021 Mar 12;8:612933. doi: 10.3389/fmed.2021.612933. eCollection 2021. Front Med (Lausanne). 2021. PMID: 33777969 Free PMC article.
-
Speckle tracking ultrasonography as a new tool to assess diaphragmatic function: a feasibility study.Ultrasonography. 2022 Apr;41(2):403-415. doi: 10.14366/usg.21044. Epub 2021 Aug 17. Ultrasonography. 2022. PMID: 34749444 Free PMC article.
-
Diaphragm ultrasound and diaphragmatic 2D speckle tracking imaging in acute heart failure: a case series.Eur Heart J Case Rep. 2024 Nov 28;8(12):ytae632. doi: 10.1093/ehjcr/ytae632. eCollection 2024 Dec. Eur Heart J Case Rep. 2024. PMID: 39687532 Free PMC article.
-
Ultrasound assessment of diaphragm thickness, contractility, and strain in healthy pediatric patients.Pediatr Pulmonol. 2024 Feb;59(2):433-441. doi: 10.1002/ppul.26768. Epub 2023 Dec 1. Pediatr Pulmonol. 2024. PMID: 38038168 Free PMC article.
-
Diaphragmatic ultrasound and its relationship to breathing effort and load: a prospective observational study.Crit Care. 2025 May 13;29(1):190. doi: 10.1186/s13054-025-05436-1. Crit Care. 2025. PMID: 40361191 Free PMC article.
References
-
- Zambon M, Cabrini L, Zangrillo A. Diaphragmatic Ultrasound in Critically Ill Patients. Annual update in Intensive Care and Emergency Medicine. 2013 2013:427–438. - PubMed
-
- Wait JL, Nahormek PA, Yost WT, Rochester DP. Diaphragmatic thickness-lung volume relationship in vivo. J Appl Physiol. 1989;67:1560–1568. - PubMed
Publication types
MeSH terms
Grants and funding
LinkOut - more resources
Full Text Sources
Other Literature Sources
Miscellaneous
