

Role of thigh muscle cross-sectional area and strength in progression of knee cartilage degeneration over 48 months - data from the Osteoarthritis Initiative
- PMID: 27457100
- PMCID: PMC5614519
- DOI: 10.1016/j.joca.2016.07.004
Role of thigh muscle cross-sectional area and strength in progression of knee cartilage degeneration over 48 months - data from the Osteoarthritis Initiative
Abstract
Objective: To determine in a 48-month longitudinal study the association of thigh muscle cross-sectional area (CSA) and strength on progression of morphologic knee cartilage degeneration using 3T magnetic resonance imaging (MRI).
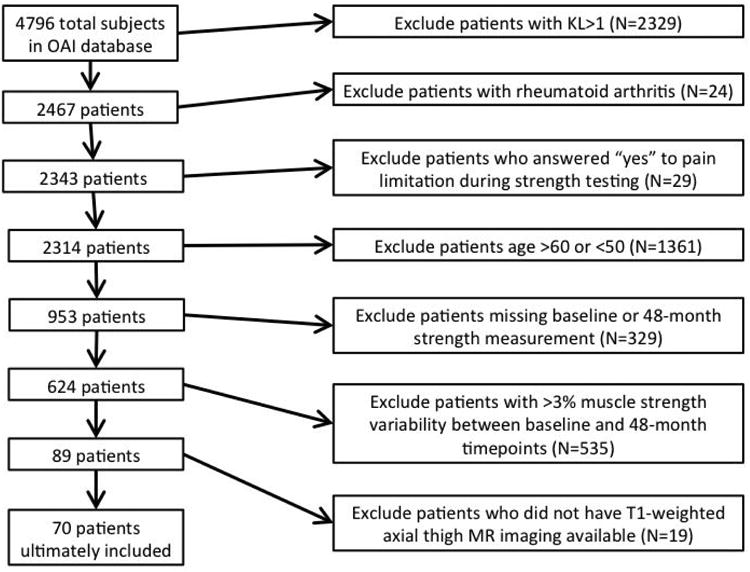
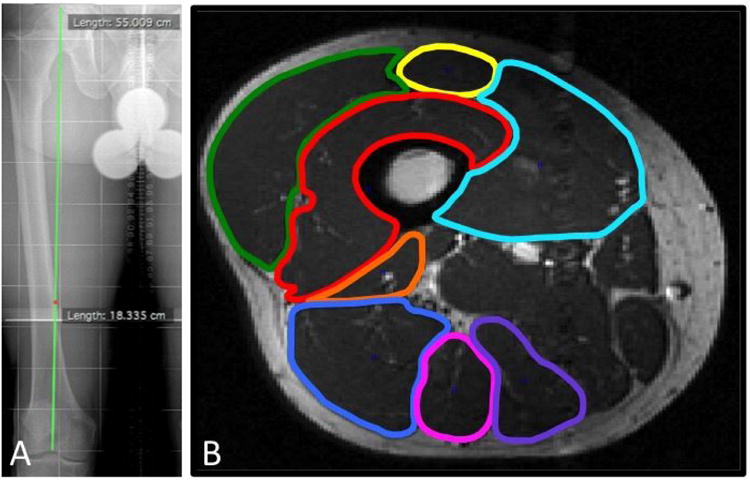
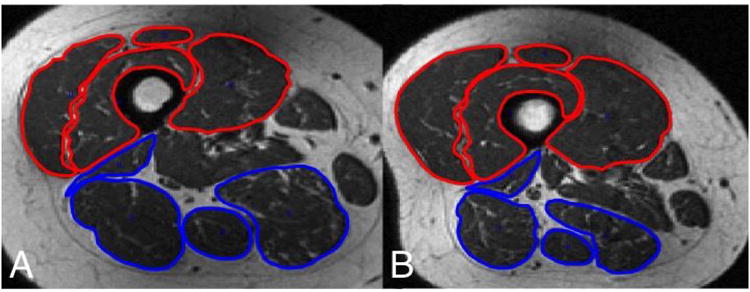
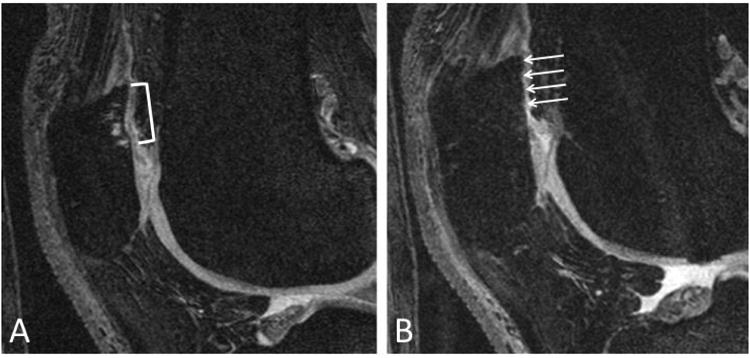
Design: Seventy Osteoarthritis Initiative (OAI) subjects aged 50-60 years, with no radiographic evidence of osteoarthritis (OA) and constant muscle strength over 48 months as measured by isometric knee extension testing were included. Baseline right thigh muscle CSAs were assessed on axial T1-weighted magnetic resonance (MR) images, and extensor to flexor CSA ratios were calculated. Degenerative knee abnormalities at baseline and 48-months were graded on right knee 3T MRIs using a modified whole organ MRI score (WORMS). Statistical analysis employed Student's t-tests and multivariable regression models adjusted for age, body mass index and gender.
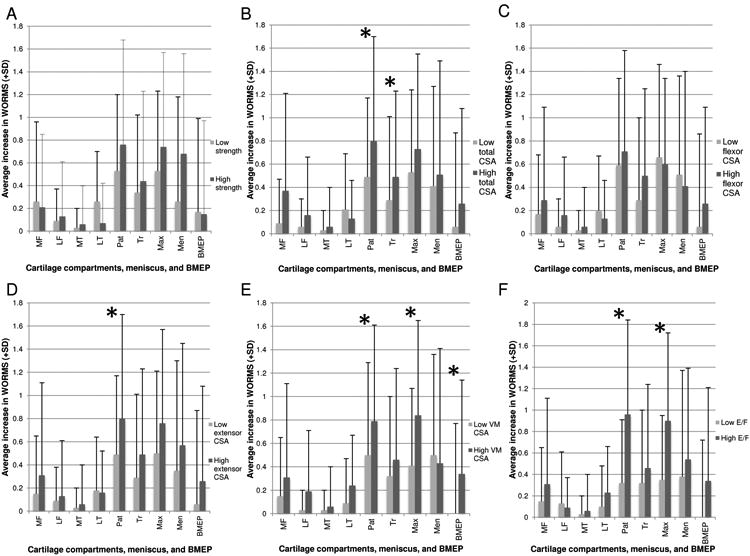
Results: Extension strength was significantly and positively correlated with baseline thigh muscle CSA (r = 0.65, P < 0.001). Greater baseline total thigh muscle CSA was significantly associated with increase of cartilage WORMS scores over 48 months in patellar (P = 0.027) and trochlear (P = 0.038) compartments, but not in other knee compartments. Among specific muscle groups, CSA of extensors (P = 0.021) and vastus medialis (VM) (P = 0.047) were associated with patellar cartilage increase in WORMS. Baseline E/F ratio had a significant positive association with patellar WORMS cartilage score increase over 48 months, P = 0.0015. There were no other significant associations between muscle CSA/ratios and increase in WORMS scores.
Conclusion: Maintenance of proper extensor to flexor muscle balance about the knee through decreased E/F ratios may slow patellofemoral cartilage deterioration, while higher extensor and VM CSA may increase patellofemoral cartilage loss.
Keywords: Cartilage; Extension strength; Knee; MR imaging; Muscle cross-sectional area; Osteoarthritis.
Copyright © 2016 Osteoarthritis Research Society International. Published by Elsevier Ltd. All rights reserved.
Conflict of interest statement
Figures
References
-
- Carmona-Terés V, Lumillo-Guttiérez I, Jodar-Fernández L, Rodriguez-Blanco T, Moix-Queraltó J, Pujol-Ribera E, et al. Effectiveness and cost-effectiveness of a health coaching intervention to improve the lifestyle of patients with knee osteoarthritis: cluster randomized clinical trial. BMC Musculoskelet Disord. 2015;16:1–12. - PMC - PubMed
-
- Roberts VI, Esler CNA, Harper WM. A 15-year follow-up study of 4606 primary total knee replacements. J Bone Joint Surg Br. 2007;89B:1452–1456. - PubMed
-
- Lohmander LS, Englund PM, Dahl LL, Roos EM. The long-term consequence of anterior cruciate ligament and meniscus injuries: osteoarthritis. Am J Sports Med. 2007;35:1756–69. - PubMed
-
- Øiestad BE, Juhl CB, Eitzen I, Thorlund JB. Knee extensor muscle weakness is a risk factor for development of knee osteoarthritis. A systematic review and meta-analysis Osteoarthritis Cartilage. 2015;23:171–177. - PubMed
MeSH terms
Grants and funding
LinkOut - more resources
Full Text Sources
Other Literature Sources
