. 2016 Sep;172(1):389-404.
doi: 10.1104/pp.16.00285. Epub 2016 Jul 25.

Flowering Time-Regulated Genes in Maize Include the Transcription Factor ZmMADS1

Affiliations

Flowering Time-Regulated Genes in Maize Include the Transcription Factor ZmMADS1

Philipp Alter et al. Plant Physiol. 2016 Sep.

Abstract

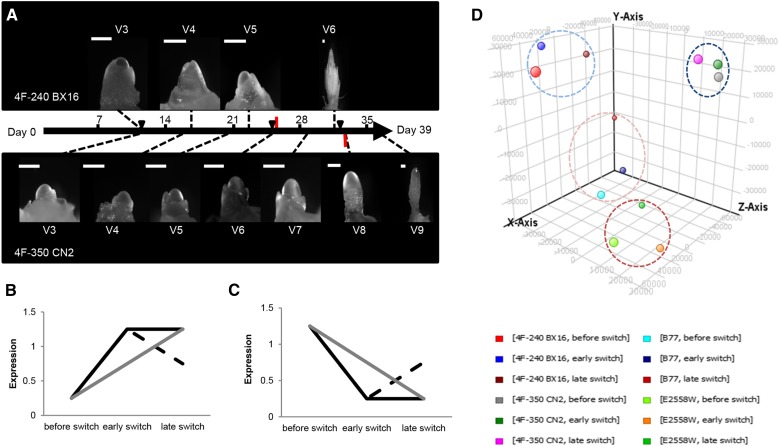
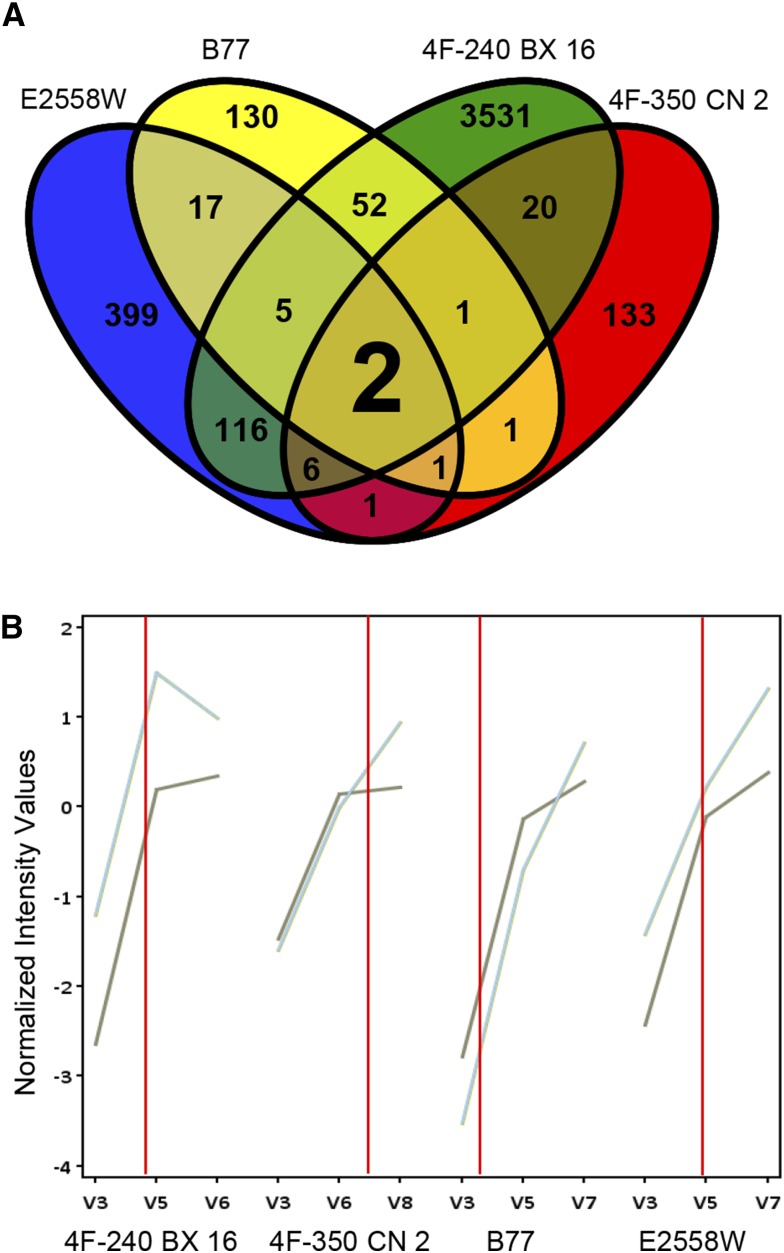
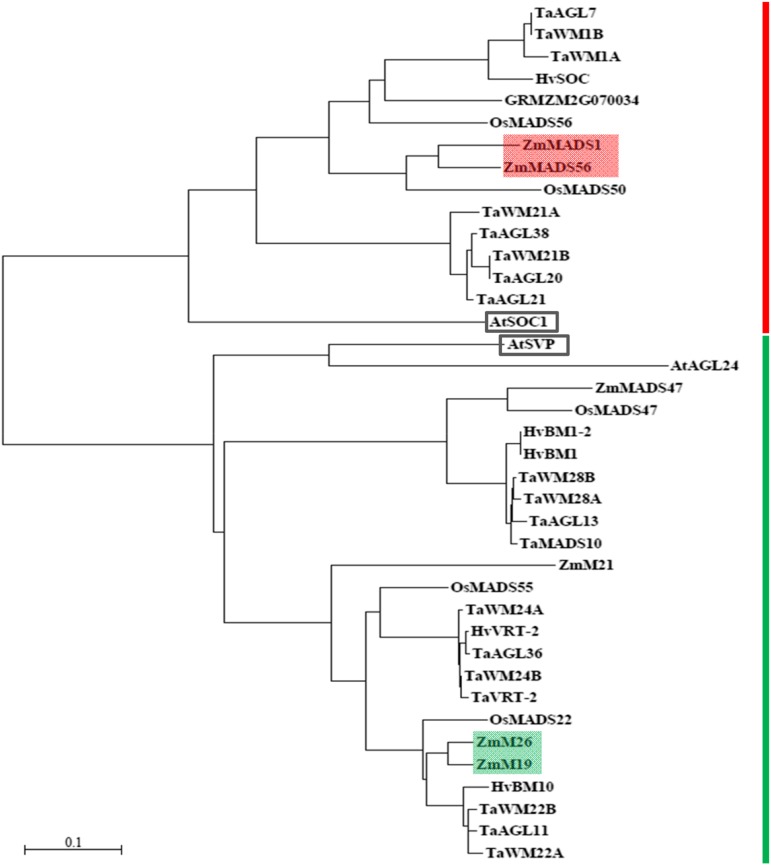
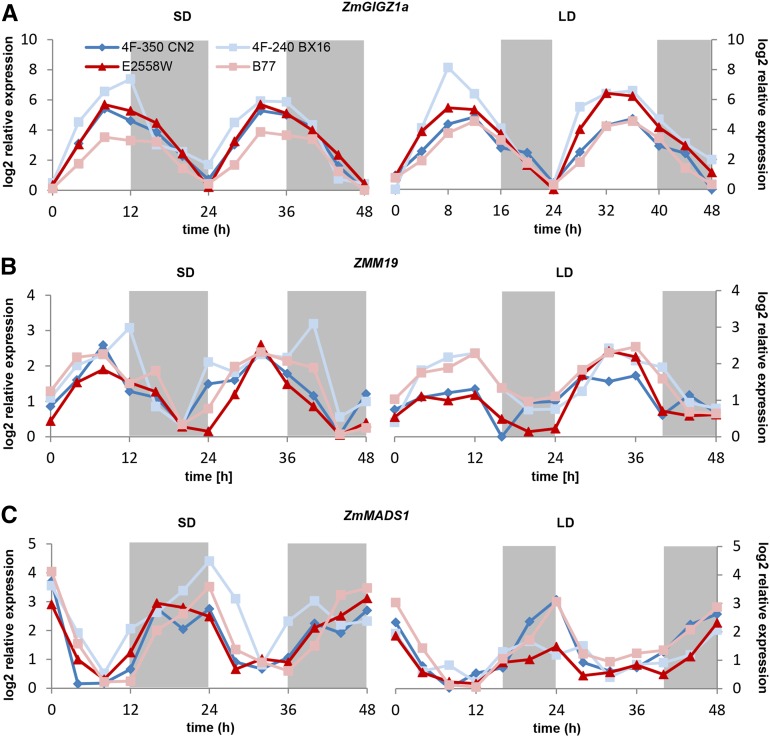
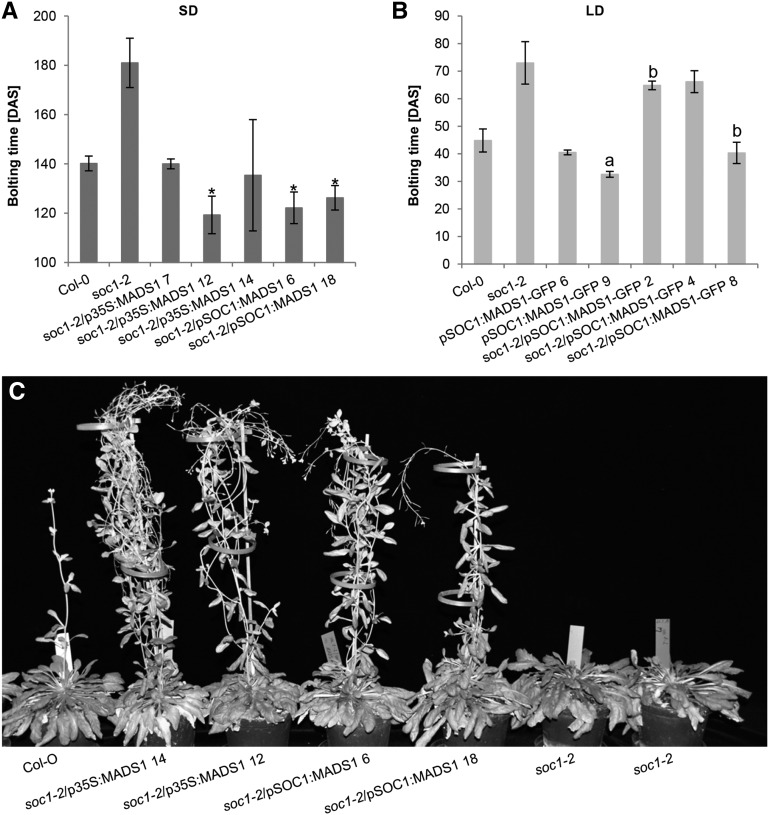
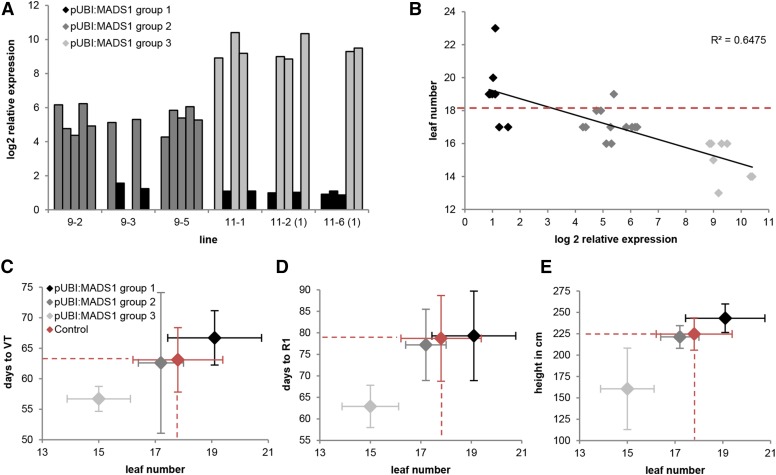
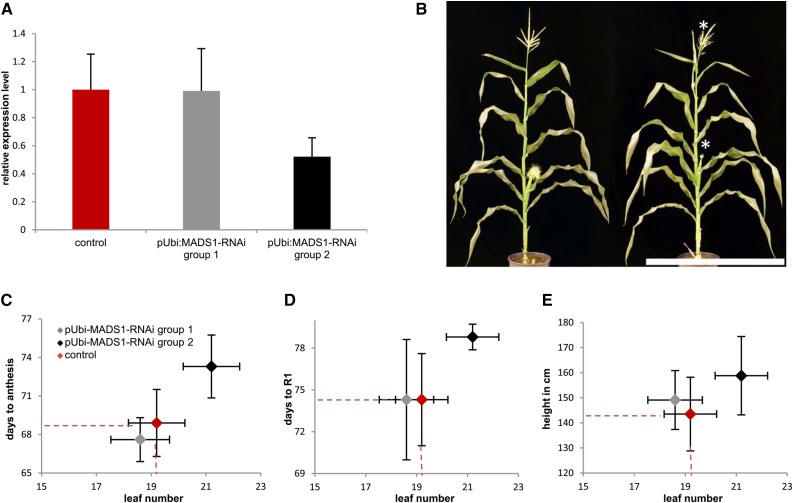
Flowering time (FTi) control is well examined in the long-day plant Arabidopsis (Arabidopsis thaliana), and increasing knowledge is available for the short-day plant rice (Oryza sativa). In contrast, little is known in the day-neutral and agronomically important crop plant maize (Zea mays). To learn more about FTi and to identify novel regulators in this species, we first compared the time points of floral transition of almost 30 maize inbred lines and show that tropical lines exhibit a delay in flowering transition of more than 3 weeks under long-day conditions compared with European flint lines adapted to temperate climate zones. We further analyzed the leaf transcriptomes of four lines that exhibit strong differences in flowering transition to identify new key players of the flowering control network in maize. We found strong differences among regulated genes between these lines and thus assume that the regulation of FTi is very complex in maize. Especially genes encoding MADS box transcriptional regulators are up-regulated in leaves during the meristem transition. ZmMADS1 was selected for functional studies. We demonstrate that it represents a functional ortholog of the central FTi integrator SUPPRESSOR OF OVEREXPRESSION OF CONSTANS1 (SOC1) of Arabidopsis. RNA interference-mediated down-regulation of ZmMADS1 resulted in a delay of FTi in maize, while strong overexpression caused an early-flowering phenotype, indicating its role as a flowering activator. Taken together, we report that ZmMADS1 represents a positive FTi regulator that shares an evolutionarily conserved function with SOC1 and may now serve as an ideal stating point to study the integration and variation of FTi pathways also in maize.


Figures

Figure 1.
Figure 1.
Transcriptome profiling of leaf tissue during the SAM transition from vegetative to reproductive growth in maize. A, Transition of the SAM of the inbred lines 4F-240 BX 16 (top) and 4F-350 CN 2 (bottom) on a time scale of 39 DAS. The transition of the SAM is marked by red bars, and black triangles indicate times of tissue sampling of the upper most fully expanded leaf. Bars = 200 µm. B and C, Expected expression profiles for putative FTi activators (B) and putative FTi repressors (C). Black lines represent expected expression profiles in genotypes with early SAM transition, and gray lines represent those for genotypes with late transition. D, Principal component analysis of transcriptome data from four selected inbred lines (see Table I). Principal component analysis depicts the mean of transcriptome triplicates per time point and line. The x axis shows component 1 (27.72%), the y axis shows component 2 (18.85%), and the z axis shows component 3 (17.2%). Data sets for 4F-350 CN 2 are circled in dark blue, those for 4F-240 BX 16 are circled in light blue, those for E2558W are circled in dark red, and those for B77 are circled in light red.
Figure 2.
Figure 2.
Putative leaf genes involved in regulation of the floral transition of the SAM. A, Genes differentially expressed in the upper most fully expanded leaf comparing developmental stage V3 and each stage at 1 d before transition of the SAM in the maize lines 4F-240 BX 16 (green), 4F-350 CN 2 (red), B77 (yellow), and E2558W (blue). Two genes (ZmMADS1 and ZMM26) are differentially expressed in all lines according to the expected profile shown in Figure 1B. B, Expression profiles of the putative FTi regulators ZmMADS1 (light blue) and ZMM26 (gray). Red lines indicate the SAM transition.
Figure 3.
Figure 3.
Phylogenetic tree of ZmMADS1, ZMM26, and homologous proteins in different plant species (for details, see Supplemental Table S2). The subgroups containing ZmMADS1 and ZMM26 are marked by the red and green bars, respectively. ZmMADS1 and its close homolog ZmMADS56 are shaded in red, and ZMM26 and its close homolog ZMM19 are shaded in green. AtSOC1 and AtSVP are framed in black. The bar represents the number of substitutions per amino acid site.
Figure 4.
Figure 4.
Diurnal regulation of ZmMADS1 and ZMM19 compared with ZmGIGZ1a in SD and LD conditions. Relative expression levels of ZmGIGZ1a (A), ZMM19 (B), and ZmMADS1 (C) are shown in the selected lines 4F-350 CN 2 (dark blue), 4F-240 BX 16 (light blue), E2558W (dark red), and B77 (light red) over a period of 2 d at 4-h intervals under SD (left) and LD (right) conditions. Means of three biological replicates are shown. The relative expression values are log2 transformed; sd values are not depicted (for details, see Supplemental Tables S3–S8). Gray areas indicate dark periods.
Figure 5.
Figure 5.
Complementation analysis of the Arabidopsis soc1 mutant expressing ZmMADS1 in SD and LD conditions. Expression of ZmMADS1 is under the control of the Arabidopsis SOC1 or the cauliflower mosaic virus 35S promoter. A, Expression of ZmMADS1 could rescue the late-flowering phenotype of the soc1-2 mutation under SD conditions. Asterisks mark plant lines showing even reduced bolting time compared with the Columbia-0 (Col-0) wild type (P ≤ 0.05). B, ZmMADS1-GFP fusion constructs were tested for functionality under LD conditions, where complementation is less effective. Plants significantly different from Col-0 (P ≤ 0.05) are marked with a, and plants significantly different from soc1-2 (P ≤ 0.05) are marked with b (n = 2–7); mean values are indicated, and error bars depict sd. C, Comparison of growth behavior/plant architecture of Col-0, soc1-2, and selected complementation lines as indicated. All plants grew for a period of 148 d under SD conditions.
Figure 6.
Figure 6.
Characterization of transgenic maize plants overexpressing ZmMADS1 (MADS1) using a ubiquitin promoter (pUBI). A, Relative expression levels of five T1 progeny plants of six independent transgenic lines quantified by qRT-PCR. Log2 expression values were set in relation to the average expression level of ZmMADS1 in eight control plants. Based on log2 relative expression values (log2 REV), plants were clustered into group 1 (log2 REV < 3.3), group 2 (3.3 < log2 REV < 6.6), and group 3 (6.6 < log2 REV). B, Correlation of leaf number and log2 REV of relative ZmMADS1 transcript levels of individual plants of groups 1 to 3 (A). Regression line, correlation coefficients (R), and coefficients of determination (R2) are indicated. The red dashed line indicates the mean value of eight control plants. C to E, Correlations between leaf number and time to reach developmental stage VT (C) or R1 (D) as well as plant height (E) of ZmMADS1 overexpression plants. VT represents the last vegetative stage at which all tassels are no longer enclosed by the upper leaf. R1 represents the stage at which the silks start to emerge. Mean and sd of total leaf number are indicated on the x axis and those of the second trait on the y axis. Mean values of the control group are projected as dashed lines toward the axis. Colors show expression levels of group 1 (black), group 2 (dark gray), group 3 (light gray), and control (red) plants.
Figure 7.
Figure 7.
Characterization of RNAi transgenic maize plants with down-regulated ZmMADS1 (MADS1) expression levels using a ubiquitin promoter (pUBI). A, Relative expression levels of ZmMADS1 in two transgenic groups and a wild-type control group quantified by qRT-PCR (control group, n = 12; group 1, n = 9; and group 2, n = 14). Group 1 showed ZmMADS1 expression levels comparable to wild-type plants. Samples were collected in the morning, when control plants showed maximum expression levels. B, Representative image of segregating wild-type (left) and transgenic progeny (right) plants. Delayed development of tassels and silks (right) compared with the control (left) is indicated by asterisks. Bar = 50 cm. C to E, Correlations between leaf number and time to reach developmental stages of anthesis (C) and R1 (D) and plant height (E) compared between control and the two RNAi plant groups. Means and sd of total leaf number are indicated on the x axis and those of the second trait on the y axis. Mean values of the control group are projected as dashed lines toward the axis. Colors show expression levels of group 1 (gray), group 2 (black), and control (red) plants.

References

    1. Abe M, Kobayashi Y, Yamamoto S, Daimon Y, Yamaguchi A, Ikeda Y, Ichinoki H, Notaguchi M, Goto K, Araki T (2005) FD, a bZIP protein mediating signals from the floral pathway integrator FT at the shoot apex. Science 309: 1052–1056 - PubMed
    1. Abendroth LJ, Elmore RW, Boyer MJ, Marlay SK (2011) Corn Growth and Development. Iowa State University Extension, Ames, IA
    1. Amasino R. (2004) Vernalization, competence, and the epigenetic memory of winter. Plant Cell 16: 2553–2559 - PMC - PubMed
    1. Andrés F, Porri A, Torti S, Mateos J, Romera-Branchat M, García-Martínez JL, Fornara F, Gregis V, Kater MM, Coupland G (2014) SHORT VEGETATIVE PHASE reduces gibberellin biosynthesis at the Arabidopsis shoot apex to regulate the floral transition. Proc Natl Acad Sci USA 111: E2760–E2769 - PMC - PubMed
    1. Aukerman MJ, Sakai H (2003) Regulation of flowering time and floral organ identity by a microRNA and its APETALA2-like target genes. Plant Cell 15: 2730–2741 - PMC - PubMed

Publication types

MeSH terms