. 2017 Apr;22(4):585-594.
doi: 10.1038/mp.2016.102. Epub 2016 Jul 26.

Unexpected global impact of VTA dopamine neuron activation as measured by opto-fMRI

Affiliations

Unexpected global impact of VTA dopamine neuron activation as measured by opto-fMRI

S Lohani et al. Mol Psychiatry. 2017 Apr.

Abstract

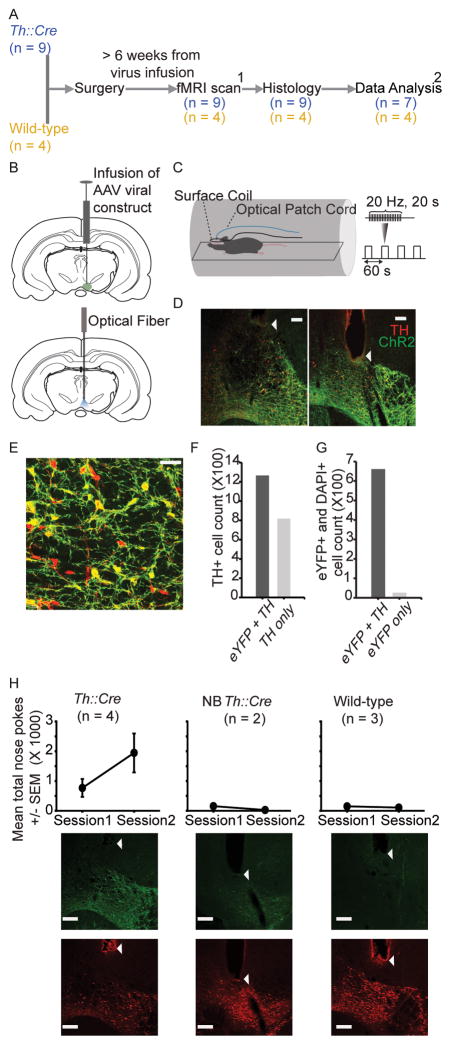
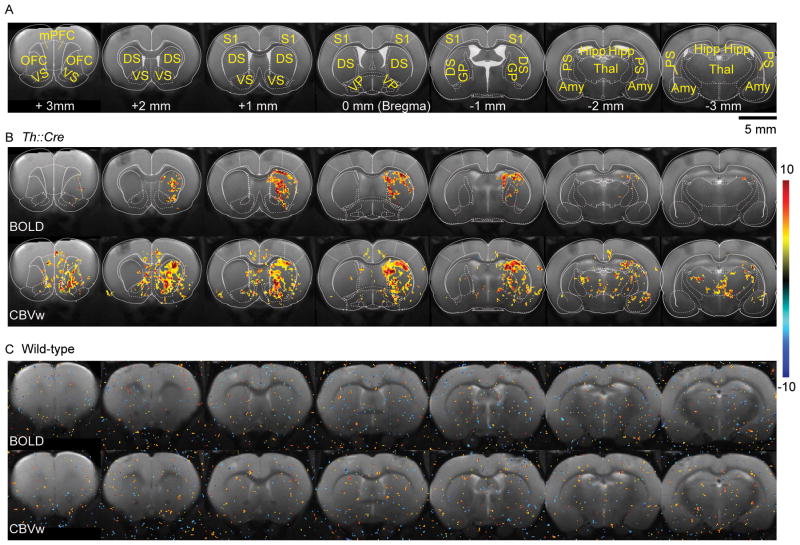
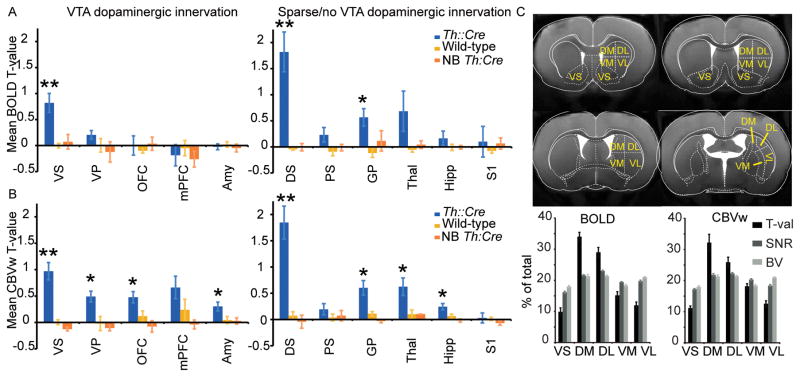
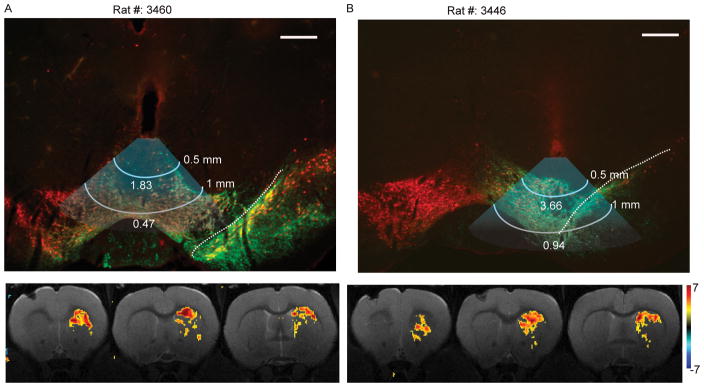
Dopamine neurons in the ventral tegmental area (VTA) are strongly implicated in cognitive and affective processing as well as in psychiatric disorders, including schizophrenia, depression, attention-deficit hyperactivity disorder and substance abuse disorders. In human studies, dopamine-related functions are routinely assessed using functional magnetic resonance imaging (fMRI) measures of blood oxygenation-level-dependent (BOLD) signals during the performance of dopamine-dependent tasks. There is, however, a critical void in our knowledge about whether and how activation of VTA dopamine neurons specifically influences regional or global fMRI signals. Here, we used optogenetics in Th::Cre rats to selectively stimulate VTA dopamine neurons while simultaneously measuring global hemodynamic changes using BOLD and cerebral blood volume-weighted (CBVw) fMRI. Phasic activation of VTA dopamine neurons increased BOLD and CBVw fMRI signals in VTA-innervated limbic regions, including the ventral striatum (nucleus accumbens). Surprisingly, basal ganglia regions that receive sparse or no VTA dopaminergic innervation, including the dorsal striatum and the globus pallidus, were also activated. In fact, the most prominent fMRI signal increase in the forebrain was observed in the dorsal striatum that is not traditionally associated with VTA dopamine neurotransmission. These data establish causation between phasic activation of VTA dopamine neurons and global fMRI signals. They further suggest that mesolimbic and non-limbic basal ganglia dopamine circuits are functionally connected and thus provide a potential novel framework for understanding dopamine-dependent functions and interpreting data obtained from human fMRI studies.


Conflict of interest statement

Conflict of Interest

Authors declare no conflict of interest.

Figures

Figure 1
Figure 1
Experimental design, histology and behavior. (A) Experimental design. A subset of rats (6 Th::Cre and 3 wild-type) were characterized behaviorally in an intra-cranial self-stimulation (ICSS) task prior to fMRI scanning. Two Th::Cre rats were excluded from the Th::Cre group fMRI data analysis due to low levels of ChR2 integration in VTA and weak expression of ICSS behavior (also see Figure 1H). (B) Schematic demonstrating infusion of AAV viral construct and implantation of an optical fiber in right VTA. (C) fMRI setup. Each fMRI run consisted of 5 s of baseline followed by 4 optical stimulation trials. In each trial, blue laser pulses were delivered to VTA at 20 Hz (5 ms width, power = 2.5 – 7.5 mW, 473 nm) for 20 s, followed by 40 s of rest. (D) Representative histological images from two Th::Cre rats showing ChR2 expression and implanted fiber tips (white arrowheads) in VTA. Scale bar: 130 μm. (E) Expression of ChR2-eYFP (green) in TH+ (red) neurons in VTA of Th::Cre rats. Scale bar: 40 μm. (F) Quantification of TH+ cell bodies (n = 2083 cells from 7 Th::Cre rats) that also express eYFP in VTA (measure of sensitivity of ChR2-eYFP expression). (G) Quantification of VTA cell bodies immunopositive for both eYFP and DAPI (n = 687 cells from 4 Th::Cre rats) that also express TH in VTA (measure of specificity of ChR2-eYFP expression). (H) (Top) ICSS behavior. Rats executed nose pokes to receive optical VTA stimulation (20 Hz, 5 ms pulse width, power = 5 – 8 mW, 473 nm). The average total number of nose pokes executed per session by Th::Cre, “behaviorally non-responsive” Th::Cre (NB Th::Cre) and wild-type rats is shown. (Bottom) Representative histological images show a differential amount of ChR2 (green fluorescence, top row) expression directly below the optical fiber tips in VTA of Th::Cre, NB Th::Cre, and wild-type rats. The bottom row shows TH expression in images acquired in the same field of view as the ChR2 images (top row). All images corresponding to a particular fluorescence stain (ChR2 or TH) were acquired using the same parameters, and white arrowheads point to optical fiber tips. Scale bars: 200 μm.
Figure 2
Figure 2
Group activation maps. (A) Atlas figures overlaid on structural images to delineate regions-of-interest (ROIs) (mPFC = medial prefrontal cortex; OFC = orbitofrontal cortex; DS = dorsal striatum; VS = ventral striatum; S1 = primary somatosensory cortex; VP = ventral pallidum; GP = globus pallidus; Hipp = hippocampus; Amy = amygdala; Thal = thalamus; PS = posterior striatum). (B) Statistical t-value maps overlaid on structural images illustrate increased BOLD and CBVw activity in the striatum and other ROIs after optical VTA stimulation in Th::Cre rats (n = 5 for BOLD and n = 6 for CBVw). Note that positive CBVw t-values represent blood volume increases during stimulation. Atlas overlays (same as A) mark the boundaries of ROIs. Voxel-wise and family-wise error correction (cluster size > 28 voxels) thresholds were set to p < 0.025. (See Supplementary Figure 2 for group maps with different thresholds) (C) Wild-type (n = 4 for BOLD and CBVw) rats do not exhibit any increase in BOLD and CBVw activity in the whole brain even at a low threshold (voxel-level p < 0.025 and cluster size > 0 voxels) upon optical VTA stimulation. Color bar indicates t-values. Voxel size: 125 μm × 125 μm × 1 mm.
Figure 3
Figure 3
Ipsilateral ROI analysis (see Supplementary Figure 4 for contralateral ROI analysis). Mean ± SEM t-values for correlation of (A) BOLD and (B) CBVw signal changes within ROIs with predicted hemodynamic response functions. Right hemisphere ROIs were drawn on individual structural images for Th::Cre rats (n = 5 for BOLD and n = 7 for CBVw), NB Th::Cre rats (n = 2 for BOLD and CBVw), and wild-type rats (n = 4 for BOLD and CBVw). Brown-Forsythe ANOVAs yielded significant differences in activation t-values for BOLD in the following ROIs: VS (F(2,8) = 13.569, p = 0.008), DS (F(2,8) = 23.017, p = 0.006), and GP (F(2,8) = 6.843, p = 0.043) and for CBVw in the following structures: VS (F(2,10) = 34.546, p = 0.000), VP (F(2, 10) = 10.625, p = 0.006), OFC (F(2,10) = 7.4555, p = 0.015), amygdala (F(2,10) = 5.489, p = 0.025), DS (F(2, 10) = 29.262, p = 0.000), GP (F(2,10) = 14.061, p = 0.003), thalamus (F(2,10) = 8.131, p = 0.012), and hippocampus (F(2,10) = 8.624, p = 0.007). Post-hoc two sample t-tests resulted in significant differences in BOLD t-values between Th::Cre and wild-type rats in these ROIs: VS (t(7) = 4.376, p = 0.009), DS (t(7) = 4.879, p = 0.008), and GP (t(7) = 3.643, p = 0.012). CBVw t-values were significantly different between Th::Cre and wild-type rats in these ROIs: VS (t(9) = 5.639, p = 0.001), VP (t(9) = 3.013, p = 0.021), OFC (t(9) = 2.460, p = 0.038), amygdala (t(9) = 2.409, p = 0.040), DS (t(9) = 5.472, p = 0.001), GP (t(9) =3.397; p = 0.012), thalamus (t(9) = 2.817, p = 0.022), and hippocampus (t(9) = 2.523, p = 0.033). There was no significant difference between NB Th::Cre and wild-type groups for any ROI. * = p < 0.05, ** = p < 0.01. (C) DS of Th::Cre rats was divided into four quadrants (DM = dorsomedial, DL = dorsolateral, VM = ventromedial, and VL = ventrolateral) as indicated in the anatomical images with overlaid atlas figures (top). BOLD and CBVw t-values, BOLD and CBVw baseline signal-to-noise ratio (SNR), and baseline blood volume (BV) were expressed as percentages of summed total values across the five subdivisions of striatum, including VS (bottom). One-way repeated measures ANOVAs yielded significant differences among sub-divisions of the striatum in relative activation t-values for BOLD (F(4, 16) = 53.067, p = 0.000, n = 5 rats) and CBVw (F(4, 24) = 26.913, p = 0.000, n = 7 rats, Greenhouse-Geisser corrected) contrasts. Repeated measures ANOVAs also resulted in significant differences among striatal subdivisions in relative BV (F(4, 24) = 16.623, p = 0.000, n = 7 rats) and relative SNR for BOLD (F (4, 16) =76.71, p =0.000, n = 5 rats) and CBVw (F(4, 24) = 37.34, p = 0.000, n = 7 rats) contrasts.
Figure 4
Figure 4
Individual histology and activation maps. (Top) Schematics of approximate spread of blue light in the VTA and SN are overlaid on immunohistological images (red: TH, green: ChR2-eYFP) that show optical fiber tips at locations farthest from SN (A) and closest to SN (B). The predicted irradiance values (mW/mm2) calculated using the online irradiance calculator (http://www.stanford.edu/group/dlab/cgi-bin/graph/chart.php) are indicated for distances of 0.5 mm (first white line) and 1 mm (second white line) from the optical fiber tips. Scale bar: 0.5 mm. Dashed white lines mark the approximate boundary between VTA and SN. (Bottom) CBVw t-value statistical maps for two rats (A and B) illustrate individual responses in the striatum to VTA optical stimulation. Voxel-wise and family-wise error correction (cluster size > 19 voxels) thresholds were set to p < 0.01. Color bar: t-values.

References

    1. Koob GF, Volkow ND. Neurocircuitry of addiction. Neuropsychopharmacology. 2010;35(1):217–238. - PMC - PubMed
    1. Everitt BJ, Belin D, Economidou D, Pelloux Y, Dalley JW, Robbins TW. Review. Neural mechanisms underlying the vulnerability to develop compulsive drug-seeking habits and addiction. Philosophical transactions of the Royal Society of London Series B, Biological sciences. 2008;363(1507):3125–3135. - PMC - PubMed
    1. Grace AA. Gating of information flow within the limbic system and the pathophysiology of schizophrenia. Brain research Brain research reviews. 2000;31(2–3):330–341. - PubMed
    1. Nestler EJ, Carlezon WA., Jr The Mesolimbic Dopamine Reward Circuit in Depression. Biological Psychiatry. 2006;59(12):1151–1159. - PubMed
    1. Polter AM, Kauer JA. Stress and VTA synapses: implications for addiction and depression. Eur J Neurosci. 2014;39(7):1179–1188. - PMC - PubMed

Publication types