. 2016 Aug 9;113(32):9021-6.
doi: 10.1073/pnas.1603817113. Epub 2016 Jul 25.

Complete in vitro generation of fertile oocytes from mouse primordial germ cells

Affiliations

Complete in vitro generation of fertile oocytes from mouse primordial germ cells

Kanako Morohaku et al. Proc Natl Acad Sci U S A. .

Abstract

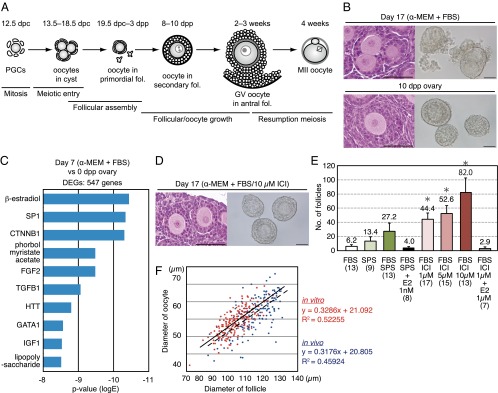
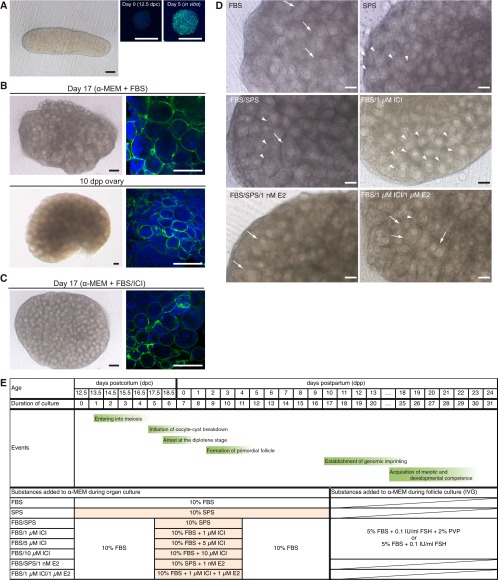
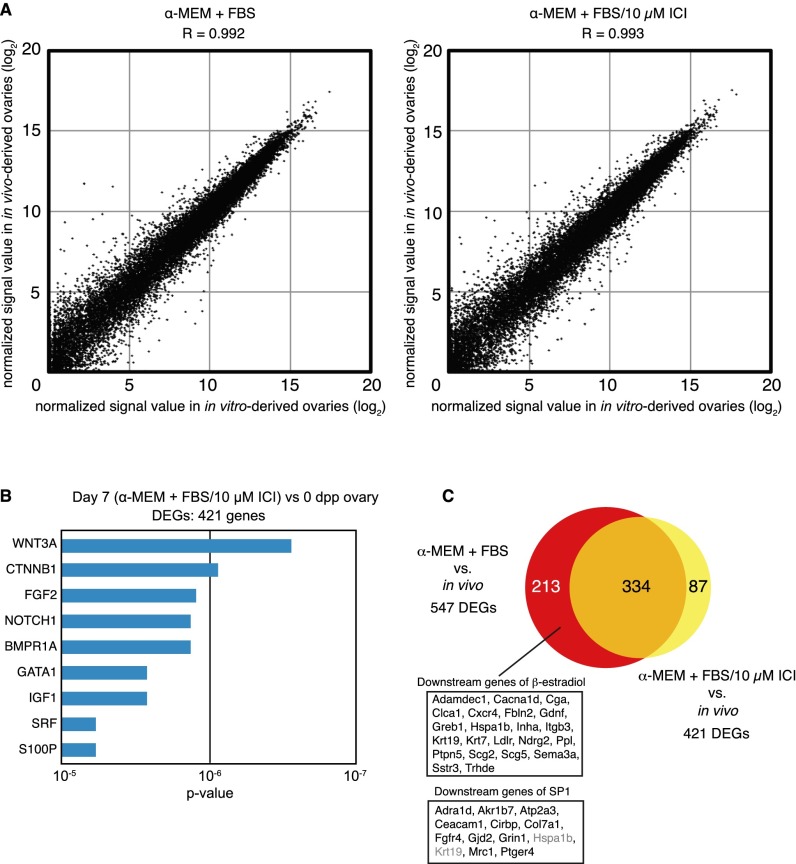
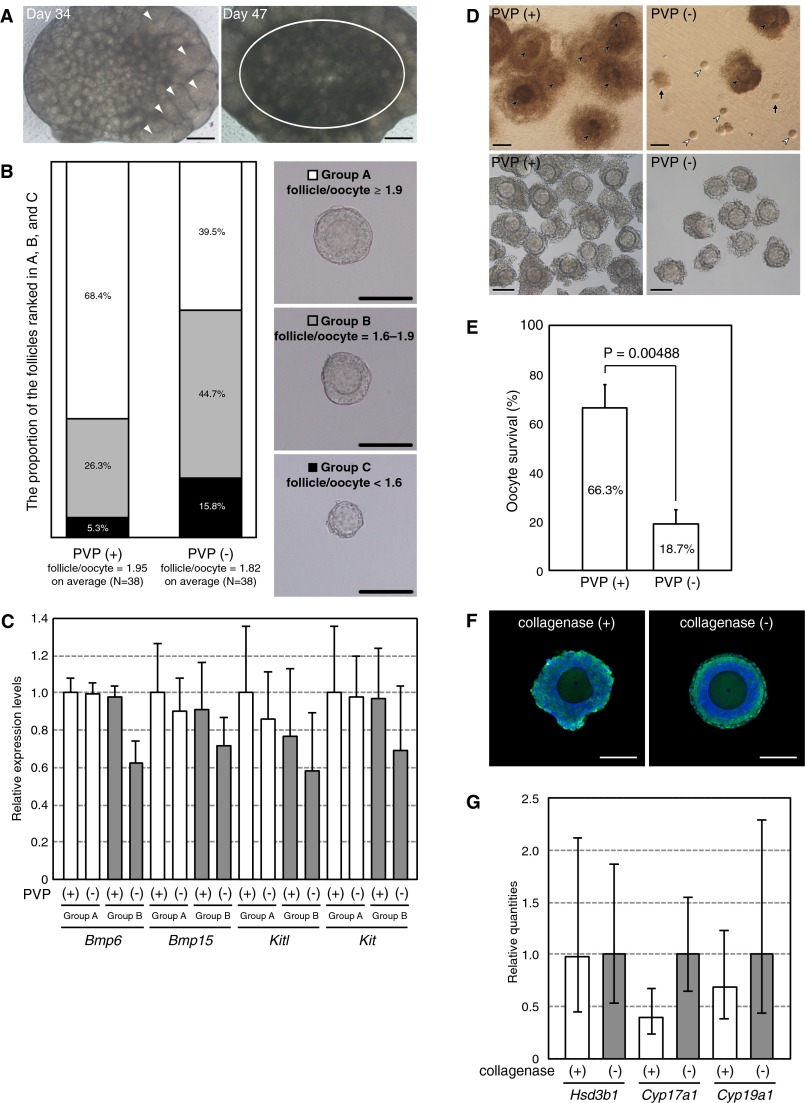
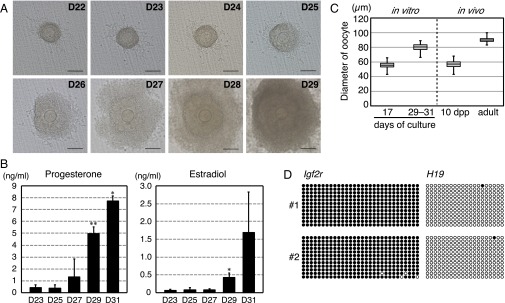
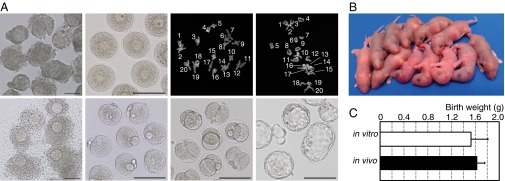
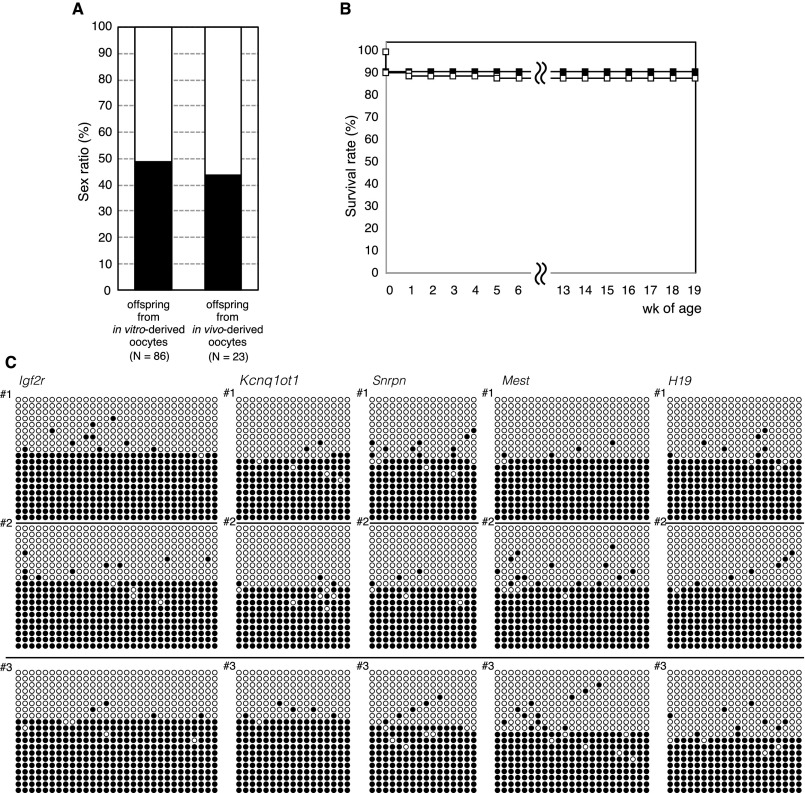
Reconstituting gametogenesis in vitro is a key goal for reproductive biology and regenerative medicine. Successful in vitro reconstitution of primordial germ cells and spermatogenesis has recently had a significant effect in the field. However, recapitulation of oogenesis in vitro remains unachieved. Here we demonstrate the first reconstitution, to our knowledge, of the entire process of mammalian oogenesis in vitro from primordial germ cells, using an estrogen-receptor antagonist that promotes normal follicle formation, which in turn is crucial for supporting oocyte growth. The fundamental events in oogenesis (i.e., meiosis, oocyte growth, and genomic imprinting) were reproduced in the culture system. The most rigorous evidence of the recapitulation of oogenesis was the birth of fertile offspring, with a maximum of seven pups obtained from a cultured gonad. Moreover, cryopreserved gonads yielded functional oocytes and offspring in this culture system. Thus, our in vitro system will enable both innovative approaches for a deeper understanding of oogenesis and a new avenue to create and preserve female germ cells.

Keywords: follicle formation; in vitro; oocytes; oogenesis; primordial germ cells.


Conflict of interest statement

The authors declare no conflict of interest.

Figures

Fig. 1.
Fig. 1.
Refinement of follicular (fol) assembly in cultured gonads. (A) Schematic representation of oogenesis and crucial events that require reconstitution in vitro. (B) Histological section (Left) and isolated follicles (Right) from the ovary cultured for 17 d in α-MEM + FBS or the 10-dpp ovary. (Scale bars, 50 µm.) (C) Predicted upstream transcriptional regulators of 547 DEGs in ovaries cultured with α-MEM + FBS. (D) Histological section (Left) and isolated follicles (Right) from the ovary cultured for 17 d with α-MEM + FBS/10 µM ICI. (Scale bars, 50 µm.) (E) Mean number of secondary follicles successfully isolated from each ovary under various culture conditions. Significant differences (*P < 1.0E−3) in the number of isolated secondary follicles were determined by the Bonferroni multiple-comparison correction. Error bars indicate SDs. Numbers in parentheses indicate the number of ovaries examined. (F) A scatter plot showing the ratio of oocyte/follicle diameters from ovaries cultured with α-MEM + FBS/10 µM ICI (red) and those of in vivo origin (blue). Regression lines of in vitro-derived (solid) and in vivo-derived (dashed) ovaries are shown with the slope, intercept, and correlation coefficient. The slopes of the regressions were not significantly different.
Fig. S1.
Fig. S1.
Refinement of culture condition for follicular assembly. (A) Gonad derived from a mouse embryo at 12.5 dpc (Left). (Black scale bar, 100 μm; white scale bars, 20 μm.) Immunostaining for SCP3 (green) in female germ cells derived from an ovary on day 0 (Center) and day 5 of culture without the mesonephros (Right). Nuclei were stained with 4′,6-diamidino-2-pheylindole (DAPI; blue). (B) Ovary cultured for 17 d (α-MEM + FBS) and the ovary at 10 dpp (control). Shown are bright-field images (Left) and laminin immunostaining (green) and DAPI staining (blue) of the ovary (Right). (Black scale bars, 100 μm; white scale bars, 50 μm.) (C) Ovary cultured for 17 d (α-MEM + FBS/10 μM ICI). (Black scale bars, 100 μm; white scale bars, 50 μm.) (D) Ovary cultured in the medium indicated. The parts where the border of follicles was not clear and multioocytes were contained in a follicle were indicated by white arrows. The parts where each follicle was clearly visible with a single oocyte were indicated by white arrowheads. Note that the addition of ICI drastically improved the formation of follicles with single oocytes. In contrast, the addition of estradiol disturbed such follicular formation. (Scale bars, 100 μm.) (E) Oogenetic events and examined conditions for the culture. α-MEM was used as the basal medium. The effects of supplementation of FBS, SPS, estradiol (E2), ICI, and PVP were examined. On day 17 of culture, secondary follicles were isolated from the in vitro-derived ovaries and subjected to IVG. On day 20 of culture, follicles were treated with collagenase and subjected to further IVG.
Fig. S2.
Fig. S2.
Correlation of RNA-seq analysis for in vitro and in vivo-derived ovaries. (A) Correlation of all genes identified by RNA-seq that were expressed in in vitro-derived ovaries on day 7 cultured with α-MEM + FBS (Left) or α-MEM + FBS/10 μM ICI (Right) and in ovaries of 0-d-old mice. (B) Ingenuity pathway analysis of the 421 genes differentially expressed in the cultured ovaries (α-MEM + FBS/10 μM ICI). (C) Venn diagram showing a comparison of DEGs in each culture condition indicated. Among 213 genes specifically listed as DEGs in the cultured ovaries (α-MEM + FBS), 22 and 13 genes of β-estradiol– and SP1-downstream targets, respectively, were identified; these could be responsible for abnormal follicle formation. Genes in gray in the SP1 downstream targets are also β-estradiol downstream targets.
Fig. S3.
Fig. S3.
Optimization of in vitro follicle growth. (A) An ovary cultured for 34 d (Left) and 47 d (Right). Prolonged culture of a whole ovary resulted in limited follicle growth (only a few follicles formed antrums; arrowhead) and large-scale follicular degeneration (circle). (Scale bars, 200 μm.) (B) Effect of PVP during follicle culture. On day 20 of culture, follicles were classified into groups A, B, and C, depending on the ratio of the follicle/oocyte diameter, which was in the range of ≥1.9 (Upper), 1.6–1.9 (Middle), and <1.6 (Lower), respectively. The proportion of the follicles ranked in groups A, B, and C is indicated with white, gray, and black boxes, respectively. The ratio of the follicle/oocyte diameter was much greater in follicles cultured with PVP [average ratio; PVP (+) vs. PVP (−); 1.95 vs. 1.82; P = 0.0049]. Before IVG, no morphological differences were found in the examined follicles [average ratio; PVP (+) vs. PVP (−); 1.78 vs. 1.78; P = 0.9243]. (Scale bars, 100 μm.) (C) Relative expression levels of genes involved in follicle growth on day 20 of culture. Expression levels were measured by qRT-PCR, using cDNA derived from follicles cultured with or without PVP. White and gray bars indicate groups A and B, respectively. Tbp was used as an internal control. Error bars indicate the SD (n = 3). (D) Morphology of follicles (Upper) and COCs (Lower) developed in medium with (Left) or without PVP (Right) on day 33 of culture. Closed arrowheads indicate the oocytes within follicle; open arrowheads represent denuded oocytes. The arrows indicate the remnants of follicles left on the insert membrane. [Scale bars, 200 μm (Upper) and 100 μm (Lower).] (E) Comparison of the viability of oocytes after the 33-d culture period. Oocytes with firmly attached granulosa (cumulus) cells over at least half of their surface and showing no signs of degeneration were considered as surviving. Data from three independent experiments are shown as means ± SD. The total numbers of follicles included after the collagenase treatment were 524 and 519 in medium with or without PVP, respectively. The Student’s t test was used for the comparison between two groups after arcsine transformation of the percentage data. (F) Evidence for the growth of steroidogenic cells during follicle culture on day 26 of culture. Immunostaining of HSD3B in the follicles with (Left) or without (Right) collagenase treatment. (Scale bars, 100 μm.) (G) Relative quantities (RQs) of genes involved in steroidogenesis on day 26 of culture. RQ was measured by qRT-PCR and ΔΔ Ct method, using cDNAs derived from the follicles treated with (white bars) or without (gray bars) collagenase. Tbp was used as an internal control. Error bars indicate the RQ max and RQ min (n = 4).
Fig. 2.
Fig. 2.
In vitro growth of oocytes and follicles. (A) A representative follicle cultured on a Transwell-COL membrane on days 22–29 of culture. (Scale bars, 100 μm.) (B) Concentration of progesterone (Left) and estradiol (Right) in the medium. Steroid hormones were measured by an enzyme-linked immunoassay during follicular culture. Significant increases in the steroid concentration in the medium were determined by t tests. Asterisks indicate a significant increase in the steroid concentration compared with that measured 2 d before (*P < 0.05, **P < 0.01). Error bars indicate SD (n = 4). (C) Oocyte growth in IVG culture. The box plot shows the diameters of oocytes on the days that IVG started (day 17) and ended (day 29–33), the diameters of oocytes in secondary follicles at 10 dpp, and the diameter of mature oocytes derived from adult mice. (D) DNA methylation imprints in the in vitro-derived GV oocytes at the Igf2r and H19 loci, which are methylated specifically in oogenesis and spermatogenesis, respectively. “#1” and “#2” represent two independent samples. Black and white circles indicate methylated and nonmethylated cytosines at CpG sites in the analyzed imprinted regions, respectively.
Fig. 3.
Fig. 3.
Developmental competence of oocytes produced from PGCs in vitro. (A) Maturation, resumption of meiosis, fertilization, and embryonic development in vitro. Shown are COCs obtained from follicles on day 29 after the beginning of organ culture (Upper Left); denuded fully grown oocytes at the GV stage after follicular culture (Upper Middle Left); the karyotype of in vitro-derived oocytes at the first (Upper Middle Right) and second (Upper Right) meiotic stage with the number of chiasmata and 20 pairs of homologous chromosomes, respectively; cumulus cell-enclosed in vitro-derived oocytes at the MII stage (Lower Left); normally fertilized eggs with two pronuclei and the second polar body (Lower Middle Left), indicating the completion of meiosis after fertilization; and two-cell (Lower Middle Right) and blastocyst-stage (Lower Middle Right) embryos. (Scale bars, 100 µm.) (B) Pups from in vitro-derived oocytes. (C) Birth weights of the offspring. White and black bars indicate the mean body weights of offspring (1.53 ± 0.282 g vs. 1.63 ± 0.128 g) from in vitro-derived oocytes (n = 68) and in vivo-derived oocytes (n = 23), respectively. Error bars indicate SD. No significant difference in body weights between the groups was observed (t test).
Fig. S4.
Fig. S4.
Evaluation of pups from in vitro-derived oocytes. (A) Sex ratio of offspring. Black and white bars indicate the frequency of male and female offspring, respectively. The χ2 test was used for statistical analysis. (B) Proportion of surviving offspring from in vitro-derived (white squares, n = 86) and in vivo-derived (black squares, n = 23) oocytes. Offspring were weaned at around 4 wk of age. Few offspring were lost from 1 wk of age onward. The oldest offspring were 85 wk old on December 21, 2015. Offspring grew well and exhibited a healthy appearance. Offspring from in vivo-derived oocytes were produced from fully grown GV oocytes of adult mice by maturation, in vitro fertilization, and embryo transfer as a control. (C) DNA methylation imprints in offspring from in vitro-derived oocytes (#1 and #2, two individuals) and in vivo-derived oocyte (#3) loci indicated. Black and white circles indicate methylated and nonmethylated cytosines at CpG sites in the analyzed imprinted regions, respectively.

Comment in

References

    1. Shen W, et al. In vitro development of mouse fetal germ cells into mature oocytes. Reproduction. 2007;134(2):223–231. - PubMed
    1. Zhang ZP, et al. Growth of mouse oocytes to maturity from premeiotic germ cells in vitro. PLoS One. 2012;7(7):e41771. - PMC - PubMed
    1. Eppig JJ, O’Brien MJ. Development in vitro of mouse oocytes from primordial follicles. Biol Reprod. 1996;54(1):197–207. - PubMed
    1. O’Brien MJ, Pendola JK, Eppig JJ. A revised protocol for in vitro development of mouse oocytes from primordial follicles dramatically improves their developmental competence. Biol Reprod. 2003;68(5):1682–1686. - PubMed
    1. Morohaku K, Hirao Y, Obata Y. Developmental competence of oocytes grown in vitro: Has it peaked already? J Reprod Dev. 2016;62(1):1–5. - PMC - PubMed

Publication types