. 2016 Aug 9;113(32):8963-8.
doi: 10.1073/pnas.1600826113. Epub 2016 Jul 25.

Reduced nighttime transpiration is a relevant breeding target for high water-use efficiency in grapevine

Affiliations

Reduced nighttime transpiration is a relevant breeding target for high water-use efficiency in grapevine

Aude Coupel-Ledru et al. Proc Natl Acad Sci U S A. .

Abstract

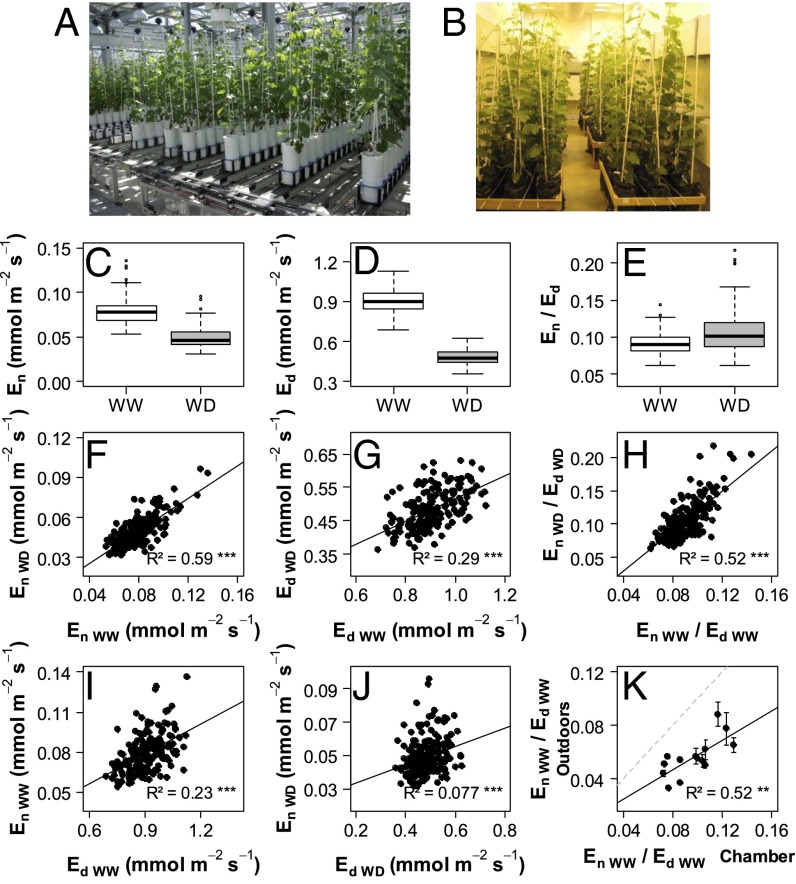
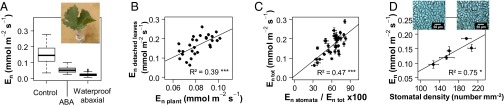
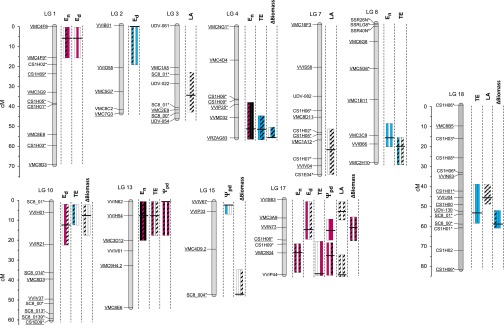
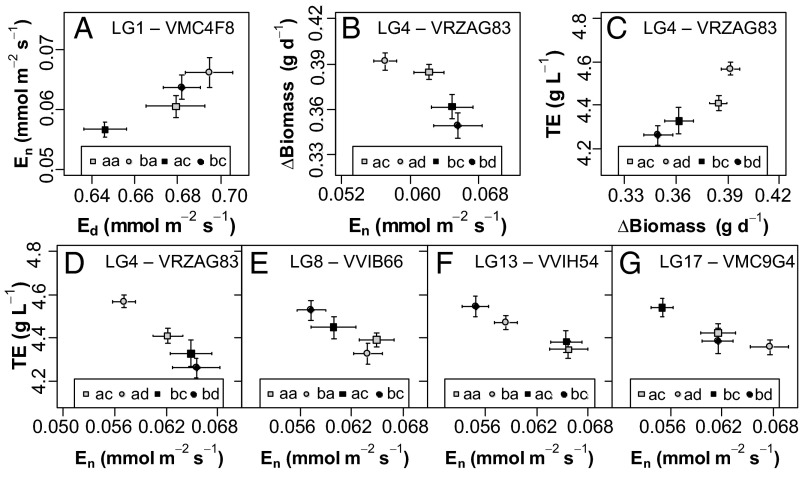
Increasing water scarcity challenges crop sustainability in many regions. As a consequence, the enhancement of transpiration efficiency (TE)-that is, the biomass produced per unit of water transpired-has become crucial in breeding programs. This could be achieved by reducing plant transpiration through a better closure of the stomatal pores at the leaf surface. However, this strategy generally also lowers growth, as stomatal opening is necessary for the capture of atmospheric CO2 that feeds daytime photosynthesis. Here, we considered the reduction in transpiration rate at night (En) as a possible strategy to limit water use without altering growth. For this purpose, we carried out a genetic analysis for En and TE in grapevine, a major crop in drought-prone areas. Using recently developed phenotyping facilities, potted plants of a cross between Syrah and Grenache cultivars were screened for 2 y under well-watered and moderate soil water deficit scenarios. High genetic variability was found for En under both scenarios and was primarily associated with residual diffusion through the stomata. Five quantitative trait loci (QTLs) were detected that underlay genetic variability in En Interestingly, four of them colocalized with QTLs for TE. Moreover, genotypes with favorable alleles on these common QTLs exhibited reduced En without altered growth. These results demonstrate the interest of breeding grapevine for lower water loss at night and pave the way to breeding other crops with this underexploited trait for higher TE.

Keywords: QTL; growth; night transpiration; stomata; transpiration efficiency.


Conflict of interest statement

The authors declare no conflict of interest.

Figures

Fig. 1.
Fig. 1.
Genetic variability in transpiration rates measured in the nighttime (En) and daytime (Ed) on potted plants of an S×G population. Offspring and parents (188 genotypes) were grown and subjected to either WW or WD conditions on a greenhouse phenotyping platform (A) during two experiments in 2012 and 2013. Plants were transferred to a controlled environment chamber (B) to determine En and Ed. (C–E) Boxplots of the genotypic values (BLUPs for the whole dataset merging 2012 and 2013) for En, Ed, and En/Ed under WW and WD conditions. (F–H) Comparisons of genotypic values between WW and WD scenarios. (I and J) Correlation between daytime and nighttime genotypic values of transpiration rates under WW (I) and WD (J) conditions. (K) Comparison of genotypic values of En/Ed between controlled (x axis) and outdoor (y axis) conditions for a subset of 14 genotypes. Pearson’s determination coefficients (R2) are indicated with their significance level as follows: **P < 0.01, ***P < 0.001. Regression lines are represented in black and bisecting lines in dotted gray. Means and SD of genotypic values are presented in SI Appendix, Table S1 together with effects of genotype, water scenario, and year.
Fig. 2.
Fig. 2.
Genetic variability in nighttime transpiration (En) measured on detached leaves subjected to different treatments for a subset of genotypes selected in the S×G population. (A) Detached leaves fed with control, artificial sap; effect of 128 mmol m−3 (+) ABA added to the solution (boxplots for 28 genotypes) and effect of waterproofing of the abaxial side (boxplot for 15 genotypes). The Inset picture shows a representative leaf in solution. (B) Comparison for 28 genotypes between En measured on detached leaves fed with control, artificial sap (mean for n = 5 leaves per genotype, y axis) and genotypic En values measured on WW whole plants (2013 experiment, x axis). (C) Comparison between total En measured on detached leaves fed with artificial sap (En tot) and estimate of stomatal contribution to En calculated as the percentage reduction in En induced by ABA (En stomata) relative to En tot for 28 genotypes. (D) Correlation between En measured on detached leaves fed with artificial sap and stomatal density for five genotypes; pictures show imprints of the abaxial leaf surface for two genotypes with low (Left) or high (Right) stomatal density. (Scale bar, 60 µm.) In C and D, mean ± SE for five leaves per genotype.
Fig. 3.
Fig. 3.
Localization on the S×G linkage map of the most important QTLs detected for transpiration rates during the nighttime (En) and daytime (Ed), transpiration efficiency (TE), predawn water potential (Ψpd), shoot growth (ΔBiomass), and leaf area (LA). Each QTL is represented by three bars, either filled when significant in 2012 (left), 2013 (middle), and 2012+2013 (right) or left empty if not, and colored in blue or red when detected under WW or WD conditions or filled with black when detected under both conditions or else hatched when detected with the multiscenario dataset (WW+WD). Central mark in the bars indicates the position L where maximum logarithm of odds (LOD) score was obtained, and bar length represents the confidence region for the QTL (where LOD score exceeded maximum LOD – 1). When several QTLs were detected for the same trait with different positions L but with overlapping confidence regions, only one bar was figured with L corresponding to the highest LOD score; when the length of their confidence regions differed, the shorter one was figured. Fully informative markers (segregating in four allelic classes) are underlined. The longest marker names have been truncated and suffixed * (29). Complete description of the QTLs is provided in SI Appendix, Table S5.
Fig. 4.
Fig. 4.
Relationships between allelic values for transpiration rates during the nighttime (En) and daytime (Ed), growth (ΔBiomass), and transpiration efficiency (TE) at the main QTL colocalizations. QTLs are identified in plots by the name and LG number of the nearest marker. Pairs of letters in the legends indicate the different allelic combinations on markers associated to each QTL, with different letters when alleles differed and the first and second letters corresponding to alleles, respectively, inherited from Syrah and Grenache parents. (A) Biplot of allelic values for En vs. Ed at the VMC4F8 marker on LG 1. (B) Biplot of allelic values for ΔBiomass vs. En at the VRZAG83 marker on LG 4. (C) Biplot of allelic values for TE vs. ΔBiomass at the VRZAG83 marker on LG 4. (D–G) Biplots of allelic values for TE vs. En at the VRZAG83 marker on LG 4 (D), at the VVIB66 marker on LG 8 (E), at the VVIH54 marker on LG 13 (F), and at the VMC9G4 marker on LG 17 (G). Means and SEs of allelic values are calculated as BLUPs from the whole dataset. Separate analyses for each water scenario are detailed in SI Appendix, Figs. S1, S2, and S5.

References

    1. Intergovernmental Panel on Climate Change . In: Climate Change 2013: The Physical Science Basis. Stocker TF, et al., editors. Cambridge Univ Press; New York: 2013.
    1. Condon AG, Richards RA, Rebetzke GJ, Farquhar GD. Breeding for high water-use efficiency. J Exp Bot. 2004;55(407):2447–2460. - PubMed
    1. Lawson T, Blatt MR. Stomatal size, speed, and responsiveness impact on photosynthesis and water use efficiency. Plant Physiol. 2014;164(4):1556–1570. - PMC - PubMed
    1. Hetherington AM, Woodward FI. The role of stomata in sensing and driving environmental change. Nature. 2003;424(6951):901–908. - PubMed
    1. Bacon MA. What Is Water-Use Efficiency? Water Use Efficiency in Plant Biology. Blackwell; Oxford: 2004. pp. 27–41.

Publication types