. 2016 Aug 9;113(32):8933-8.
doi: 10.1073/pnas.1521544113. Epub 2016 Jul 25.

Earth's oxygen cycle and the evolution of animal life

Affiliations

Earth's oxygen cycle and the evolution of animal life

Christopher T Reinhard et al. Proc Natl Acad Sci U S A. .

Abstract

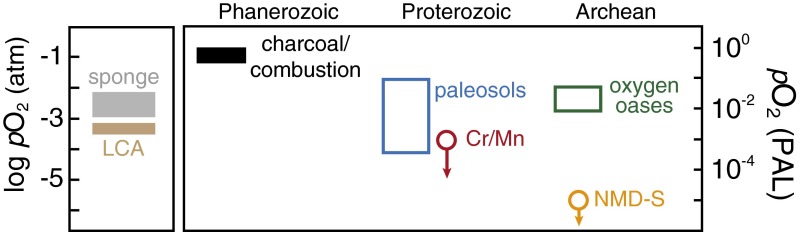
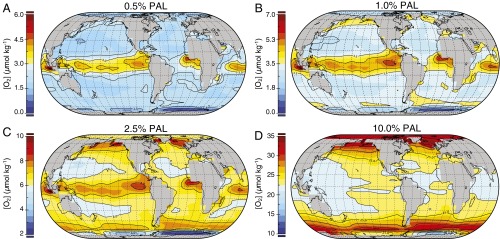
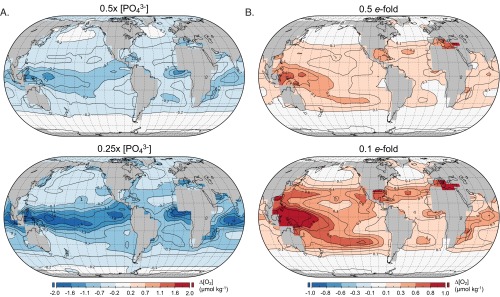
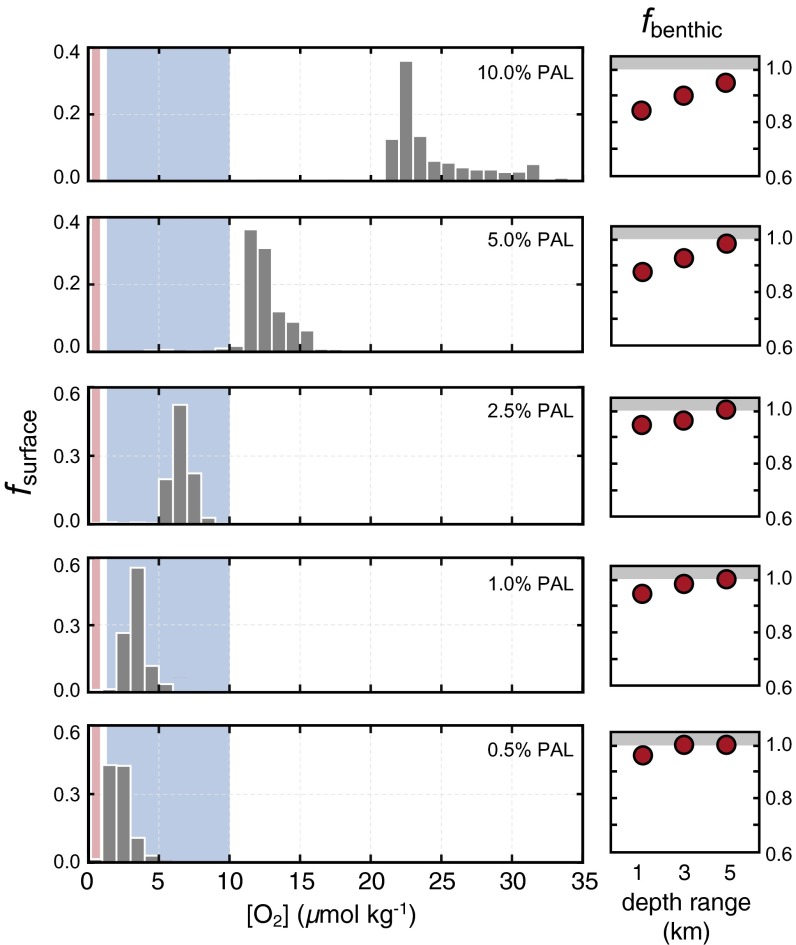
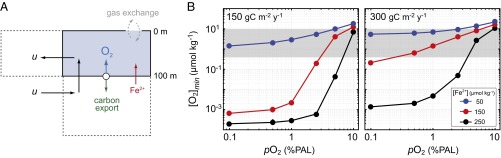
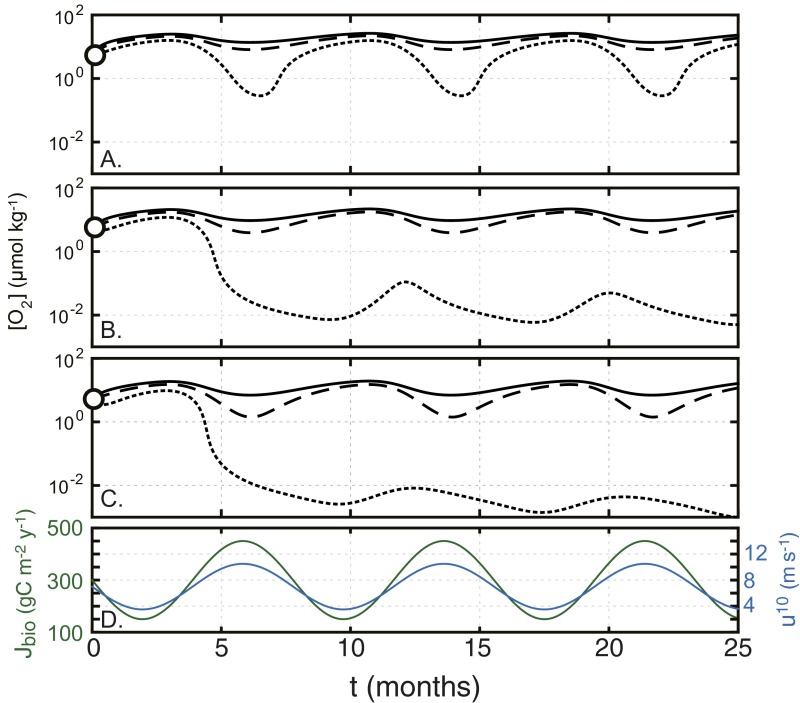
The emergence and expansion of complex eukaryotic life on Earth is linked at a basic level to the secular evolution of surface oxygen levels. However, the role that planetary redox evolution has played in controlling the timing of metazoan (animal) emergence and diversification, if any, has been intensely debated. Discussion has gravitated toward threshold levels of environmental free oxygen (O2) necessary for early evolving animals to survive under controlled conditions. However, defining such thresholds in practice is not straightforward, and environmental O2 levels can potentially constrain animal life in ways distinct from threshold O2 tolerance. Herein, we quantitatively explore one aspect of the evolutionary coupling between animal life and Earth's oxygen cycle-the influence of spatial and temporal variability in surface ocean O2 levels on the ecology of early metazoan organisms. Through the application of a series of quantitative biogeochemical models, we find that large spatiotemporal variations in surface ocean O2 levels and pervasive benthic anoxia are expected in a world with much lower atmospheric pO2 than at present, resulting in severe ecological constraints and a challenging evolutionary landscape for early metazoan life. We argue that these effects, when considered in the light of synergistic interactions with other environmental parameters and variable O2 demand throughout an organism's life history, would have resulted in long-term evolutionary and ecological inhibition of animal life on Earth for much of Middle Proterozoic time (∼1.8-0.8 billion years ago).

Keywords: Proterozoic; animals; evolution; oxygen.


Conflict of interest statement

The authors declare no conflict of interest.

Figures

Fig. 1.
Fig. 1.
Biological thresholds and geochemical constraints on Earth surface O2 levels. (Left) Estimated minimum metabolic O2 requirements of sponges (gray) (12) and the LCA of bilaterian metazoans (brown) (13). (Right) Estimated environmental O2 levels based on the plant fossil and charcoal record during the Phanerozoic (37); fossilized soil profiles during the Proterozoic (blue), recalculated following ref. according to pCO2 values in ref. ; chromium (Cr) and manganese (Mn) systematics of marine chemical sediments and ancient soil profiles (red) (11); non-mass-dependent sulfur (S) isotope fractionation in sedimentary rocks (orange) (40); and 0D and 3D Earth system models for Archean oxygen oasis systems (green) (−22). Downward arrows represent upper bounds on atmospheric O2 levels, and the range for oxygen oases refers to the estimated atmospheric pO2 value at gas exchange equilibrium.
Fig. 2.
Fig. 2.
Results from the EMIC [Grid Enabled Integrated Earth System Model [GENIE]). Steady-state dissolved oxygen concentrations in the surface layer of the ocean after 20-thousand-year spinup for atmospheric pO2 values of (A) 0.5%, (B) 1.0%, (C) 2.5%, and (D) 10.0% of the PAL. Note the differing scales for [O2] for each background pO2 level.
Fig. S1.
Fig. S1.
Sensitivity simulations for steady-state surface ocean O2 distributions. All panels show oxygen concentration anomalies (∆[O2], in micromoles per kilogram) for a given experiment relative to the baseline case presented in Fig. 1 (e.g., [O2]experiment – [O2]baseline, such that negative values represent lower oxygen levels than the baseline case and positive values represent higher levels). (A) Simulations with 0.5× and 0.25× the modern marine nutrient inventory. (B) Simulations with 0.5× and 0.1× the modern organic carbon remineralization length scale.
Fig. 3.
Fig. 3.
(Left) Relative frequency distributions for dissolved oxygen concentration in surface ocean grid cells (fsurface) and (Right) the fraction of benthic grid cells that are anoxic (fbenthic) for a range of atmospheric pO2 levels. Relative fraction of benthic grid cells that are anoxic are calculated for three different cumulative depth ranges, the upper 1 km, upper 3 km, and upper 5 km of the ocean. Shaded blue boxes denote estimated ranges for basal metazoan organisms derived from laboratory experiments (12), and red boxes show lower limits for bilaterian organisms estimated from theoretical calculations (13).
Fig. 4.
Fig. 4.
Results of the time-dependent biogeochemical model. (A) A schematic depiction of the main processes represented by the model. (B) Minimum seasonal dissolved oxygen concentrations in the surface ocean as a function of background atmospheric pO2 value for two different baseline carbon export rates (Left and Right), and at deep [Fe2+] levels of 50 µmol⋅kg−1 (blue), 150 µmol⋅kg−1 (red), and 250 µmol⋅kg−1 (black). Gray shaded box encompasses the biological limits denoted in Fig. 1.
Fig. S2.
Fig. S2.
Representative results for seasonal [O2] oscillation in the time-dependent model. (AC) Dissolved [O2] in the surface ocean box is shown as a function of time according to the time-dependent forcing in organic carbon export (green) and surface wind speed (blue) shown in D. Results are shown for atmospheric pO2 values of (A) 2.5%, (B) 1.0%, and (C) 0.5% of the PAL. In each panel, curves correspond to assumed deep ocean [Fe2+] values of 50 µmol⋅kg−1 (solid), 150 µmol⋅kg−1 (dashed), and 250 µmol⋅kg−1 (dotted).

References

    1. Nursall JR. Oxygen as a prerequisite to the origin of the Metazoa. Nature. 1959;183(4669):1170–1172.
    1. Froelich PN, et al. Early oxidation of organic matter in pelagic sediments of the eastern equatorial Atlantic: Suboxic diagenesis. Geochim Cosmochim Acta. 1979;43(7):1075–1090.
    1. Lane N, Martin W. The energetics of genome complexity. Nature. 2010;467(7318):929–934. - PubMed
    1. Booth A, Doolittle WF. Reply to Lane and Martin: Being and becoming eukaryotes. Proc Natl Acad Sci USA. 2015;112(35):E4824. - PMC - PubMed
    1. Summons RE, Bradley AS, Jahnke LL, Waldbauer JR. Steroids, triterpenoids and molecular oxygen. Philos Trans R Soc Lond B Biol Sci. 2006;361(1470):951–968. - PMC - PubMed

Publication types

LinkOut - more resources